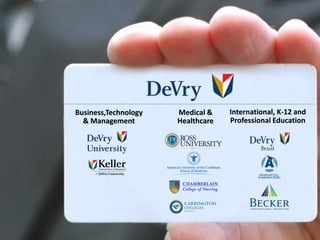
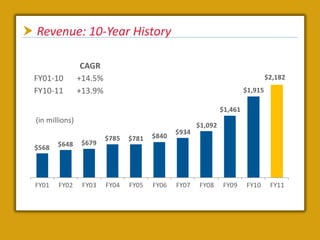
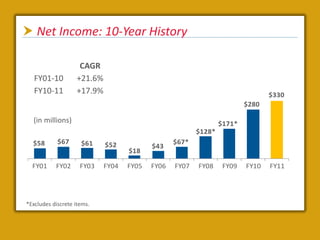
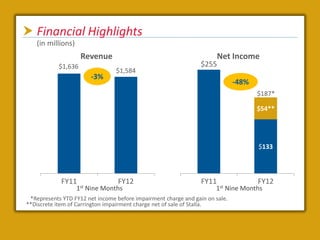
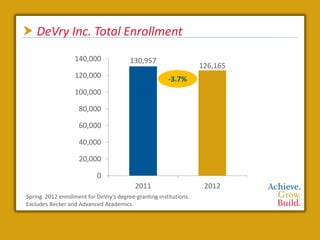
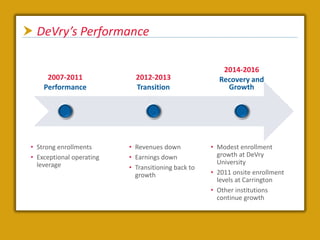
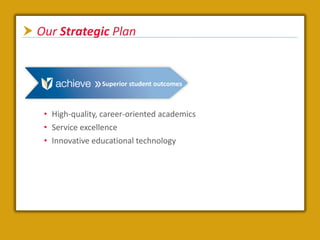
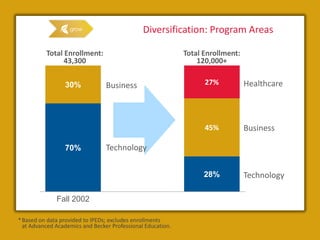
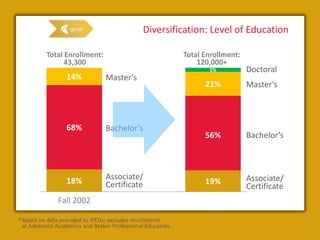
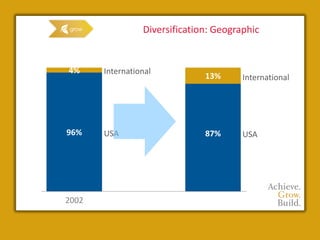
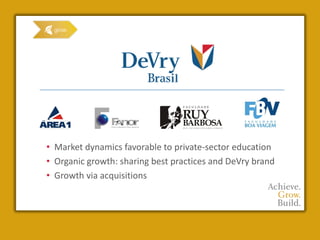
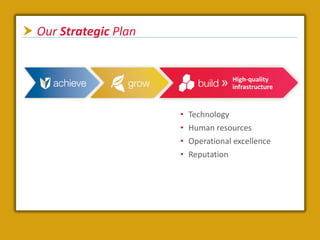
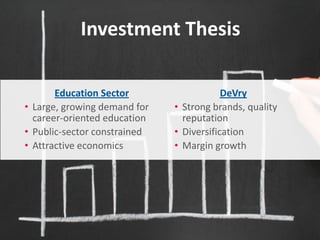
Achieve. Grow. Build.
 Forward-Looking Statements
  Certain statements contained in this presentation concerning
  DeVry’s future performance, including those statements concerning
  DeVry’s expectations or plans, may constitute forward-looking
  statements subject to the Safe Harbor Provision of the Private
  Securities Litigation Reform Act of 1995. These forward-looking
  statements generally can be identified by phrases such as DeVry
  Inc. or its management “believes,” “expects,” “anticipates,”
  “foresees,” “forecasts,” “estimates” or other words or phrases of
  similar import. Actual results may differ materially from those
  projected or implied by these forward-looking statements. Potential
  risks, uncertainties and other factors that could cause results to
  differ are described more fully in Item 1A, “Risk Factors,”
  in DeVry’s most recent Annual Report on Form 10-K
  for the year ending June 30, 2010 and filed with the
  Securities and Exchange Commission on August 25, 2011.



    Business,Technology   Medical &    International, K-12 and
      & Management        Healthcare   Professional Education
Student Outcomes


  NCLEX Pass
    Rate
     95%
Student Outcomes
Student Outcomes
                   Achieves AVMA
                     Accreditation
 Revenue: 10-Year History

                   CAGR
  FY01-10         +14.5%                                                          $2,182
  FY10-11         +13.9%                                                 $1,915

                                                                $1,461
  (in millions)
                                                       $1,092
                                                $934
                           $785   $781   $840
         $648      $679
  $568


  FY01   FY02      FY03    FY04   FY05   FY06   FY07   FY08     FY09     FY10      FY11
 Net Income: 10-Year History

                    CAGR
   FY01-10         +21.6%
   FY10-11         +17.9%                                                      $330
                                                                        $280

  (in millions)                                                 $171*
                                                        $128*
  $58       $67      $61    $52                  $67*
                                          $43
                                   $18

  FY01     FY02      FY03   FY04   FY05   FY06   FY07   FY08     FY09   FY10   FY11


*Excludes discrete items.
 Financial Highlights
   (in millions)
                     Revenue                                            Net Income
            $1,636                                               $255
                                  $1,584
                          -3%
                                                                              -48%
                                                                                     $187*

                                                                                     $54**


                                                                                     $133


             FY11                 FY12                           FY11                FY12
                   1st   Nine Months                                  1st   Nine Months
 *Represents YTD FY12 net income before impairment charge and gain on sale.
**Discrete item of Carrington impairment charge net of sale of Stalla.
 DeVry Inc. Total Enrollment
                   140,000              130,957
                                                                   126,165
                   120,000                             -3.7%
                   100,000

                    80,000

                    60,000

                    40,000

                    20,000

                           0
                                          2011                      2012
Spring 2012 enrollment for DeVry’s degree-granting institutions.
Excludes Becker and Advanced Academics.
 Strong Financial Position
  (in millions)
                        Cash                                            Debt
                                                  $200
 $700
                                    $599
 $600
                                                  $150
 $500                                                    $125                 $125

 $400
                             $323          $332   $100
 $300          $277
                      $225
 $200
        $129                                      $50

 $100
                                                                $0     $0            $0     $0
   $0                                              $0
        FY07 FY08 FY09 FY10 FY11 Thru                    FY07   FY08   FY09   FY10   FY11   Thru
                                 Q312                                                       Q312
 DeVry’s Performance

                                                        2014-2016
      2007-2011              2012-2013                 Recovery and
     Performance             Transition                  Growth


 • Strong enrollments      • Revenues down           • Modest enrollment
 • Exceptional operating   • Earnings down             growth at DeVry
   leverage                                            University
                           • Transitioning back to
                             growth                  • 2011 onsite enrollment
                                                       levels at Carrington
                                                     • Other institutions
                                                       continue growth
5 Point Performance Improvement Plan
5 Point Performance
      Improvement Plan

1. Aligning costs with enrollment
   levels
   • $25m since 3Q11
   • Additional $50m in FY13
   • Focused on DeVry University
     and Carrington Colleges
5 Point Performance
      Improvement Plan

1. Aligning costs with enrollment
   levels
2. Enhance recruiting process
3. Improve awareness building
5 Point Performance
      Improvement Plan

1. Aligning costs with enrollment
   levels
2. Enhance recruiting process
3. Improve awareness building
4. Targeted investments
   to drive growth
 Growth Investments


                       acquires
 Growth Investments
5 Point Performance
      Improvement Plan

1. Aligning costs with enrollment
   levels
2. Enhance recruiting process
3. Improve awareness building
4. Targeted investments
   to drive growth
5. Invest in DeVry’s people
Developing
    our

  Faculty
Delivering Long-Term Value
 Our Strategic Plan


                  Superior student outcomes


   • High-quality, career-oriented academics
   • Service excellence
   • Innovative educational technology
 Our Strategic Plan


                              and diversify


               • Program areas
               • Levels of education
               • Geographic
Diversification: Program Areas

          Total Enrollment:                                  Total Enrollment:
                43,300                                           120,000+


                 30%             Business                          27%           Healthcare


                                                                   45%           Business

                 70%             Technology

                                                                   28%           Technology

              Fall 2002                                         Fall 2010

* Based on data provided to IPEDs; excludes enrollments
  at Advanced Academics and Becker Professional Education.
Diversification: Level of Education

          Total Enrollment:                                  Total Enrollment:
                43,300                                           120,000+
                                                                    5%           Doctoral
                  14%            Master’s
                                                                   21%           Master’s


                  68%            Bachelor’s
                                                                   56%           Bachelor’s


                  18%            Associate/                                      Associate/
                                 Certificate                       19%
                                                                                 Certificate
               Fall 2002                                         Fall 2011

* Based on data provided to IPEDs; excludes enrollments
  at Advanced Academics and Becker Professional Education.
Diversification: Geographic


4%     International
                               13%      International


96%    USA                     87%      USA


2002                           2011
• Market dynamics favorable to private-sector education
• Organic growth: sharing best practices and DeVry brand
• Growth via acquisitions
 Our Strategic Plan


                                      High-quality
                                      infrastructure


                       •   Technology
                       •   Human resources
                       •   Operational excellence
                       •   Reputation
 Our Strategic Plan


 Strengthen our Core   Grow our Core and   Invest to Support our Strategy
                           Diversify              and Organization
 Allocating Capital
         • Strengthen and grow the core
         • Diversify beyond the core
         • Dividends and share repurchases
           Investment Thesis

       Education Sector                   DeVry
• Large, growing demand for   • Strong brands, quality
  career-oriented education     reputation
• Public-sector constrained   • Diversification
• Attractive economics        • Margin growth
Achieve. Grow. Build.

Dv investor prez

  • 1.
  • 2.
     Forward-Looking Statements Certain statements contained in this presentation concerning DeVry’s future performance, including those statements concerning DeVry’s expectations or plans, may constitute forward-looking statements subject to the Safe Harbor Provision of the Private Securities Litigation Reform Act of 1995. These forward-looking statements generally can be identified by phrases such as DeVry Inc. or its management “believes,” “expects,” “anticipates,” “foresees,” “forecasts,” “estimates” or other words or phrases of similar import. Actual results may differ materially from those projected or implied by these forward-looking statements. Potential risks, uncertainties and other factors that could cause results to differ are described more fully in Item 1A, “Risk Factors,” in DeVry’s most recent Annual Report on Form 10-K for the year ending June 30, 2010 and filed with the Securities and Exchange Commission on August 25, 2011.
  • 3.
    Business,Technology Medical & International, K-12 and & Management Healthcare Professional Education
  • 6.
    Student Outcomes NCLEX Pass Rate 95%
  • 7.
  • 8.
    Student Outcomes Achieves AVMA Accreditation
  • 10.
     Revenue: 10-YearHistory CAGR FY01-10 +14.5% $2,182 FY10-11 +13.9% $1,915 $1,461 (in millions) $1,092 $934 $785 $781 $840 $648 $679 $568 FY01 FY02 FY03 FY04 FY05 FY06 FY07 FY08 FY09 FY10 FY11
  • 11.
     Net Income:10-Year History CAGR FY01-10 +21.6% FY10-11 +17.9% $330 $280 (in millions) $171* $128* $58 $67 $61 $52 $67* $43 $18 FY01 FY02 FY03 FY04 FY05 FY06 FY07 FY08 FY09 FY10 FY11 *Excludes discrete items.
  • 12.
     Financial Highlights (in millions) Revenue Net Income $1,636 $255 $1,584 -3% -48% $187* $54** $133 FY11 FY12 FY11 FY12 1st Nine Months 1st Nine Months *Represents YTD FY12 net income before impairment charge and gain on sale. **Discrete item of Carrington impairment charge net of sale of Stalla.
  • 13.
     DeVry Inc.Total Enrollment 140,000 130,957 126,165 120,000 -3.7% 100,000 80,000 60,000 40,000 20,000 0 2011 2012 Spring 2012 enrollment for DeVry’s degree-granting institutions. Excludes Becker and Advanced Academics.
  • 14.
     Strong FinancialPosition (in millions) Cash Debt $200 $700 $599 $600 $150 $500 $125 $125 $400 $323 $332 $100 $300 $277 $225 $200 $129 $50 $100 $0 $0 $0 $0 $0 $0 FY07 FY08 FY09 FY10 FY11 Thru FY07 FY08 FY09 FY10 FY11 Thru Q312 Q312
  • 15.
     DeVry’s Performance 2014-2016 2007-2011 2012-2013 Recovery and Performance Transition Growth • Strong enrollments • Revenues down • Modest enrollment • Exceptional operating • Earnings down growth at DeVry leverage University • Transitioning back to growth • 2011 onsite enrollment levels at Carrington • Other institutions continue growth
  • 16.
    5 Point PerformanceImprovement Plan
  • 17.
    5 Point Performance Improvement Plan 1. Aligning costs with enrollment levels • $25m since 3Q11 • Additional $50m in FY13 • Focused on DeVry University and Carrington Colleges
  • 18.
    5 Point Performance Improvement Plan 1. Aligning costs with enrollment levels 2. Enhance recruiting process 3. Improve awareness building
  • 20.
    5 Point Performance Improvement Plan 1. Aligning costs with enrollment levels 2. Enhance recruiting process 3. Improve awareness building 4. Targeted investments to drive growth
  • 21.
  • 22.
  • 23.
    5 Point Performance Improvement Plan 1. Aligning costs with enrollment levels 2. Enhance recruiting process 3. Improve awareness building 4. Targeted investments to drive growth 5. Invest in DeVry’s people
  • 24.
    Developing our Faculty
  • 25.
  • 26.
  • 27.
     Our StrategicPlan Superior student outcomes • High-quality, career-oriented academics • Service excellence • Innovative educational technology
  • 28.
     Our StrategicPlan and diversify • Program areas • Levels of education • Geographic
  • 29.
    Diversification: Program Areas Total Enrollment: Total Enrollment: 43,300 120,000+ 30% Business 27% Healthcare 45% Business 70% Technology 28% Technology Fall 2002 Fall 2010 * Based on data provided to IPEDs; excludes enrollments at Advanced Academics and Becker Professional Education.
  • 30.
    Diversification: Level ofEducation Total Enrollment: Total Enrollment: 43,300 120,000+ 5% Doctoral 14% Master’s 21% Master’s 68% Bachelor’s 56% Bachelor’s 18% Associate/ Associate/ Certificate 19% Certificate Fall 2002 Fall 2011 * Based on data provided to IPEDs; excludes enrollments at Advanced Academics and Becker Professional Education.
  • 31.
    Diversification: Geographic 4% International 13% International 96% USA 87% USA 2002 2011
  • 32.
    • Market dynamicsfavorable to private-sector education • Organic growth: sharing best practices and DeVry brand • Growth via acquisitions
  • 33.
     Our StrategicPlan High-quality infrastructure • Technology • Human resources • Operational excellence • Reputation
  • 34.
     Our StrategicPlan Strengthen our Core Grow our Core and Invest to Support our Strategy Diversify and Organization
  • 35.
     Allocating Capital • Strengthen and grow the core • Diversify beyond the core • Dividends and share repurchases
  • 36.
    Investment Thesis Education Sector DeVry • Large, growing demand for • Strong brands, quality career-oriented education reputation • Public-sector constrained • Diversification • Attractive economics • Margin growth
  • 37.