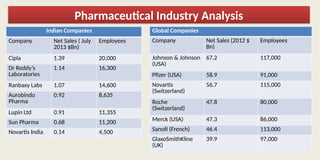
Pharmaceutical Industry Analysis
IndianCompanies
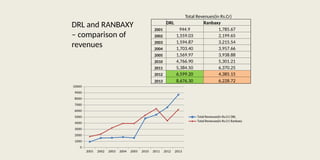
Company Net Sales ( July
2013 $Bn)
Employees
Cipla 1.39 20,000
Dr Reddy’s
Laboratories
1.14 16,300
Ranbaxy Labs 1.07 14,600
Aurobindo
Pharma
0.92 8,635
Lupin Ltd 0.91 11,355
Sun Pharma 0.68 11,200
Novartis India 0.14 4,500
Global Companies
Company Net Sales (2012 $
Bn)
Employees
Johnson & Johnson
(USA)
67.2 117,000
Pfizer (USA) 58.9 91,000
Novartis
(Switzerland)
56.7 115,000
Roche
(Switzerland)
47.8 80,000
Merck (USA) 47.3 86,000
Sanofi (French) 46.4 113,000
GlaxoSmithKline
(UK)
39.9 97,000
3.
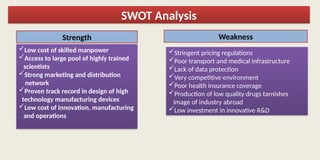
SWOT Analysis
Strength
Low costof skilled manpower
Access to large pool of highly trained
scientists
Strong marketing and distribution
network
Proven track record in design of high
technology manufacturing devices
Low cost of innovation, manufacturing
and operations
Weakness
Stringent pricing regulations
Poor transport and medical infrastructure
Lack of data protection
Very competitive environment
Poor health insurance coverage
Production of low quality drugs tarnishes
image of industry abroad
Low investment in innovative R&D
4.
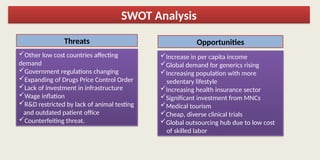
SWOT Analysis
Threats
Other lowcost countries affecting
demand
Government regulations changing
Expanding of Drugs Price Control Order
Lack of investment in infrastructure
Wage inflation
R&D restricted by lack of animal testing
and outdated patient office
Counterfeiting threat.
Opportunities
Increase in per capita income
Global demand for generics rising
Increasing population with more
sedentary lifestyle
Increasing health insurance sector
Significant investment from MNCs
Medical tourism
Cheap, diverse clinical trials
Global outsourcing hub due to low cost
of skilled labor
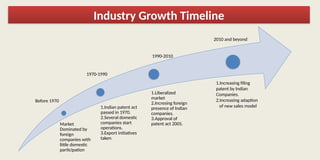
5.
Market
Dominated by
foreign
companies with
littledomestic
participation
1.Indian patent act
passed in 1970.
2.Several domestic
companies start
operations.
3.Export initiatives
taken
1.Liberalized
market
2.Incresing foreign
presence of Indian
companies.
3.Approval of
patent act 2005.
Before 1970
1970-1990
1990-2010
1.Increasing filing
patent by Indian
Companies.
2.Increasing adaption
of new sales model
Industry Growth Timeline
2010 and beyond
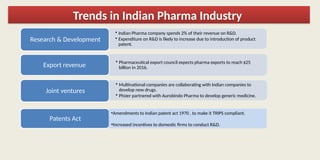
6.
• Indian Pharmacompany spends 2% of their revenue on R&D.
• Expenditure on R&D is likely to increase due to introduction of product
patent.
Research & Development
• Pharmaceutical export council expects pharma exports to reach $25
billion in 2016.
Export revenue
• Multinational companies are collaborating with Indian companies to
develop new drugs.
• Phizer partnered with Aurobindo Pharma to develop generic medicine.
Joint ventures
Patents Act
Trends in Indian Pharma Industry
•Amendments to Indian patent act 1970 , to make it TRIPS compliant.
•Increased incentives to domestic firms to conduct R&D.
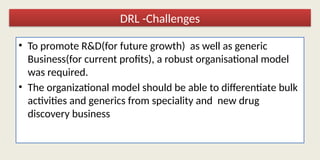
7.
• To promoteR&D(for future growth) as well as generic
Business(for current profits), a robust organisational model
was required.
• The organizational model should be able to differentiate bulk
activities and generics from speciality and new drug
discovery business
DRL -Challenges
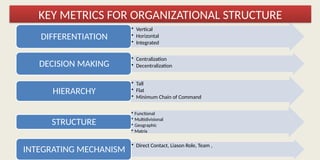
8.
• Vertical
• Horizontal
•Integrated
DIFFERENTIATION
• Centralization
• Decentralization
DECISION MAKING
• Tall
• Flat
• Minimum Chain of Command
HIERARCHY
• Functional
• Multidivisional
• Geographic
• Matrix
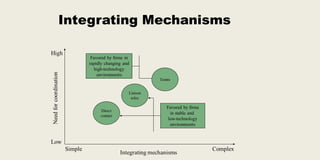
STRUCTURE
• Direct Contact, Liason Role, Team ,
INTEGRATING MECHANISM
KEY METRICS FOR ORGANIZATIONAL STRUCTURE
10.
• Incorporated in1961, as a family-owned business
• Chairman – Dr.Tsutomu Une ; CEO & Managing Director – Arun Sawhney
• Ranbaxy was facing many issues such as
– poor financial position,
– no major R&D breakthroughs,
– increasing price wars
– stiff competition in the generics market.
• In order to maintain its growth and market position, Ranbaxy needed an influx of fresh funds
• Daiichi Sankyo wanted to manufacture low cost generics because of Japan government’s new policy
• In June 2008, Daiichi Sankyo acquired over 51% stake in Ranbaxy Laboratories Ltd at Rs. 737 per share.
• Malvinder Singh sold out his stake of 34.8% to Daiichi Sankyo .
• The new entity is a significant milestone in the Ranbaxy’s mission of becoming a research-based international
pharmaceutical company.
RANBAXY LABORATORIES
11.
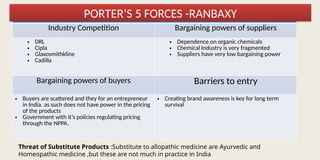
PORTER’S FIVE FORCES
IndustryCompetition Bargaining powers of suppliers
• DRL
• Cipla
• Glaxosmithkline
• Cadilla
• Dependence on organic chemicals
• Chemical Industry is very fragmented
• Suppliers have very low bargaining power
Bargaining powers of buyers Barriers to entry
• Buyers are scattered and they for an entrepreneur
in India. as such does not have power in the pricing
of the products
• Government with it’s policies regulating pricing
through the NPPA.
• Creating brand awareness is key for long term
survival
Threat of Substitute Products :Substitute to allopathic medicine are Ayurvedic and
Homeopathic medicine ,but these are not much in practice in India
PORTER’S 5 FORCES -RANBAXY
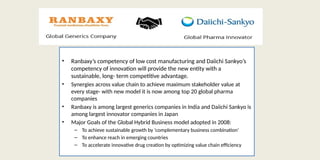
12.
• Ranbaxy’s competencyof low cost manufacturing and Daiichi Sankyo’s
competency of innovation will provide the new entity with a
sustainable, long- term competitive advantage.
• Synergies across value chain to achieve maximum stakeholder value at
every stage- with new model it is now among top 20 global pharma
companies
• Ranbaxy is among largest generics companies in India and Daiichi Sankyo is
among largest innovator companies in Japan
• Major Goals of the Global Hybrid Business model adopted in 2008:
– To achieve sustainable growth by ‘complementary business combination’
– To enhance reach in emerging countries
– To accelerate innovative drug creation by optimizing value chain efficiency
13.
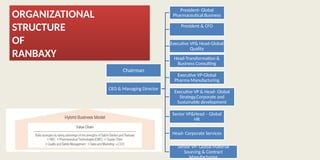
Chairman
CEO & ManagingDirector
President- Global
Pharmaceutical Business
President & CFO
Executive VP& Head-Global
Quality
Executive VP-Global
Pharma Manufacturing
Head-Transformation &
Business Consulting
Executive VP & Head- Global
Strategy,Corporate and
Sustainable development
Senior VP&Head – Global
HR
Head- Corporate Services
Senior VP- Global Material
Sourcing & Contract
Manufacturing
ORGANIZATIONAL
STRUCTURE
OF
RANBAXY
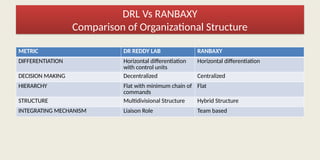
METRIC DR REDDYLAB RANBAXY
DIFFERENTIATION Horizontal differentiation
with control units
Horizontal differentiation
DECISION MAKING Decentralized Centralized
HIERARCHY Flat with minimum chain of
commands
Flat
STRUCTURE Multidivisional Structure Hybrid Structure
INTEGRATING MECHANISM Liaison Role Team based
DRL Vs RANBAXY
Comparison of Organizational Structure
16.
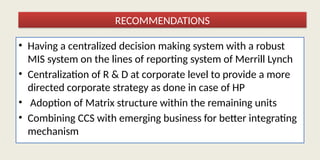
• Having acentralized decision making system with a robust
MIS system on the lines of reporting system of Merrill Lynch
• Centralization of R & D at corporate level to provide a more
directed corporate strategy as done in case of HP
• Adoption of Matrix structure within the remaining units
• Combining CCS with emerging business for better integrating
mechanism
RECOMMENDATIONS