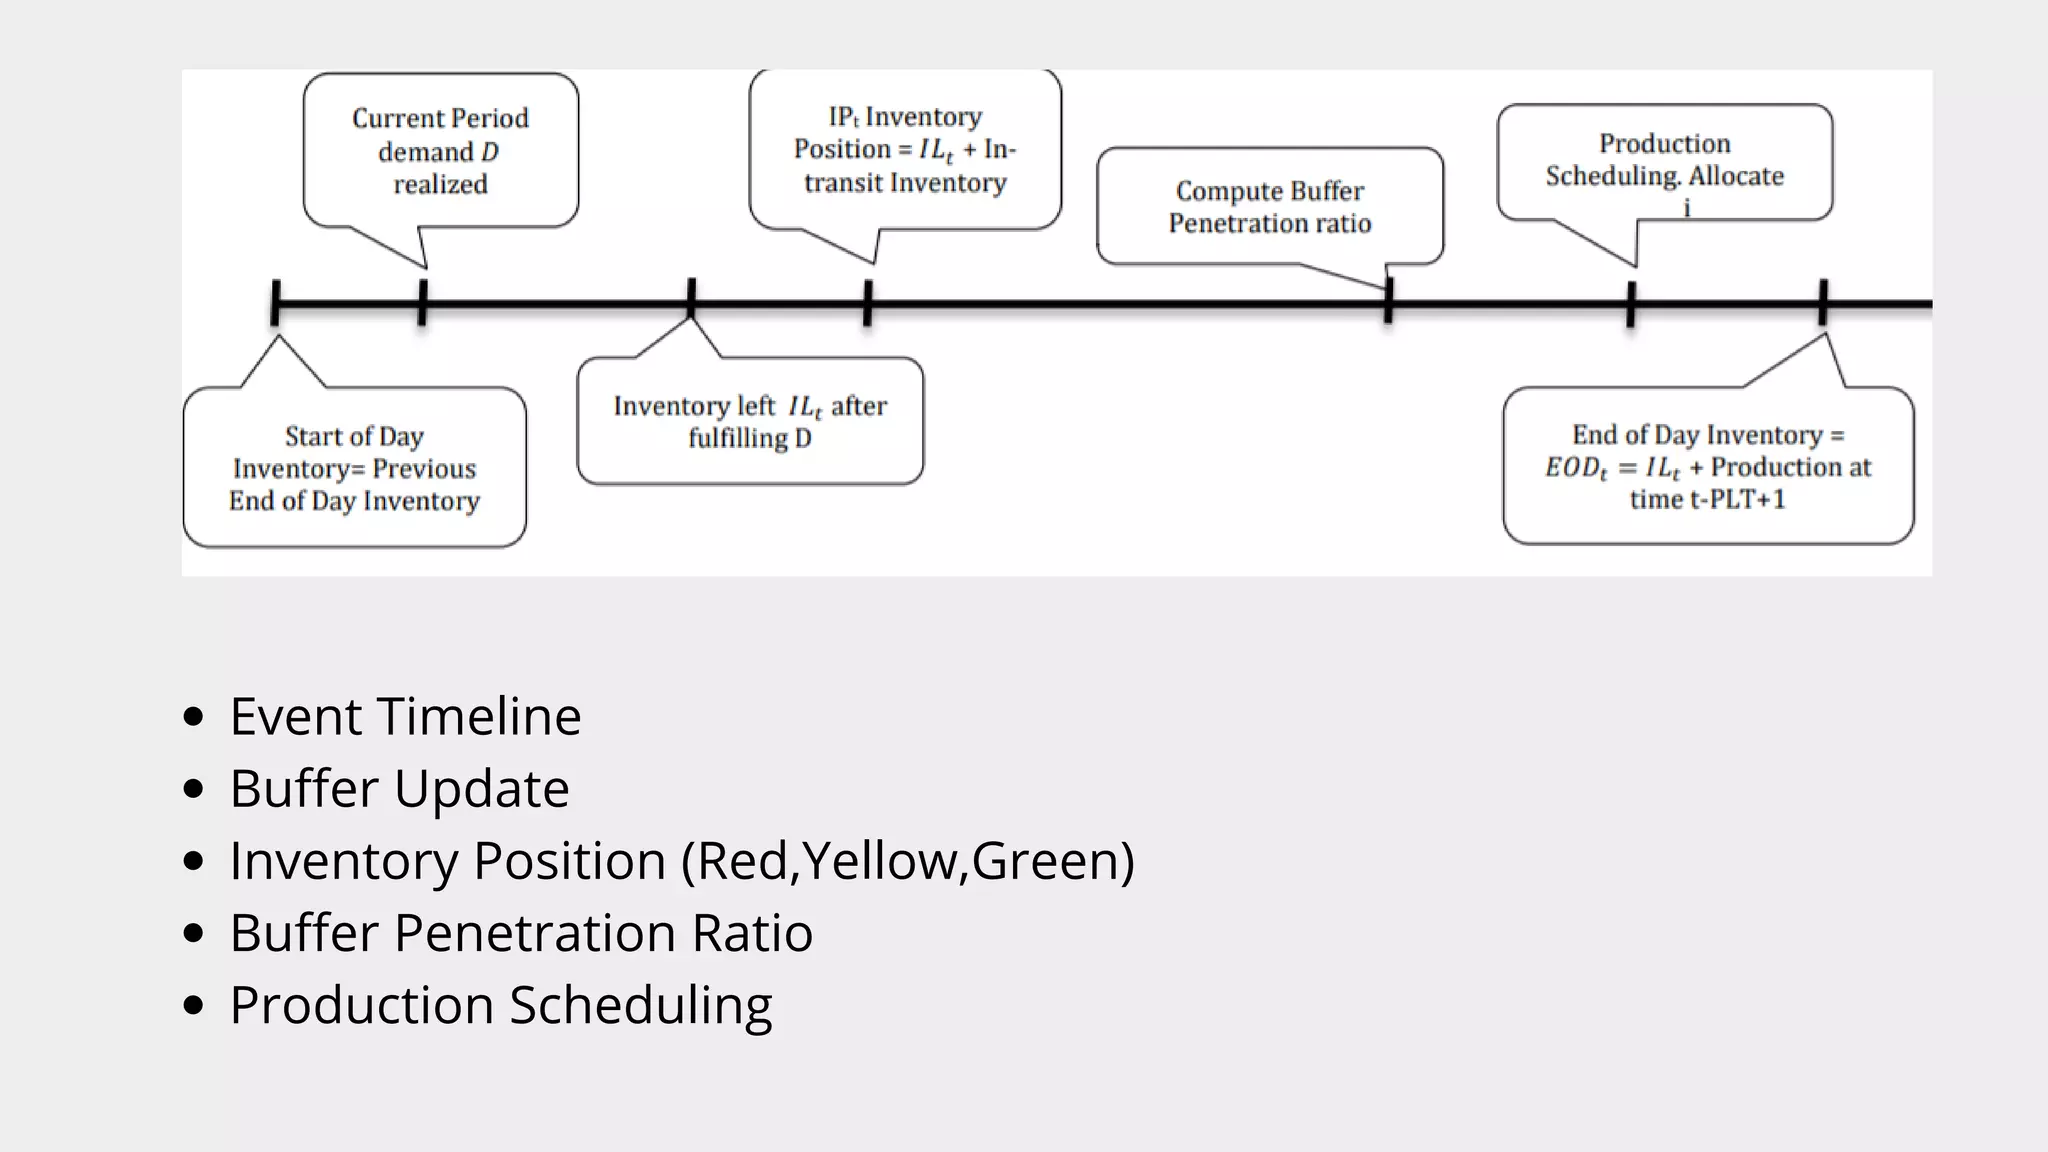
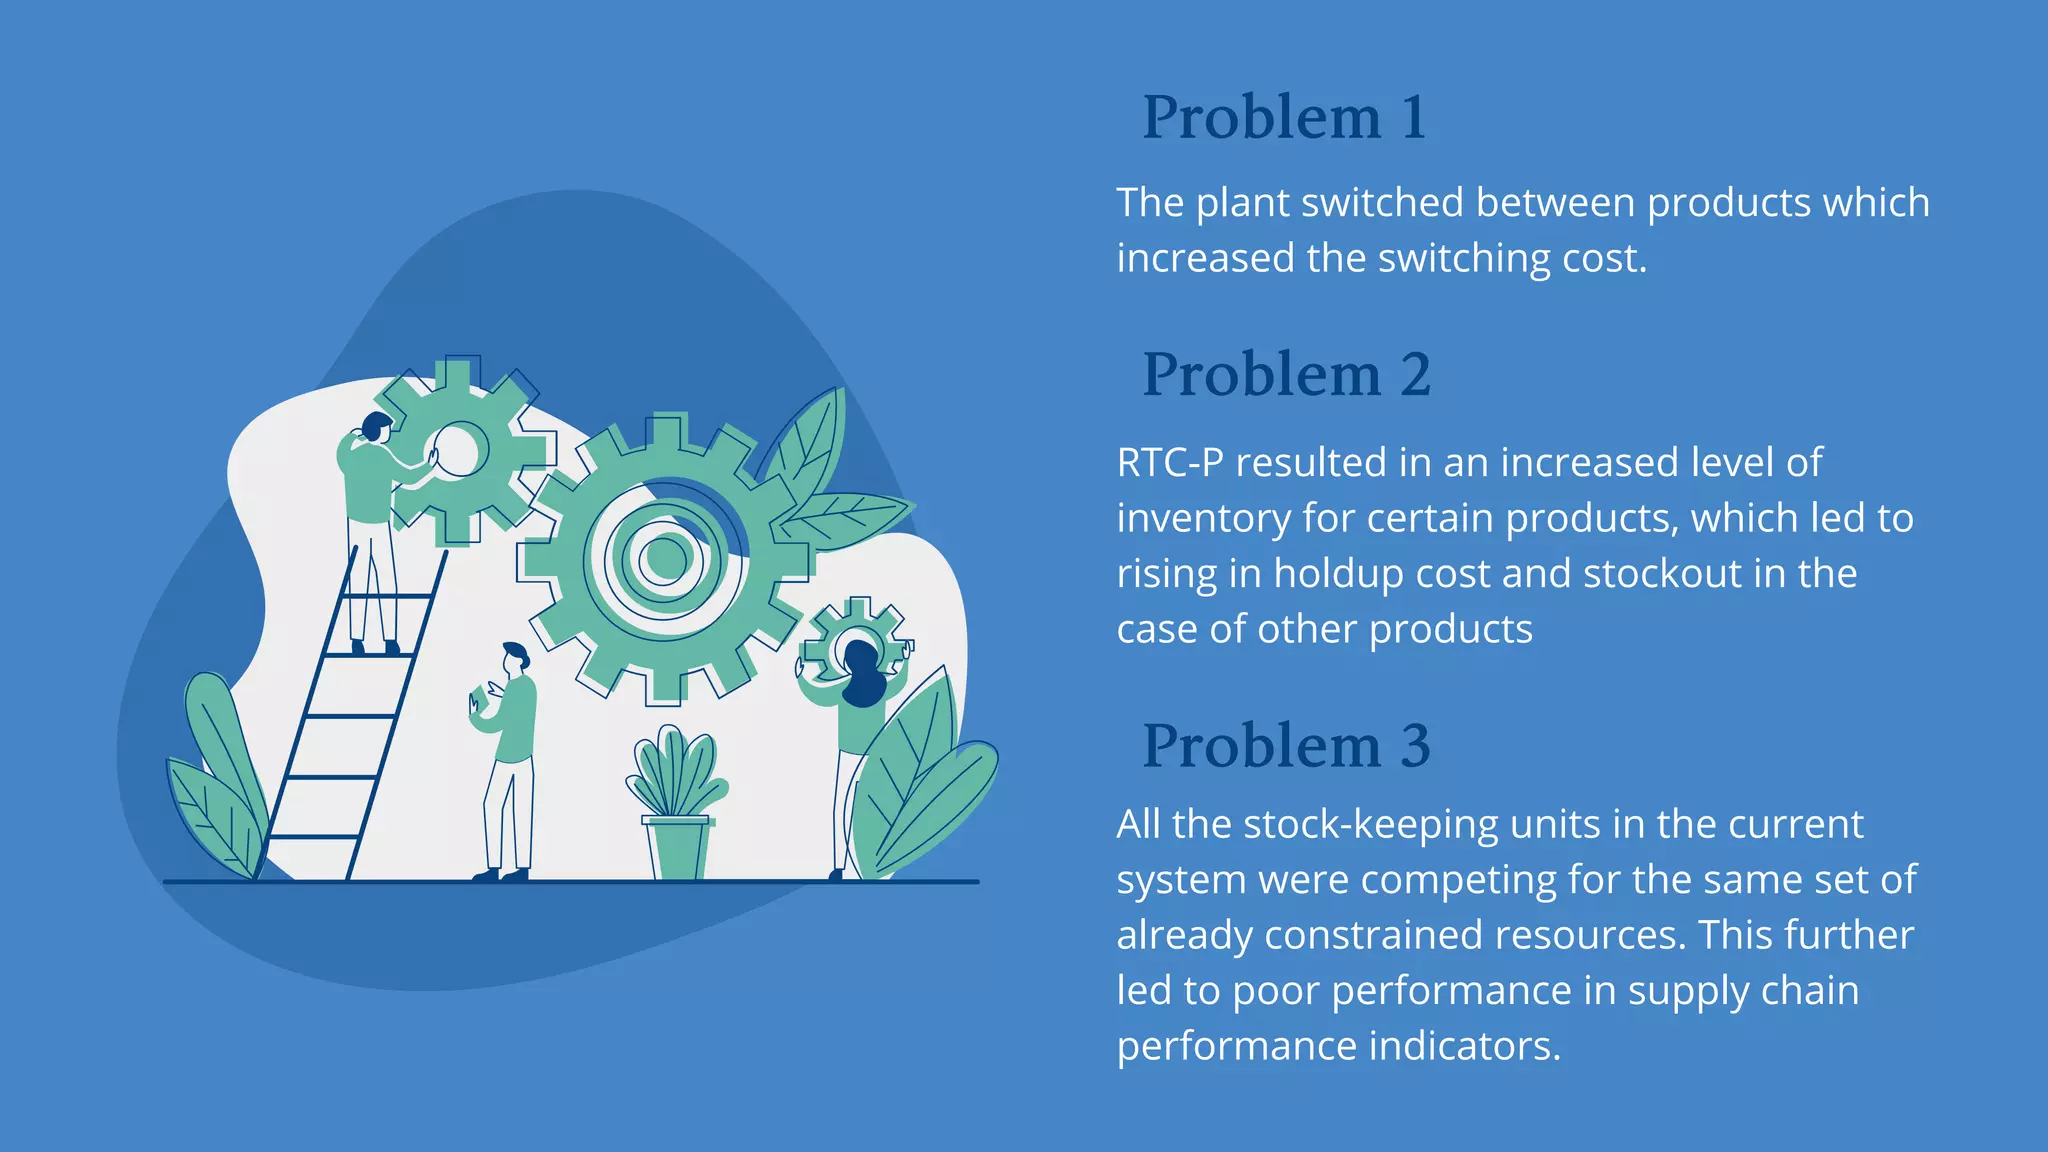
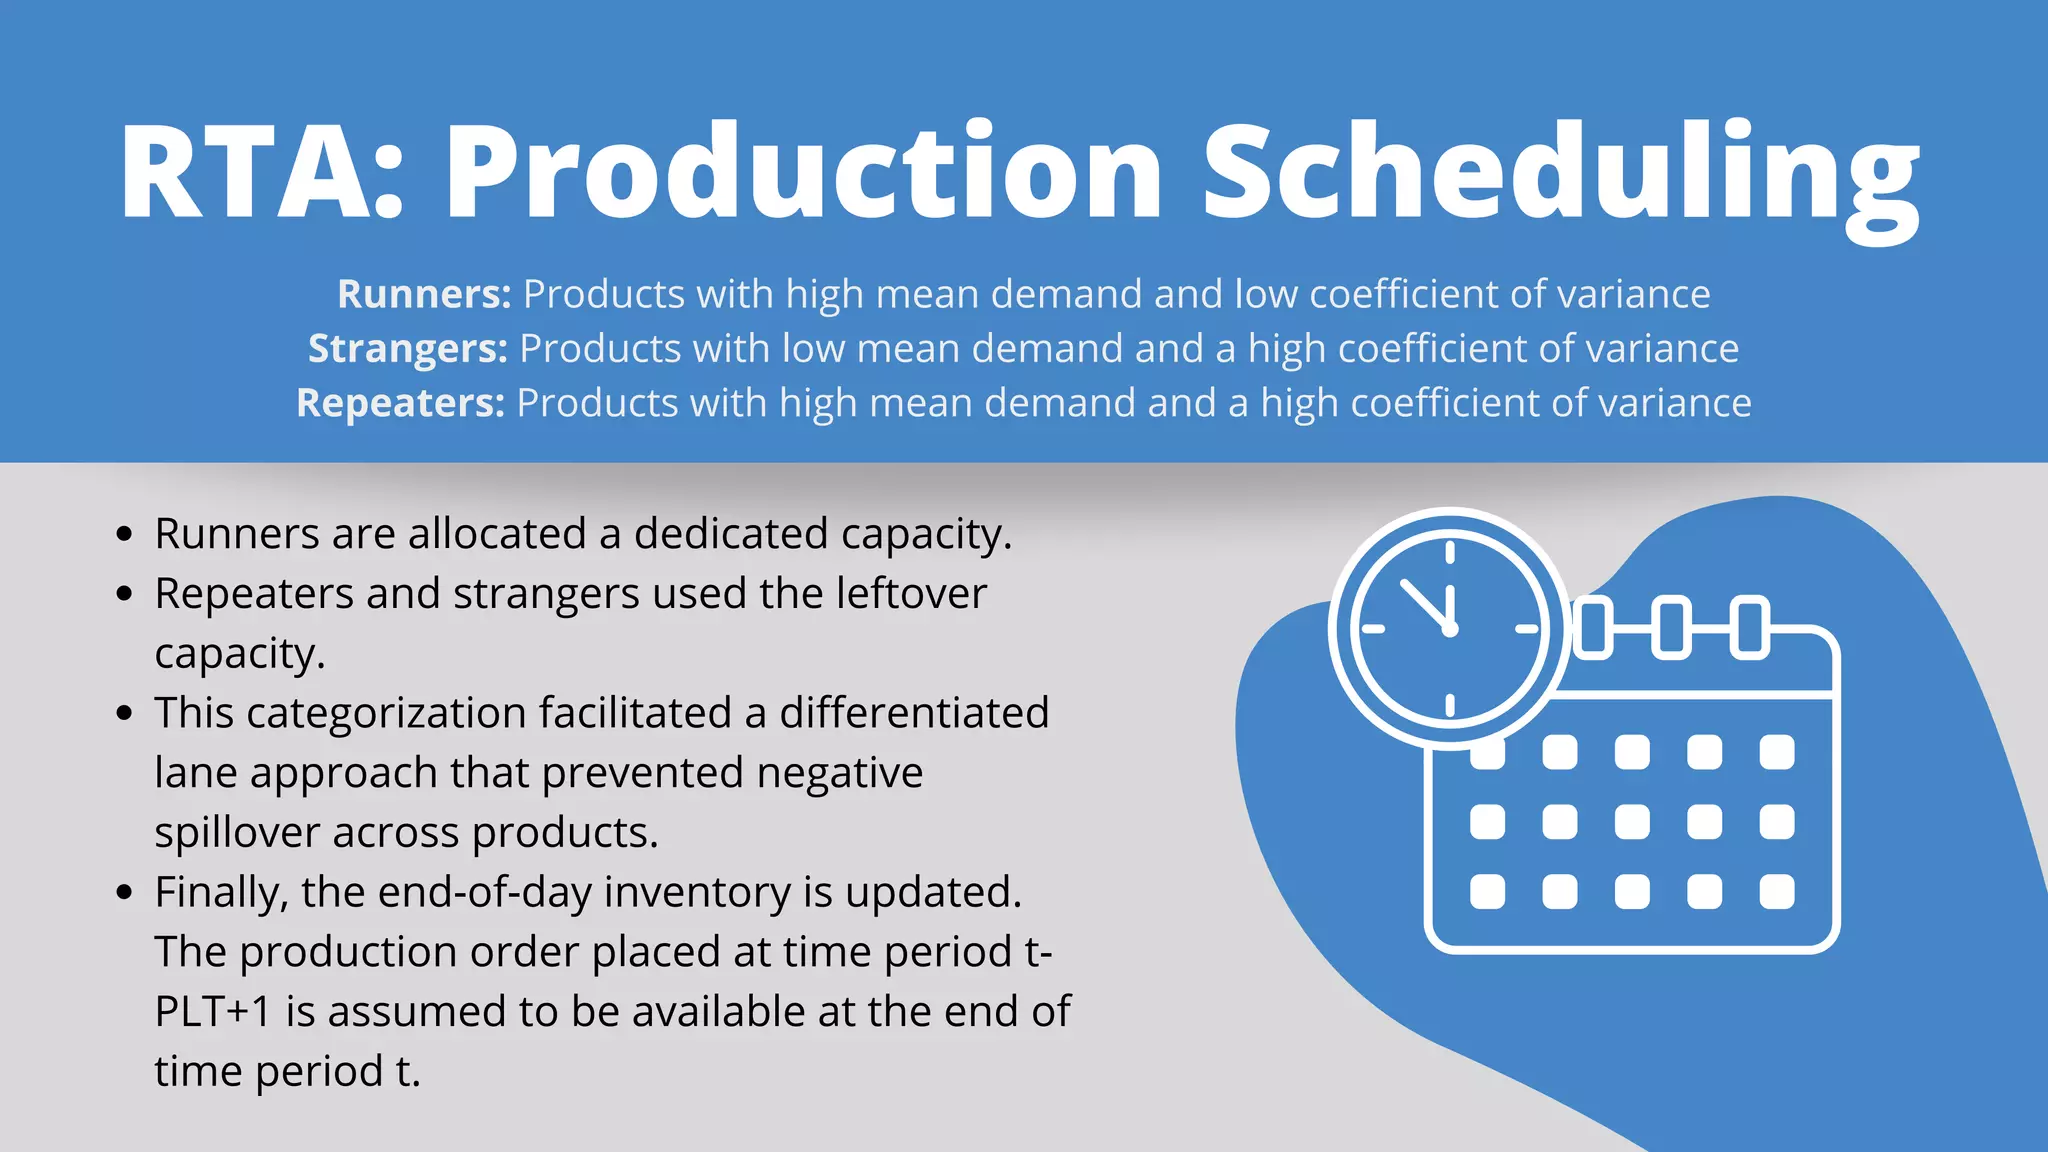
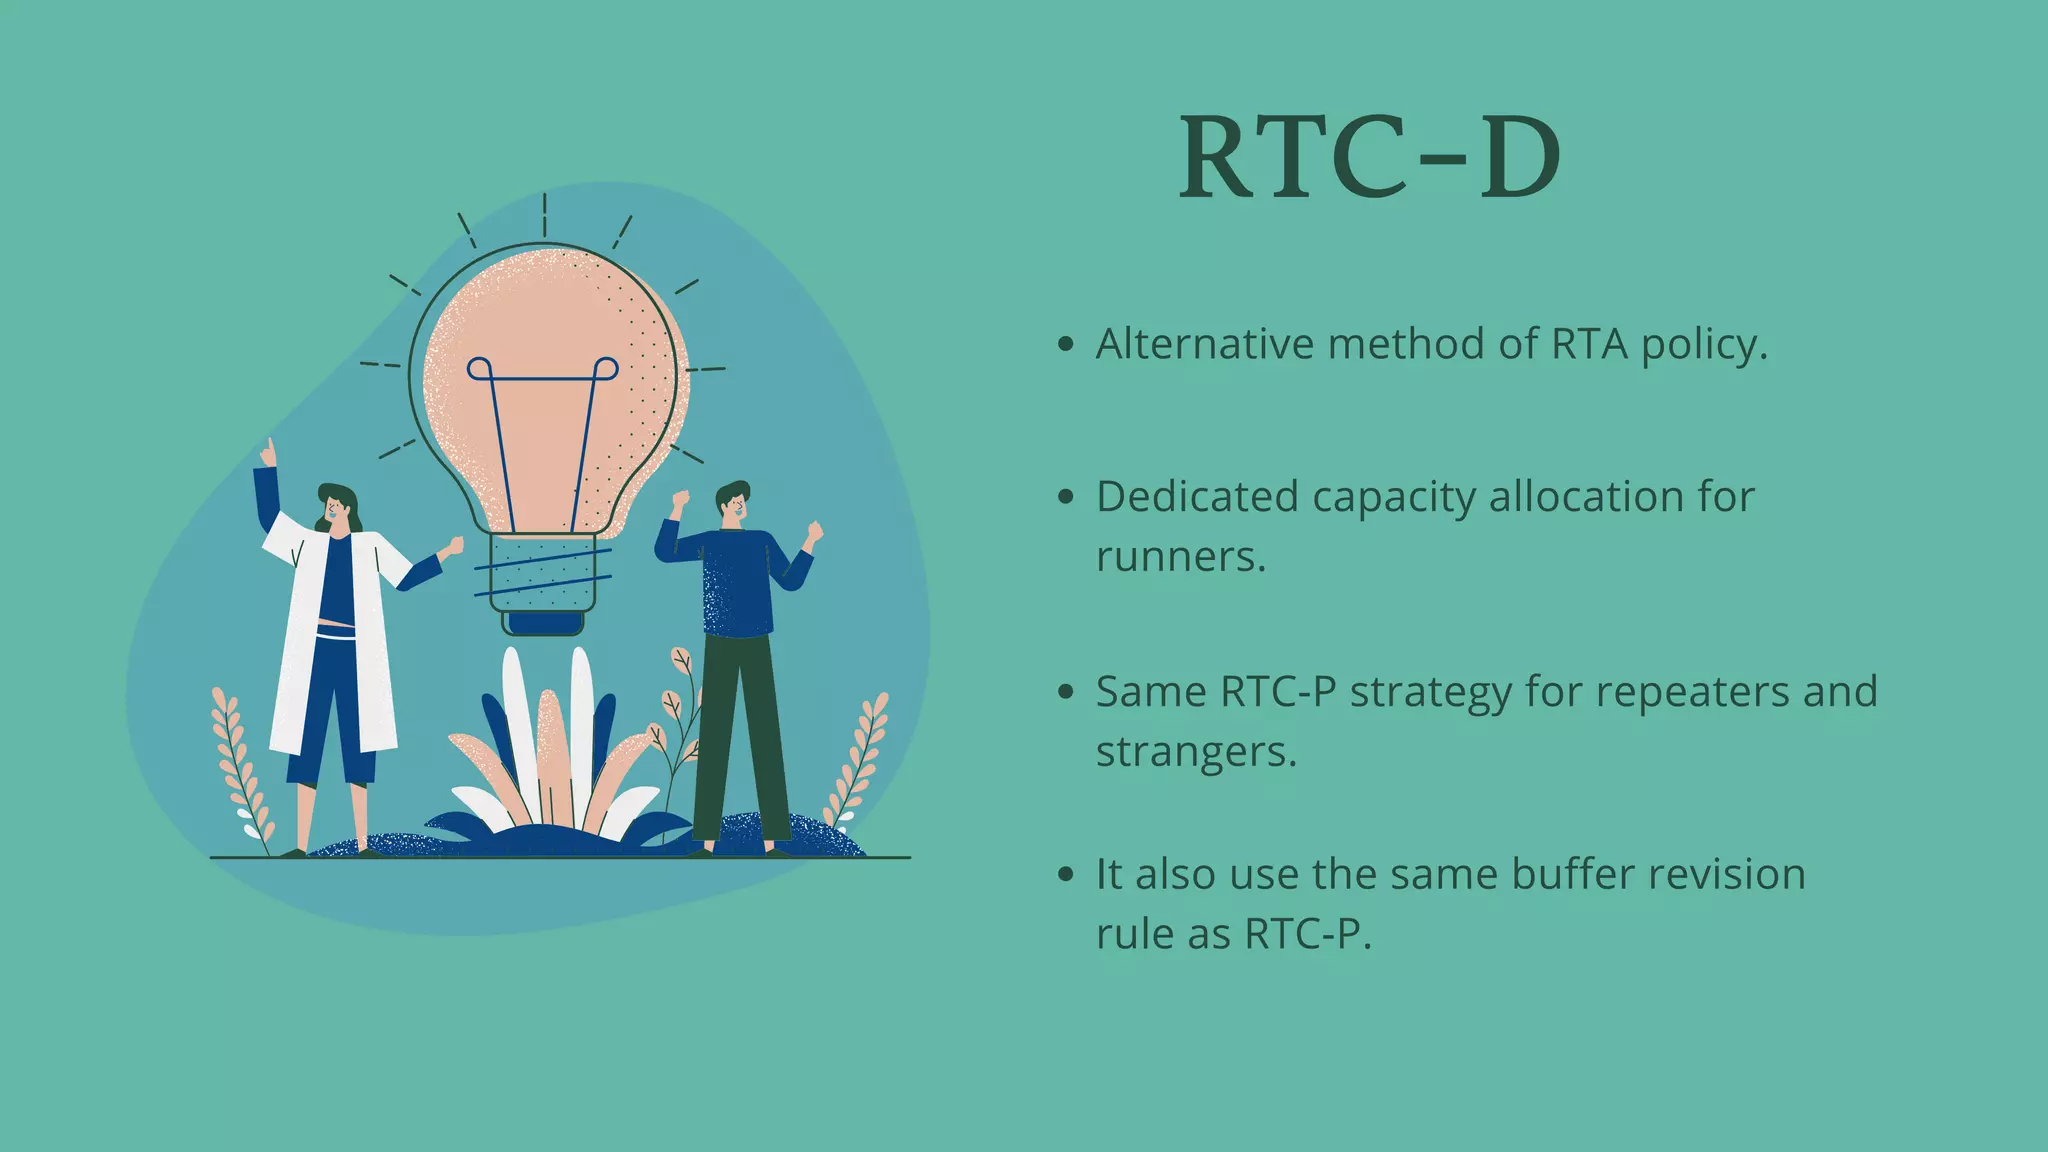
Dr.Reddy's
Laboratories
Asmita Nagpal - PHD21002
Dibakar Gogoi - MBA21056
Deva Krishna - MBA21223
Shuvayan Biswas - MBA21192
Keshav Garg - MBA21087
Jayraj Pol - MBA21138
Introduction(1)
Dr. Reddy’s Laboratories Ltd (DRL), a company based in Hyderabad, is aiming to find a
solution to a persistent production problem.
Their current inventory management policy, known as, Replenish to Consumption – Pooled
(RTC-P) is not providing them the required results.
They are aiming to find either an improved version of this policy or to implement a new policy
altogether.
Introduction(2)
RTC-P pooled the production capacity across products. It enabled them to fulfill demand
and minimize stockouts and resolving the supply chain issue.
The problem they’re facing with this policy:
Frequent switching of products.
Rising operating expenses.
Processes to be handled manually, despite the autopilot feature.
Not able to produce large batch sizes, which was their target.
Introduction(3)
The consultant pointed out the reason of failure of RTC-P being that all the stock keeping
units (SKUs) were competing for same set of resources which are already limited. There
was a need of differentiated approach for different classes of products.
He recommended different production lanes for different classes of products, based on
demand variability.
The vice-president wants to try a variant of RTC-P, called Replenish to Consumption-
Dedicated (RTC-D), before shifting to completely new policy.
DRL had started operations in 1984, producing
active pharmaceutical ingredients (APIs).
By 1986 it began manufacturing generic and
branded formulations.
In early 1990s, the expanded scale and profitability
of the company enabled it to focus on getting
approvals for its formulationsand bulk drug plants
from drug regulators in more developed
economies.
CompanyBackground Its key markets included the United States, Russia,
India, the United Kingdom, and Germany. It also
catered to emerging markets in Ukraine, Kazakhstan,
Australia, and South Africa.
The company had manufacturing units across the globe,
including seven API and 10 formulation units in India,
three formulation units in the US, one API unit in Mexico,
and one formulation unit each in the UK and China.
Dr. Reddy’s
Laboratories
The Global Generics segment included manufacturing and
marketing of prescription and over-the- counter (OTC) finished
products in various geographies.
DRL offered a range of products that covered a wide array of
diseases, from common ailments to major therapeutic areas.
DRL offered more than200 high-quality generic versions of
expensive innovator medicines at low cost. Generic
formulations, including tablets, capsules, injectables, and
topical creams, formed the largest part of its business portfolio,
contributing 81% of its net revenue in 2014-15.
The company had been able to make these medicines
affordable and keep costs down by managing the entire value
chain.
GlobalGenericsBusiness
Replenish to Consumption- Pooled
RTC-P
Based on the inventory management system
Easy to implement Strategies to make better
production decisions
Event Timeline
Buffer Update
Inventory Position (Red,Yellow,Green)
Buffer Penetration Ratio
Production Scheduling
Problem1
The plant switched between products which
increased the switching cost.
Problem2
RTC-P resulted in an increased level of
inventory for certain products, which led to
rising in holdup cost and stockout in the
case of other products
Problem3
All the stock-keeping units in the current
system were competing for the same set of
already constrained resources. This further
led to poor performance in supply chain
performance indicators.
Replenishment to
Anticipation (RTA)
Segregation of the production capacity based on product
types and using demand estimates to update buffer levels.
RTA
Event Timeline
However, the subsequent steps, namely, buffer level update
and production scheduling, differed significantly from RTC-P.
The inventory position for the time period was calculated
using the current inventory level and the in-transit inventory
similar to the RTC-P strategy.
The current period demand was realized and was serviced
from the current or on-hand inventory level.
start of day inventory was initialized to the previous day’s
EOD inventory level.
Uses a Demand forecasting-based
approach.
RTA
Buffer Update
An initial forecasted demand value is calculated
exogenously based on managerial input.
A statistical forecast being generated from actual sales data
of the past three years, with high weightage given to recent
months.
After every forecast revision period (FRP), it is updated based
on the forecasting error in the previous FRP-1 periods.
RTA: Production Scheduling
Runners: Products with high mean demand and low coefficient of variance
Strangers: Products with low mean demand and a high coefficient of variance
Repeaters: Products with high mean demand and a high coefficient of variance
Runners are allocated a dedicated capacity.
Repeaters and strangers used the leftover
capacity.
This categorization facilitated a differentiated
lane approach that prevented negative
spillover across products.
Finally, the end-of-day inventory is updated.
The production order placed at time period t-
PLT+1 is assumed to be available at the end of
time period t.
Replenishto
Consumption-
Dedicated(RTC-D)
Alternative method of RTA policy.
Dedicated capacity allocation for
runners.
Same RTC-P strategy for repeaters and
strangers.
It also use the same buffer revision
rule as RTC-P.
RTC-D
Conclusion
Since the capacity allocated to a product was sensitive to the buffer and inventory position
levels, which changed continuously, the production priority between the outcomes changed,
increasing the switching costs.
Excess inventory levels for certain products rose, leading to an increase in holding costs and
stockouts for others.
While the RTC-P strategy was meant to work well in theory, There were two issues found:
RTA approach might address the two above issues by segregating the production capacity
based on product types and using demand estimates to update buffer levels.
In the RTA approach, runners were allocated a dedicated capacity. The rest followed the RTC-P method
for the revised buffer level, as this approach helps fulfill the demand and reduce holding costs.
Solution:
ThankYou!

Dr. Reddy's Laboratory

  • 1.
    Dr.Reddy's Laboratories Asmita Nagpal -PHD21002 Dibakar Gogoi - MBA21056 Deva Krishna - MBA21223 Shuvayan Biswas - MBA21192 Keshav Garg - MBA21087 Jayraj Pol - MBA21138
  • 2.
    Introduction(1) Dr. Reddy’s LaboratoriesLtd (DRL), a company based in Hyderabad, is aiming to find a solution to a persistent production problem. Their current inventory management policy, known as, Replenish to Consumption – Pooled (RTC-P) is not providing them the required results. They are aiming to find either an improved version of this policy or to implement a new policy altogether.
  • 3.
    Introduction(2) RTC-P pooled theproduction capacity across products. It enabled them to fulfill demand and minimize stockouts and resolving the supply chain issue. The problem they’re facing with this policy: Frequent switching of products. Rising operating expenses. Processes to be handled manually, despite the autopilot feature. Not able to produce large batch sizes, which was their target.
  • 4.
    Introduction(3) The consultant pointedout the reason of failure of RTC-P being that all the stock keeping units (SKUs) were competing for same set of resources which are already limited. There was a need of differentiated approach for different classes of products. He recommended different production lanes for different classes of products, based on demand variability. The vice-president wants to try a variant of RTC-P, called Replenish to Consumption- Dedicated (RTC-D), before shifting to completely new policy.
  • 5.
    DRL had startedoperations in 1984, producing active pharmaceutical ingredients (APIs). By 1986 it began manufacturing generic and branded formulations. In early 1990s, the expanded scale and profitability of the company enabled it to focus on getting approvals for its formulationsand bulk drug plants from drug regulators in more developed economies. CompanyBackground Its key markets included the United States, Russia, India, the United Kingdom, and Germany. It also catered to emerging markets in Ukraine, Kazakhstan, Australia, and South Africa. The company had manufacturing units across the globe, including seven API and 10 formulation units in India, three formulation units in the US, one API unit in Mexico, and one formulation unit each in the UK and China. Dr. Reddy’s Laboratories
  • 6.
    The Global Genericssegment included manufacturing and marketing of prescription and over-the- counter (OTC) finished products in various geographies. DRL offered a range of products that covered a wide array of diseases, from common ailments to major therapeutic areas. DRL offered more than200 high-quality generic versions of expensive innovator medicines at low cost. Generic formulations, including tablets, capsules, injectables, and topical creams, formed the largest part of its business portfolio, contributing 81% of its net revenue in 2014-15. The company had been able to make these medicines affordable and keep costs down by managing the entire value chain. GlobalGenericsBusiness
  • 7.
    Replenish to Consumption-Pooled RTC-P Based on the inventory management system Easy to implement Strategies to make better production decisions
  • 8.
    Event Timeline Buffer Update InventoryPosition (Red,Yellow,Green) Buffer Penetration Ratio Production Scheduling
  • 9.
    Problem1 The plant switchedbetween products which increased the switching cost. Problem2 RTC-P resulted in an increased level of inventory for certain products, which led to rising in holdup cost and stockout in the case of other products Problem3 All the stock-keeping units in the current system were competing for the same set of already constrained resources. This further led to poor performance in supply chain performance indicators.
  • 10.
    Replenishment to Anticipation (RTA) Segregationof the production capacity based on product types and using demand estimates to update buffer levels.
  • 11.
    RTA Event Timeline However, thesubsequent steps, namely, buffer level update and production scheduling, differed significantly from RTC-P. The inventory position for the time period was calculated using the current inventory level and the in-transit inventory similar to the RTC-P strategy. The current period demand was realized and was serviced from the current or on-hand inventory level. start of day inventory was initialized to the previous day’s EOD inventory level.
  • 12.
    Uses a Demandforecasting-based approach. RTA Buffer Update An initial forecasted demand value is calculated exogenously based on managerial input. A statistical forecast being generated from actual sales data of the past three years, with high weightage given to recent months. After every forecast revision period (FRP), it is updated based on the forecasting error in the previous FRP-1 periods.
  • 13.
    RTA: Production Scheduling Runners:Products with high mean demand and low coefficient of variance Strangers: Products with low mean demand and a high coefficient of variance Repeaters: Products with high mean demand and a high coefficient of variance Runners are allocated a dedicated capacity. Repeaters and strangers used the leftover capacity. This categorization facilitated a differentiated lane approach that prevented negative spillover across products. Finally, the end-of-day inventory is updated. The production order placed at time period t- PLT+1 is assumed to be available at the end of time period t.
  • 14.
  • 15.
    Alternative method ofRTA policy. Dedicated capacity allocation for runners. Same RTC-P strategy for repeaters and strangers. It also use the same buffer revision rule as RTC-P. RTC-D
  • 16.
    Conclusion Since the capacityallocated to a product was sensitive to the buffer and inventory position levels, which changed continuously, the production priority between the outcomes changed, increasing the switching costs. Excess inventory levels for certain products rose, leading to an increase in holding costs and stockouts for others. While the RTC-P strategy was meant to work well in theory, There were two issues found: RTA approach might address the two above issues by segregating the production capacity based on product types and using demand estimates to update buffer levels. In the RTA approach, runners were allocated a dedicated capacity. The rest followed the RTC-P method for the revised buffer level, as this approach helps fulfill the demand and reduce holding costs. Solution:
  • 17.