Download to read offline


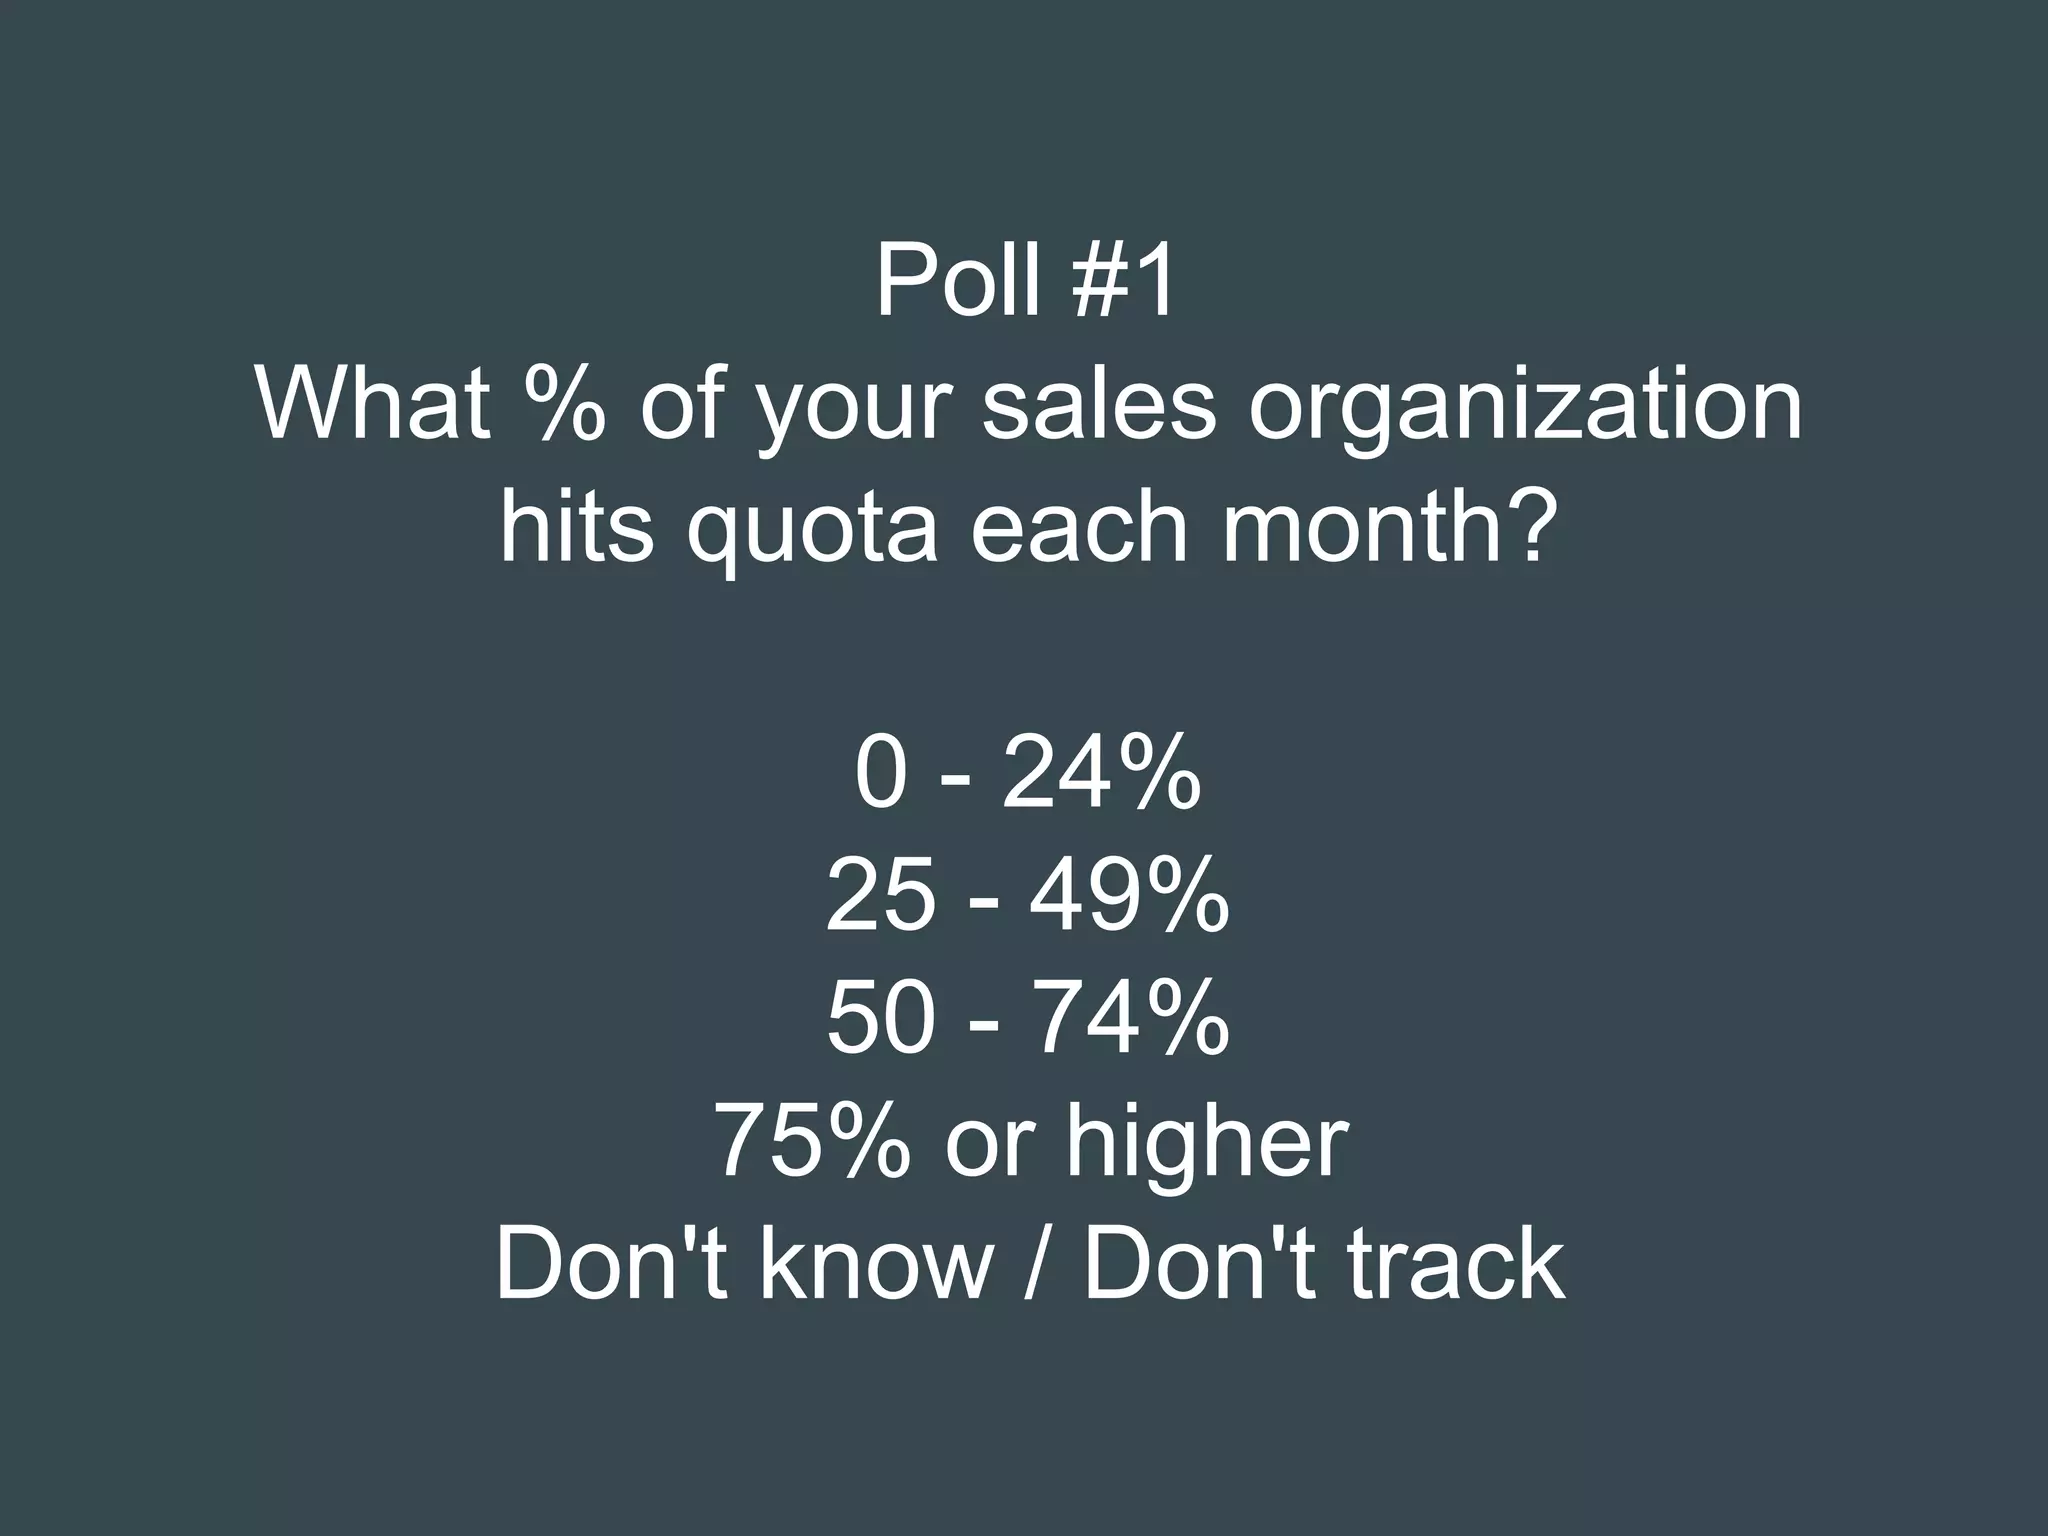


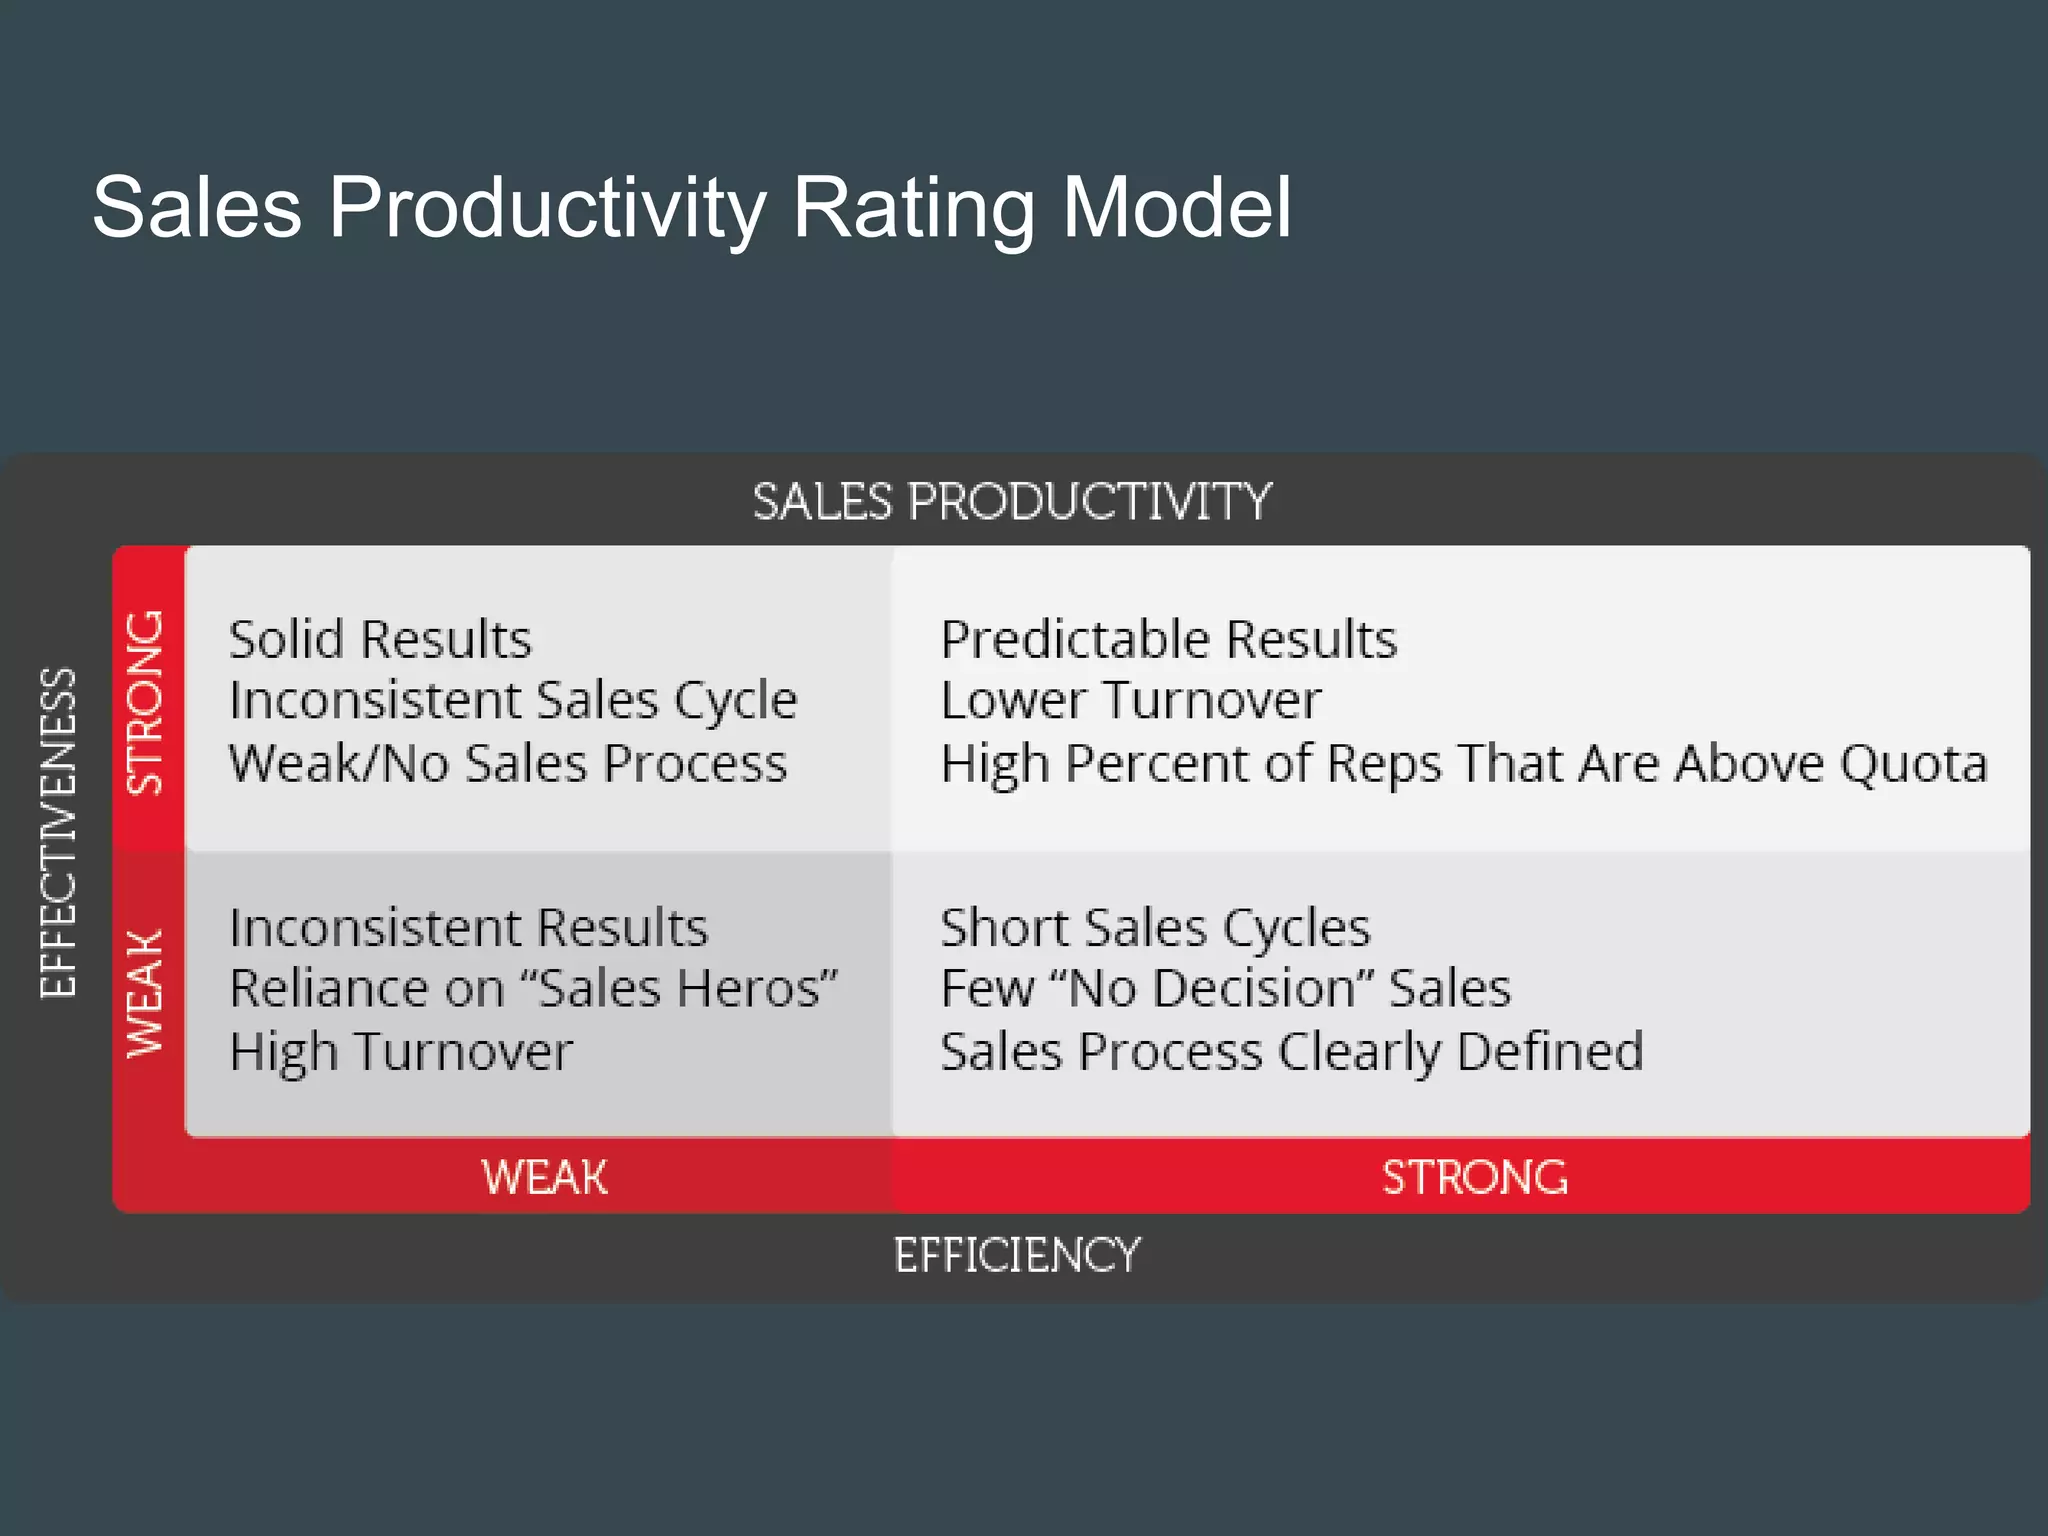


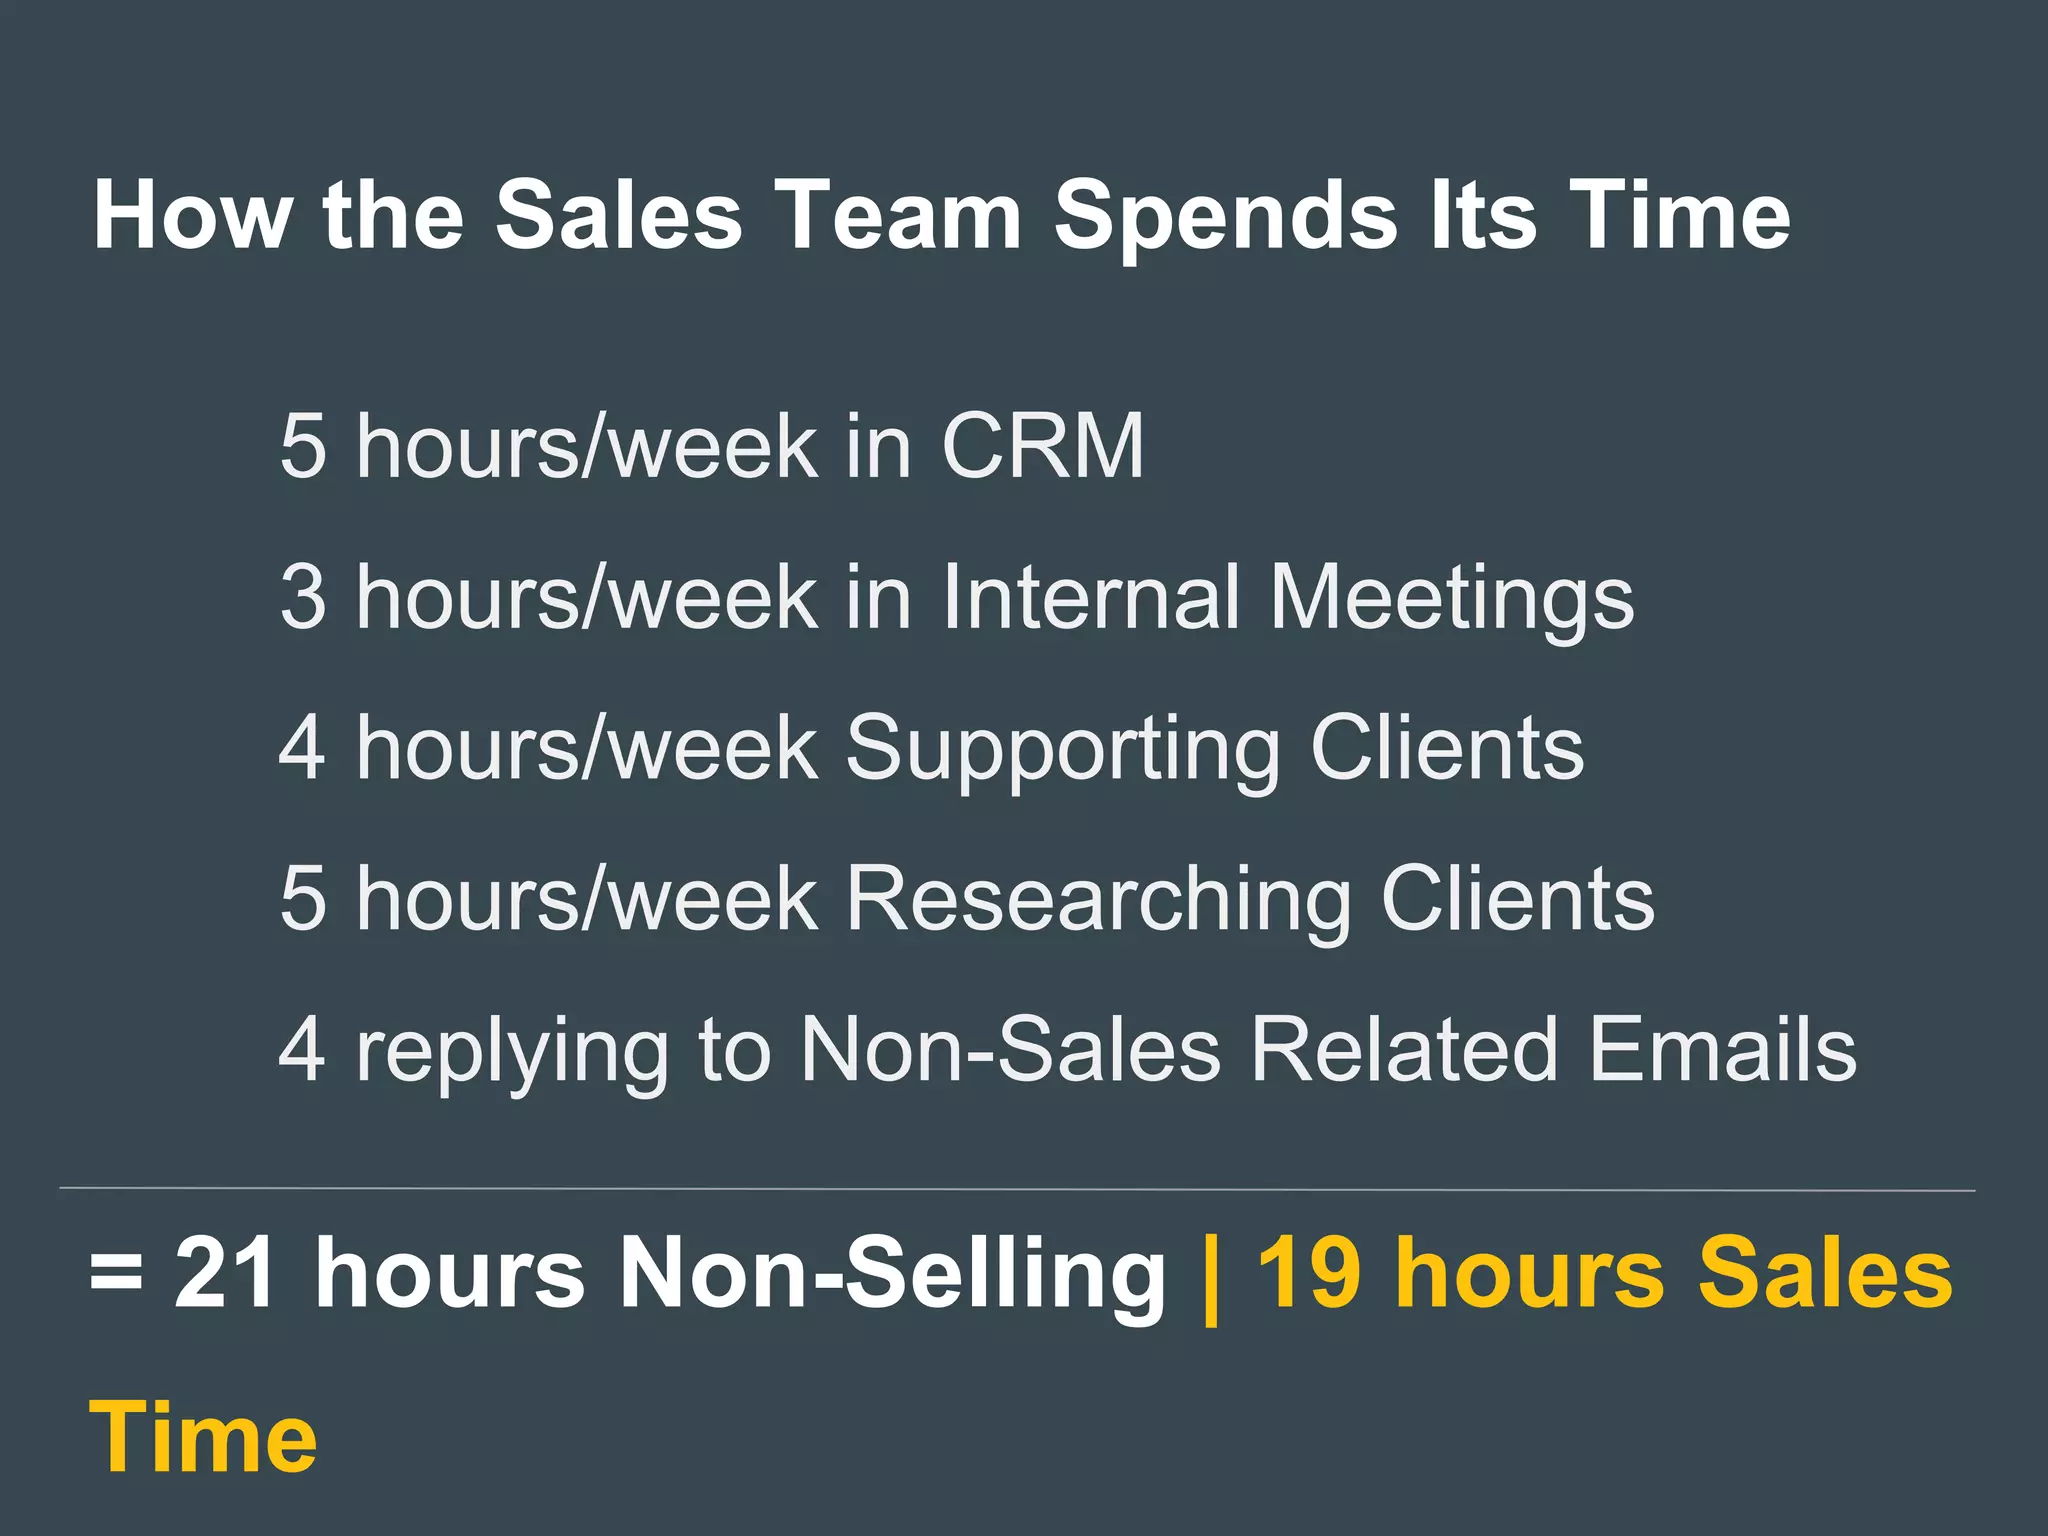
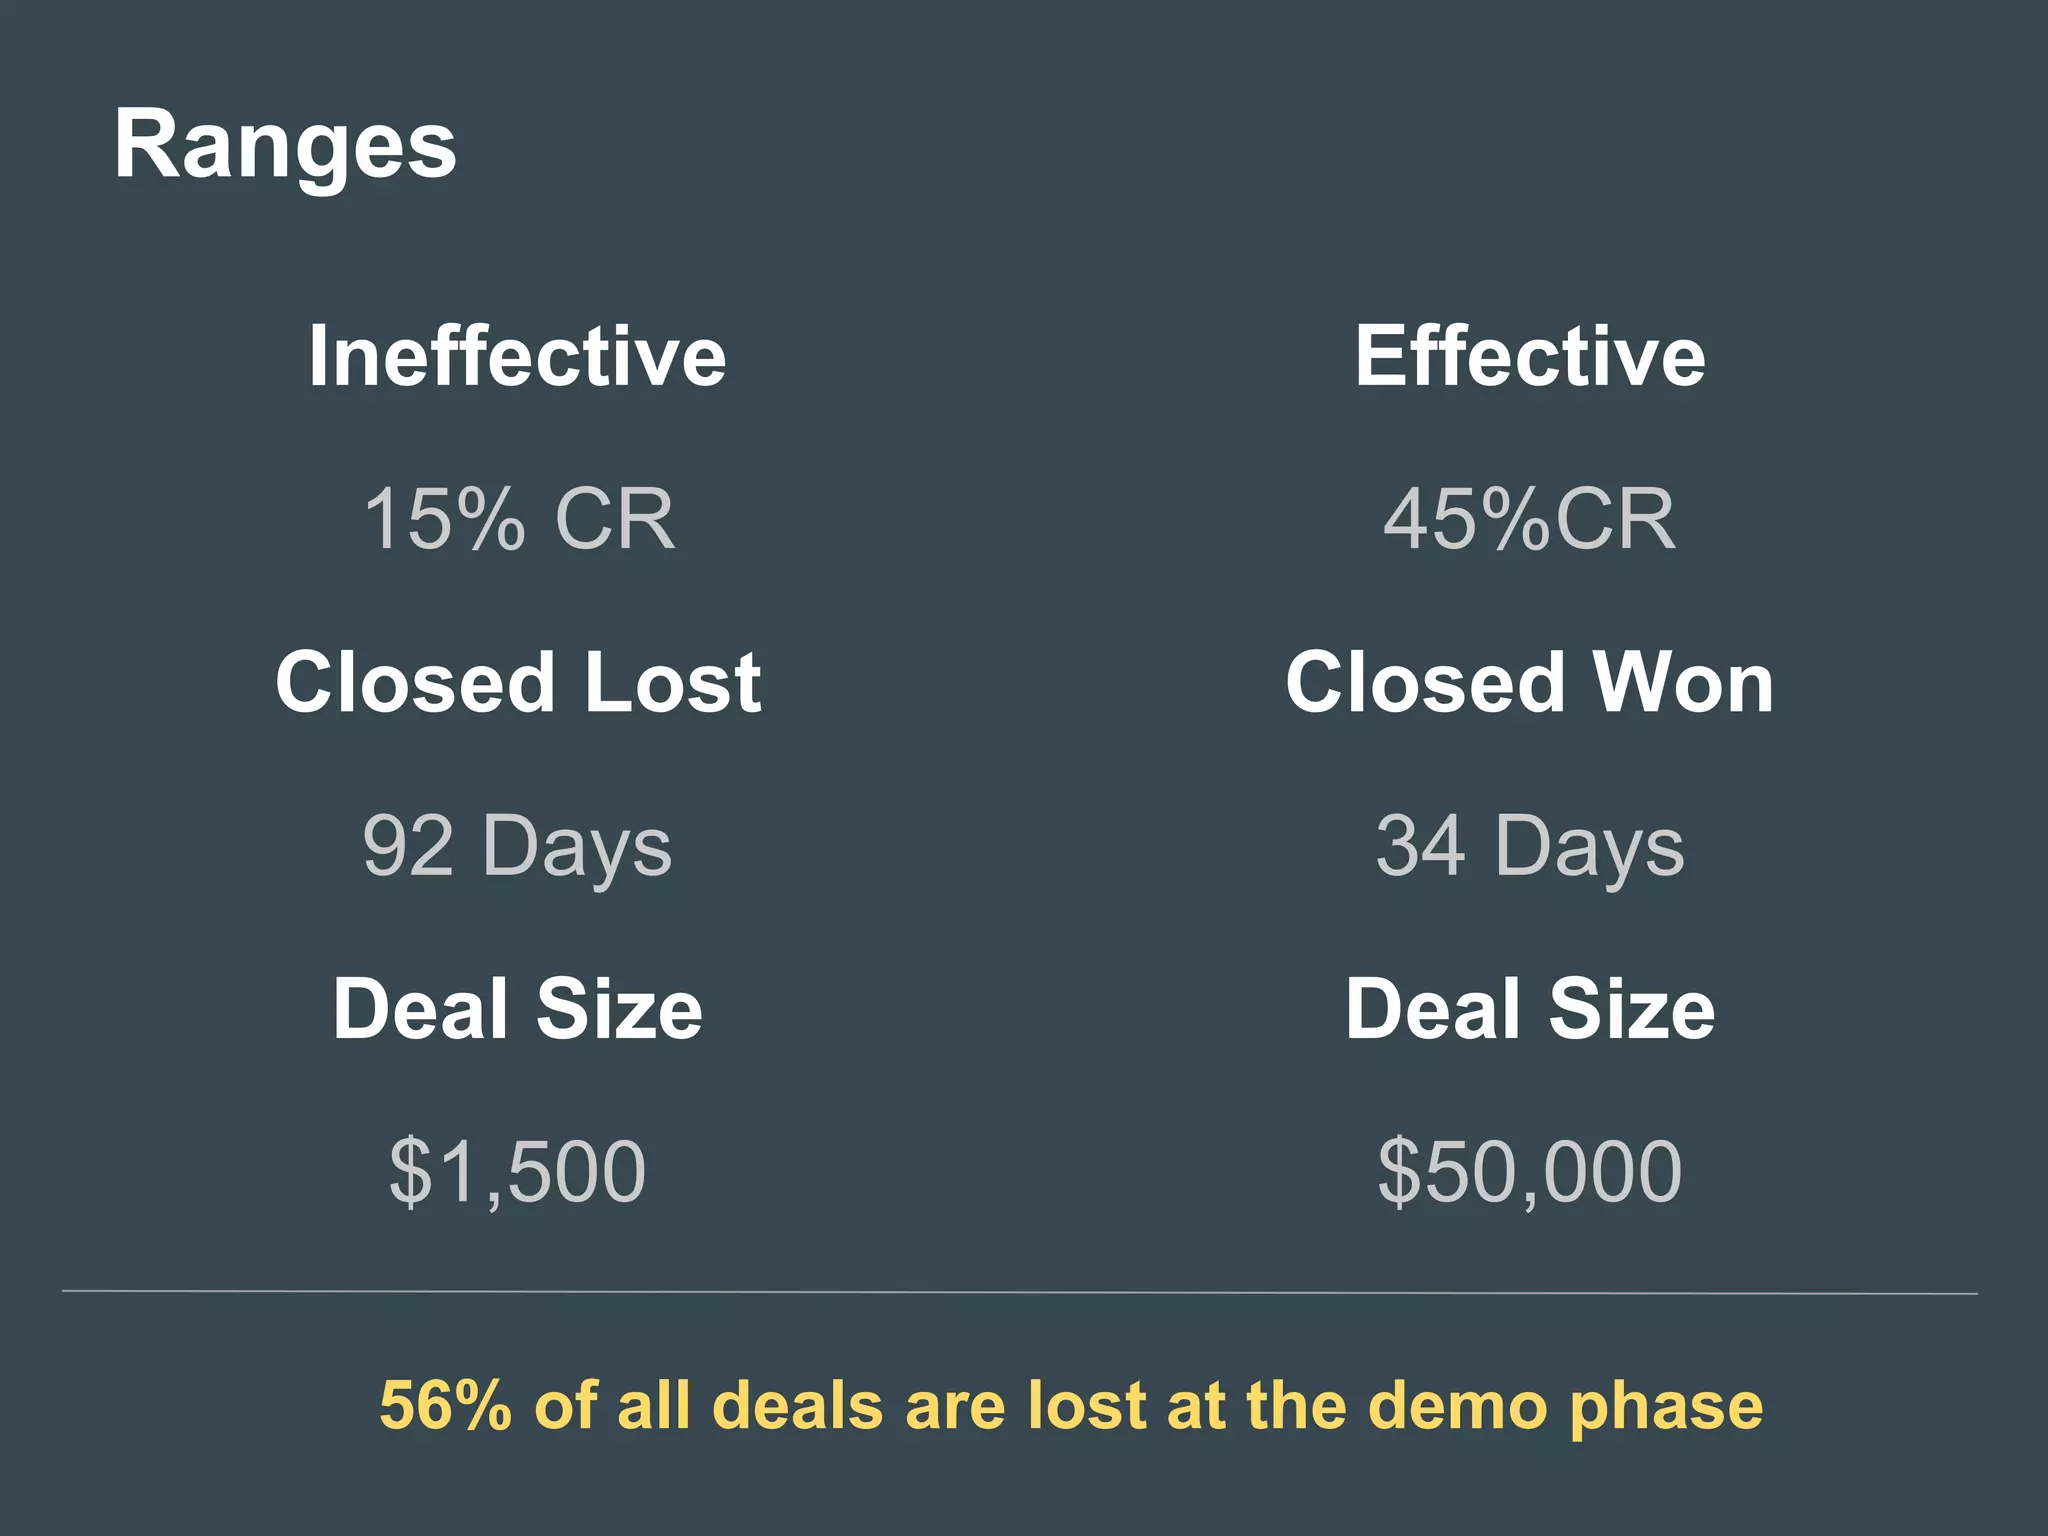
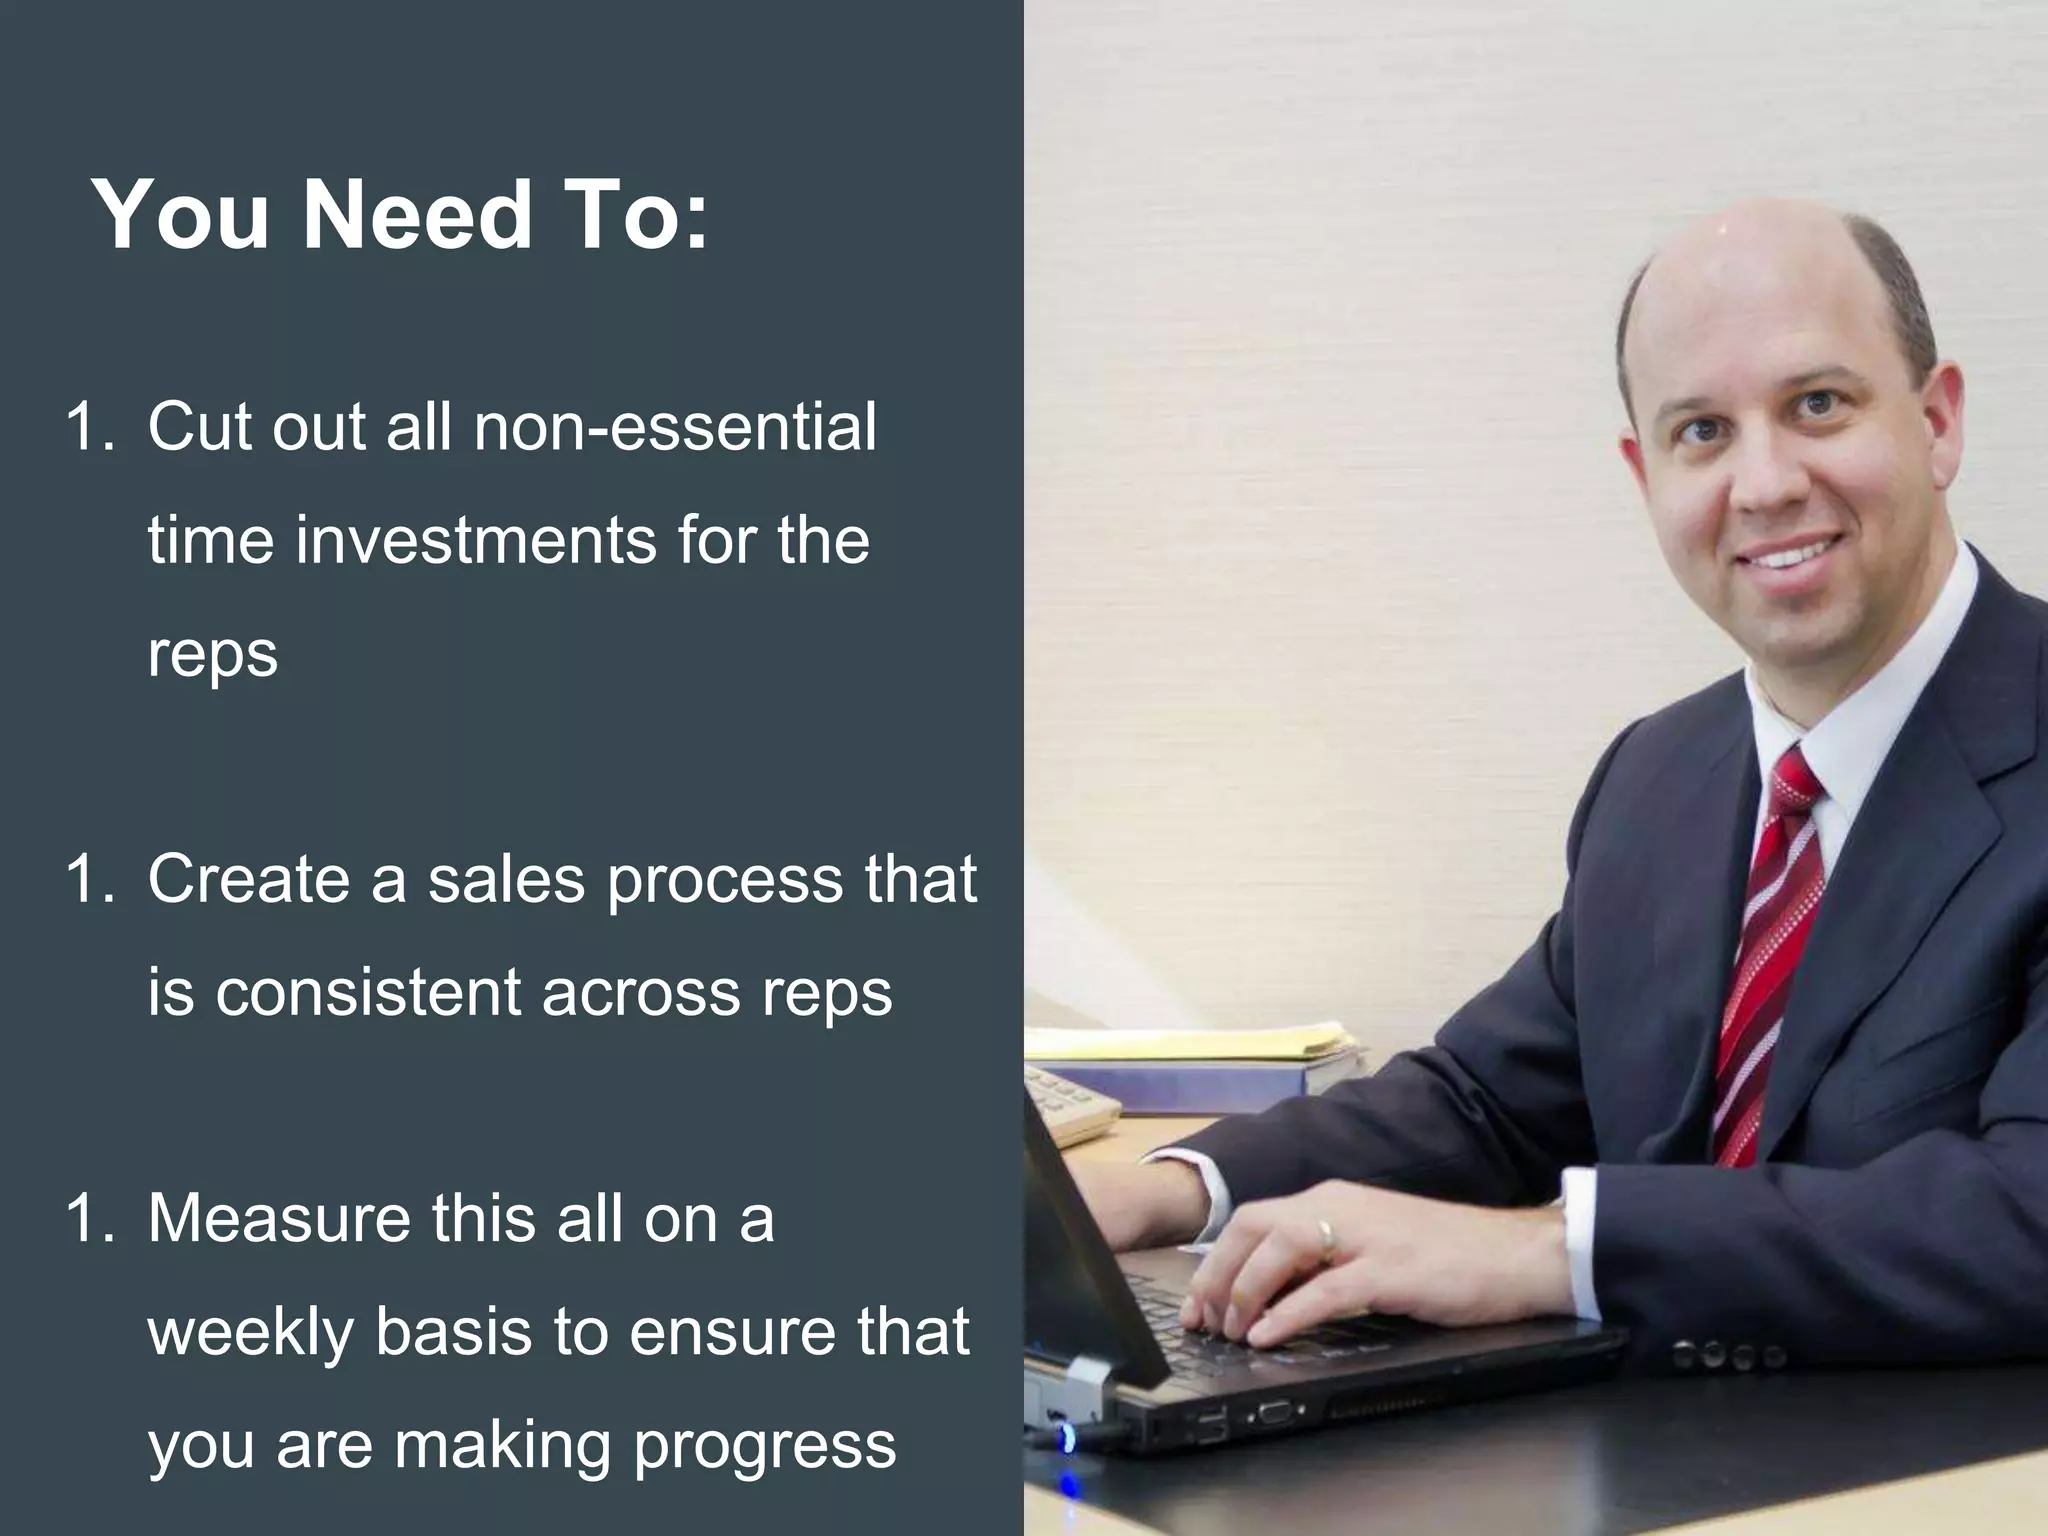


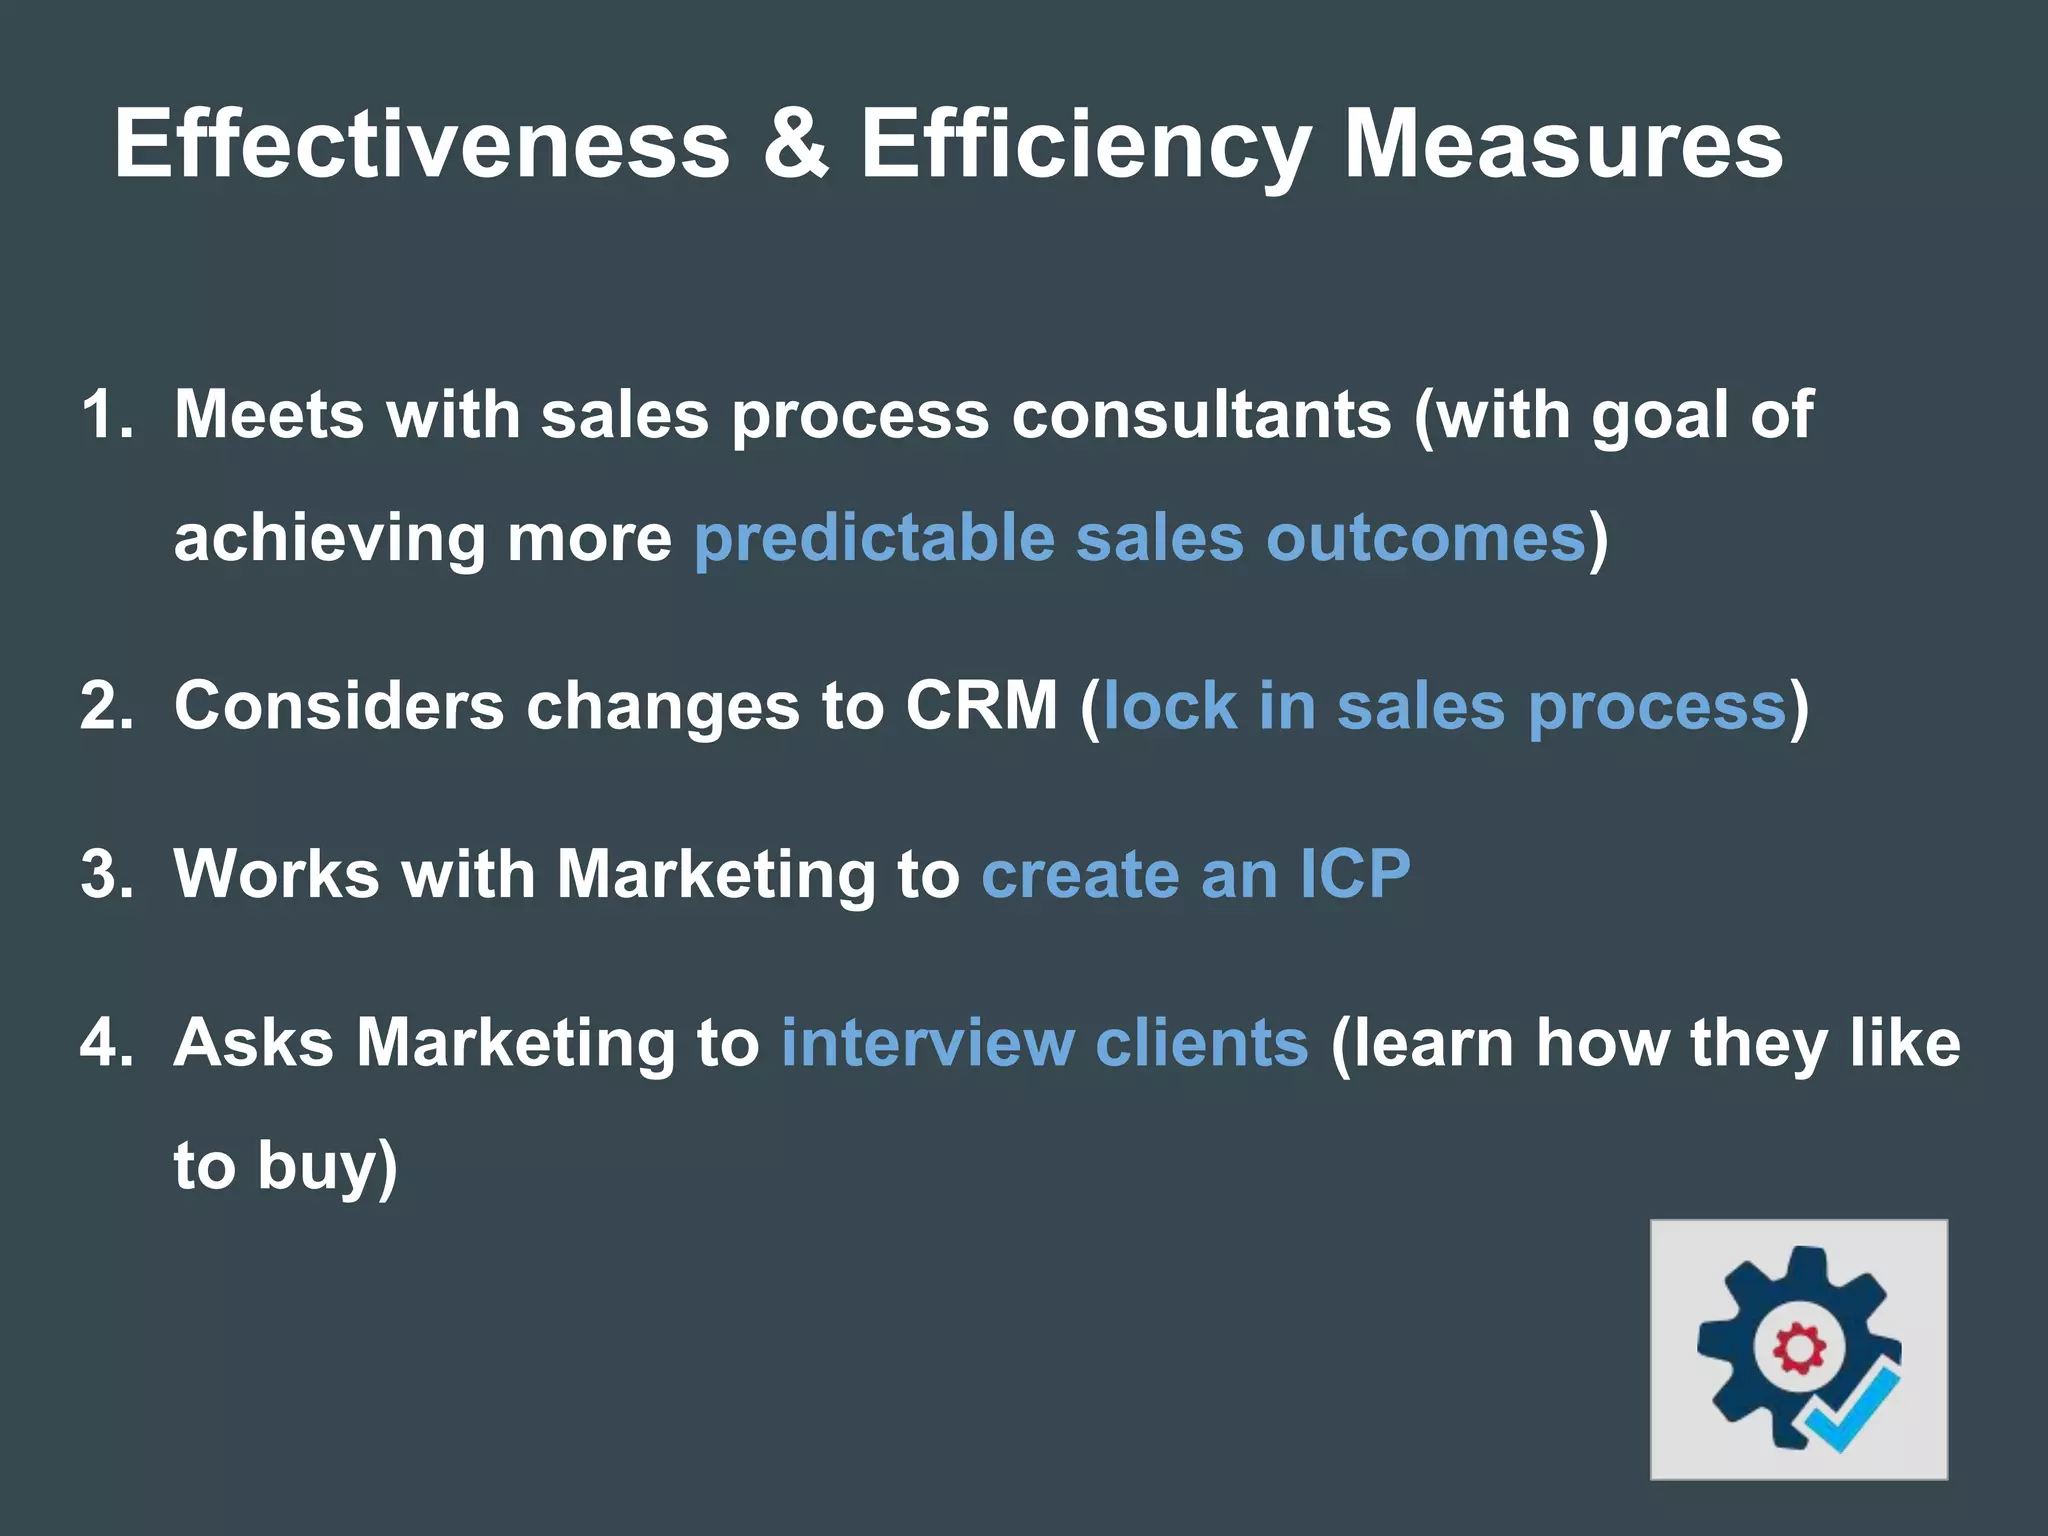


The document discusses sales productivity challenges, outlining survey results related to sales quotas and the time sales reps spend selling versus non-selling activities. It suggests strategies to improve effectiveness and efficiency, such as reducing non-essential tasks, utilizing CRM automation tools, and creating a consistent sales process. Potential time savings could lead to significant improvements in deal closure rates and average deal size.


