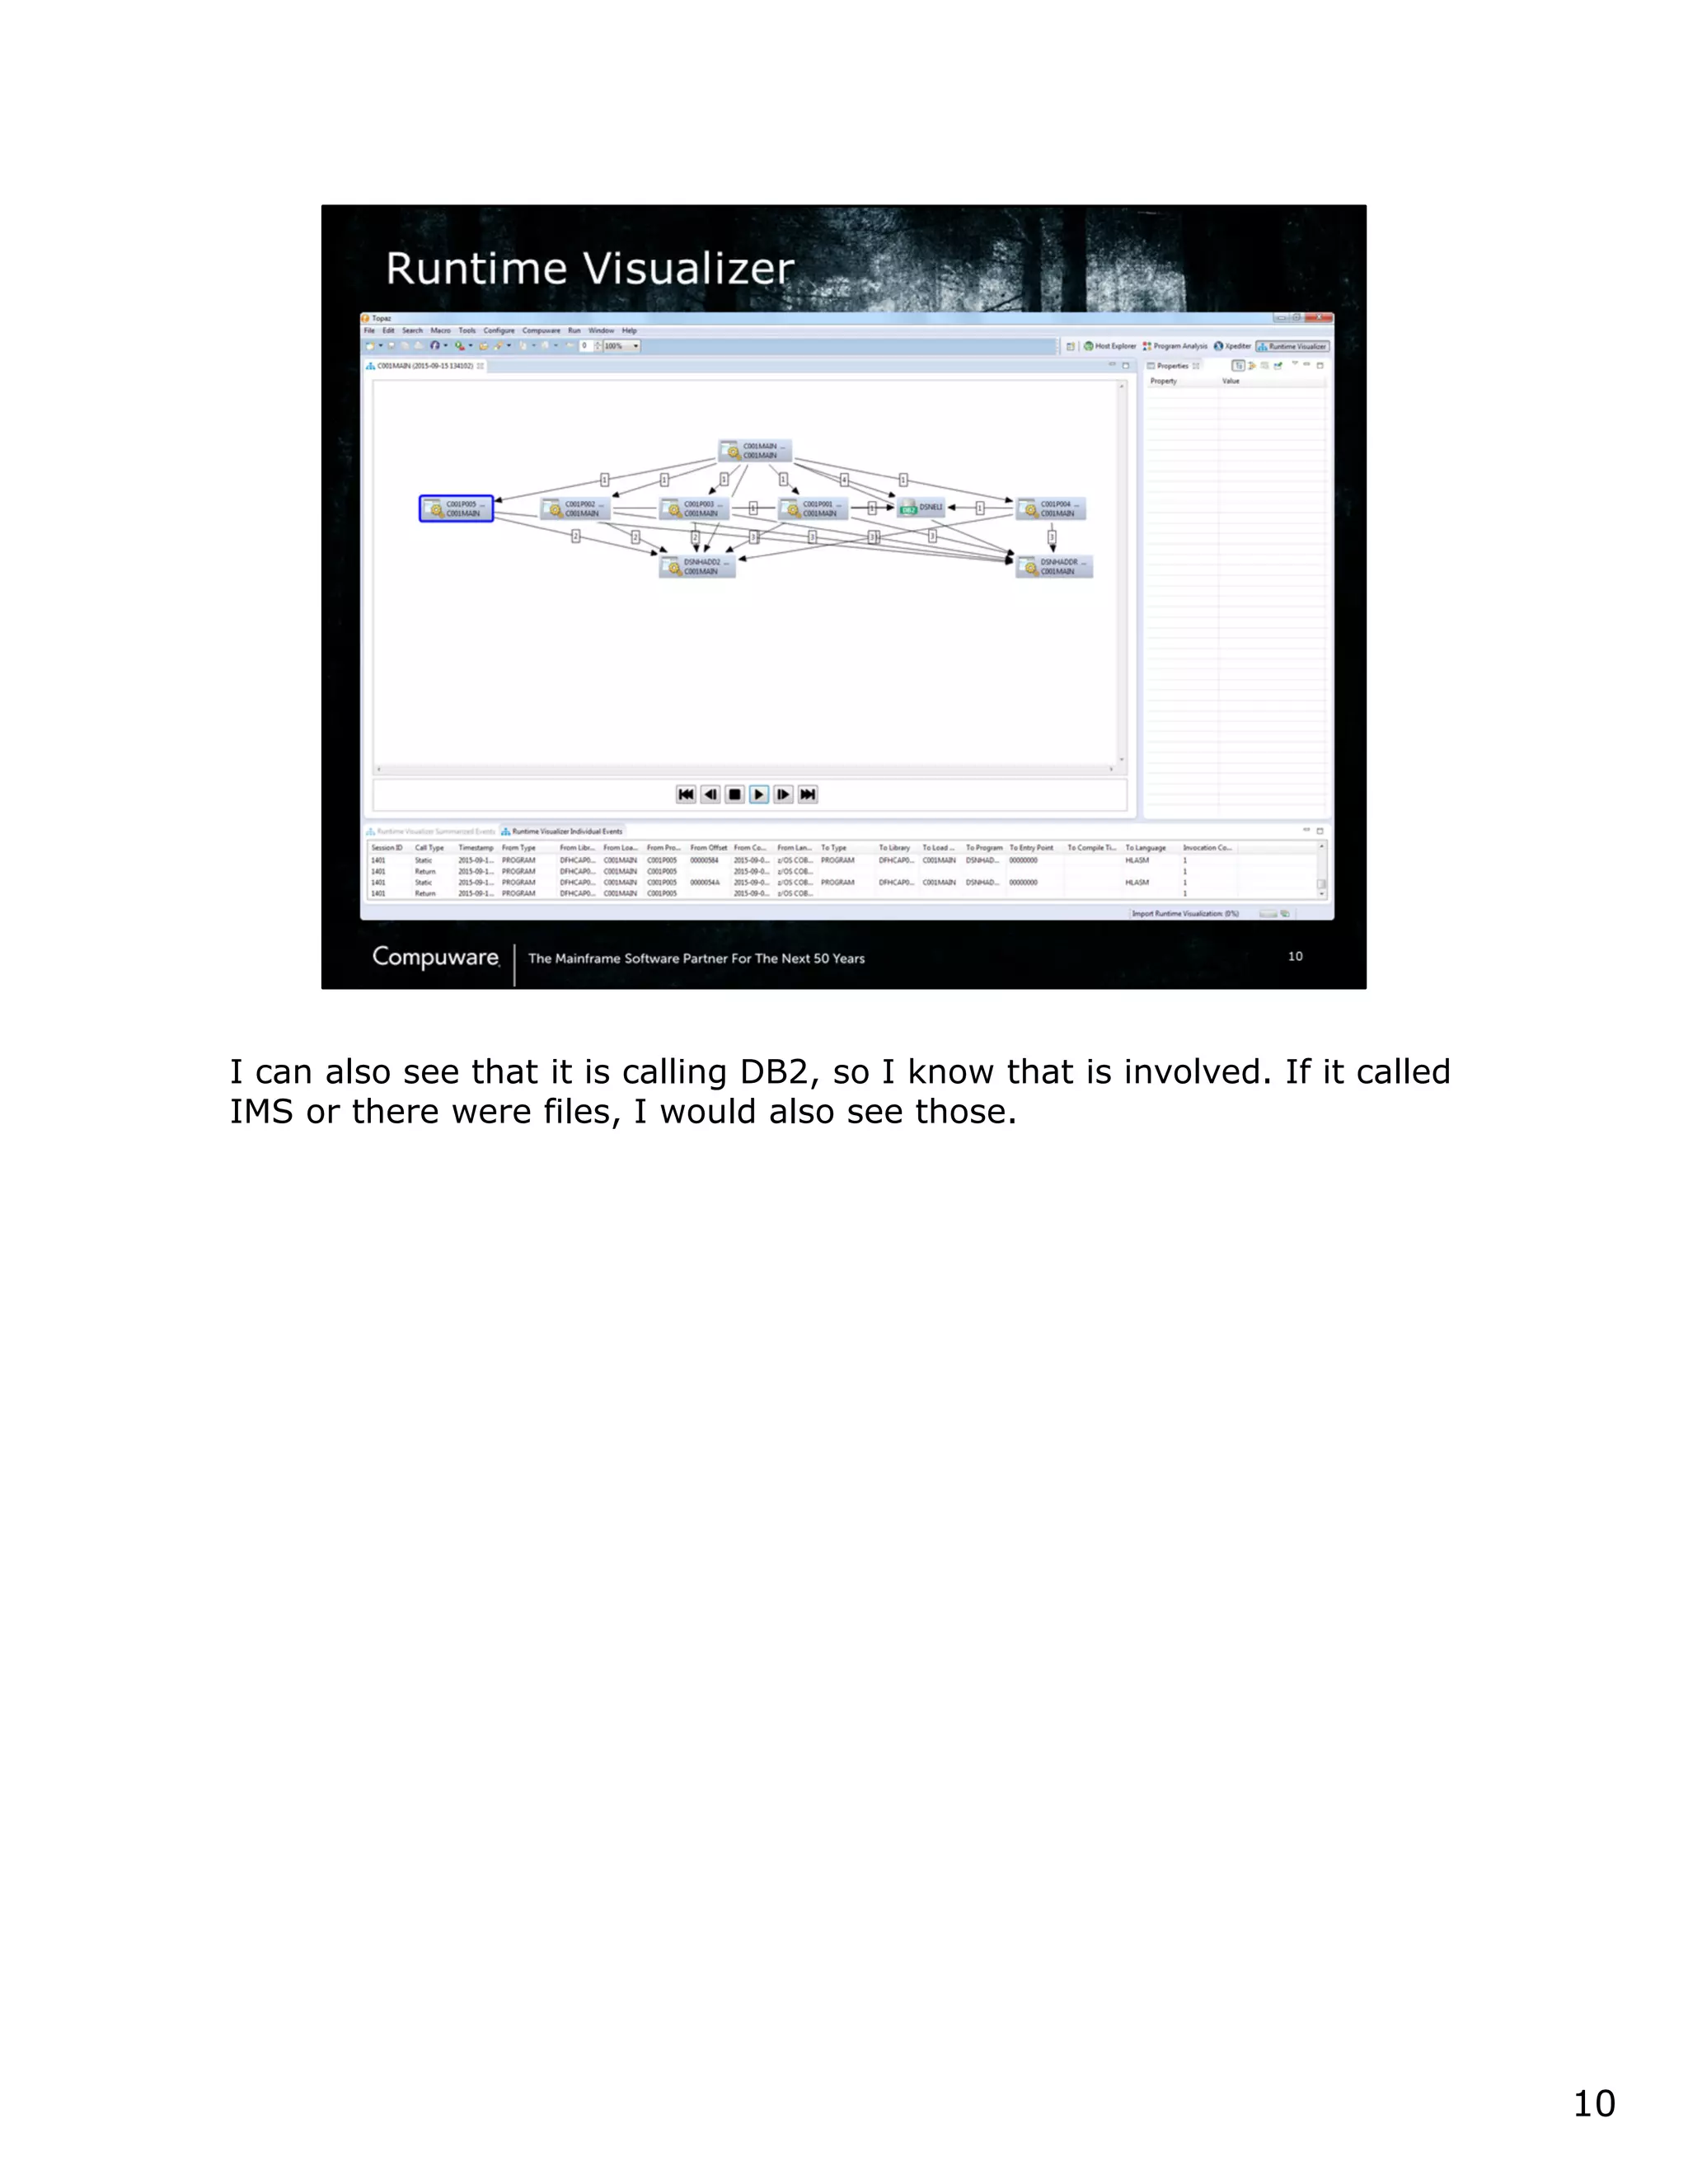
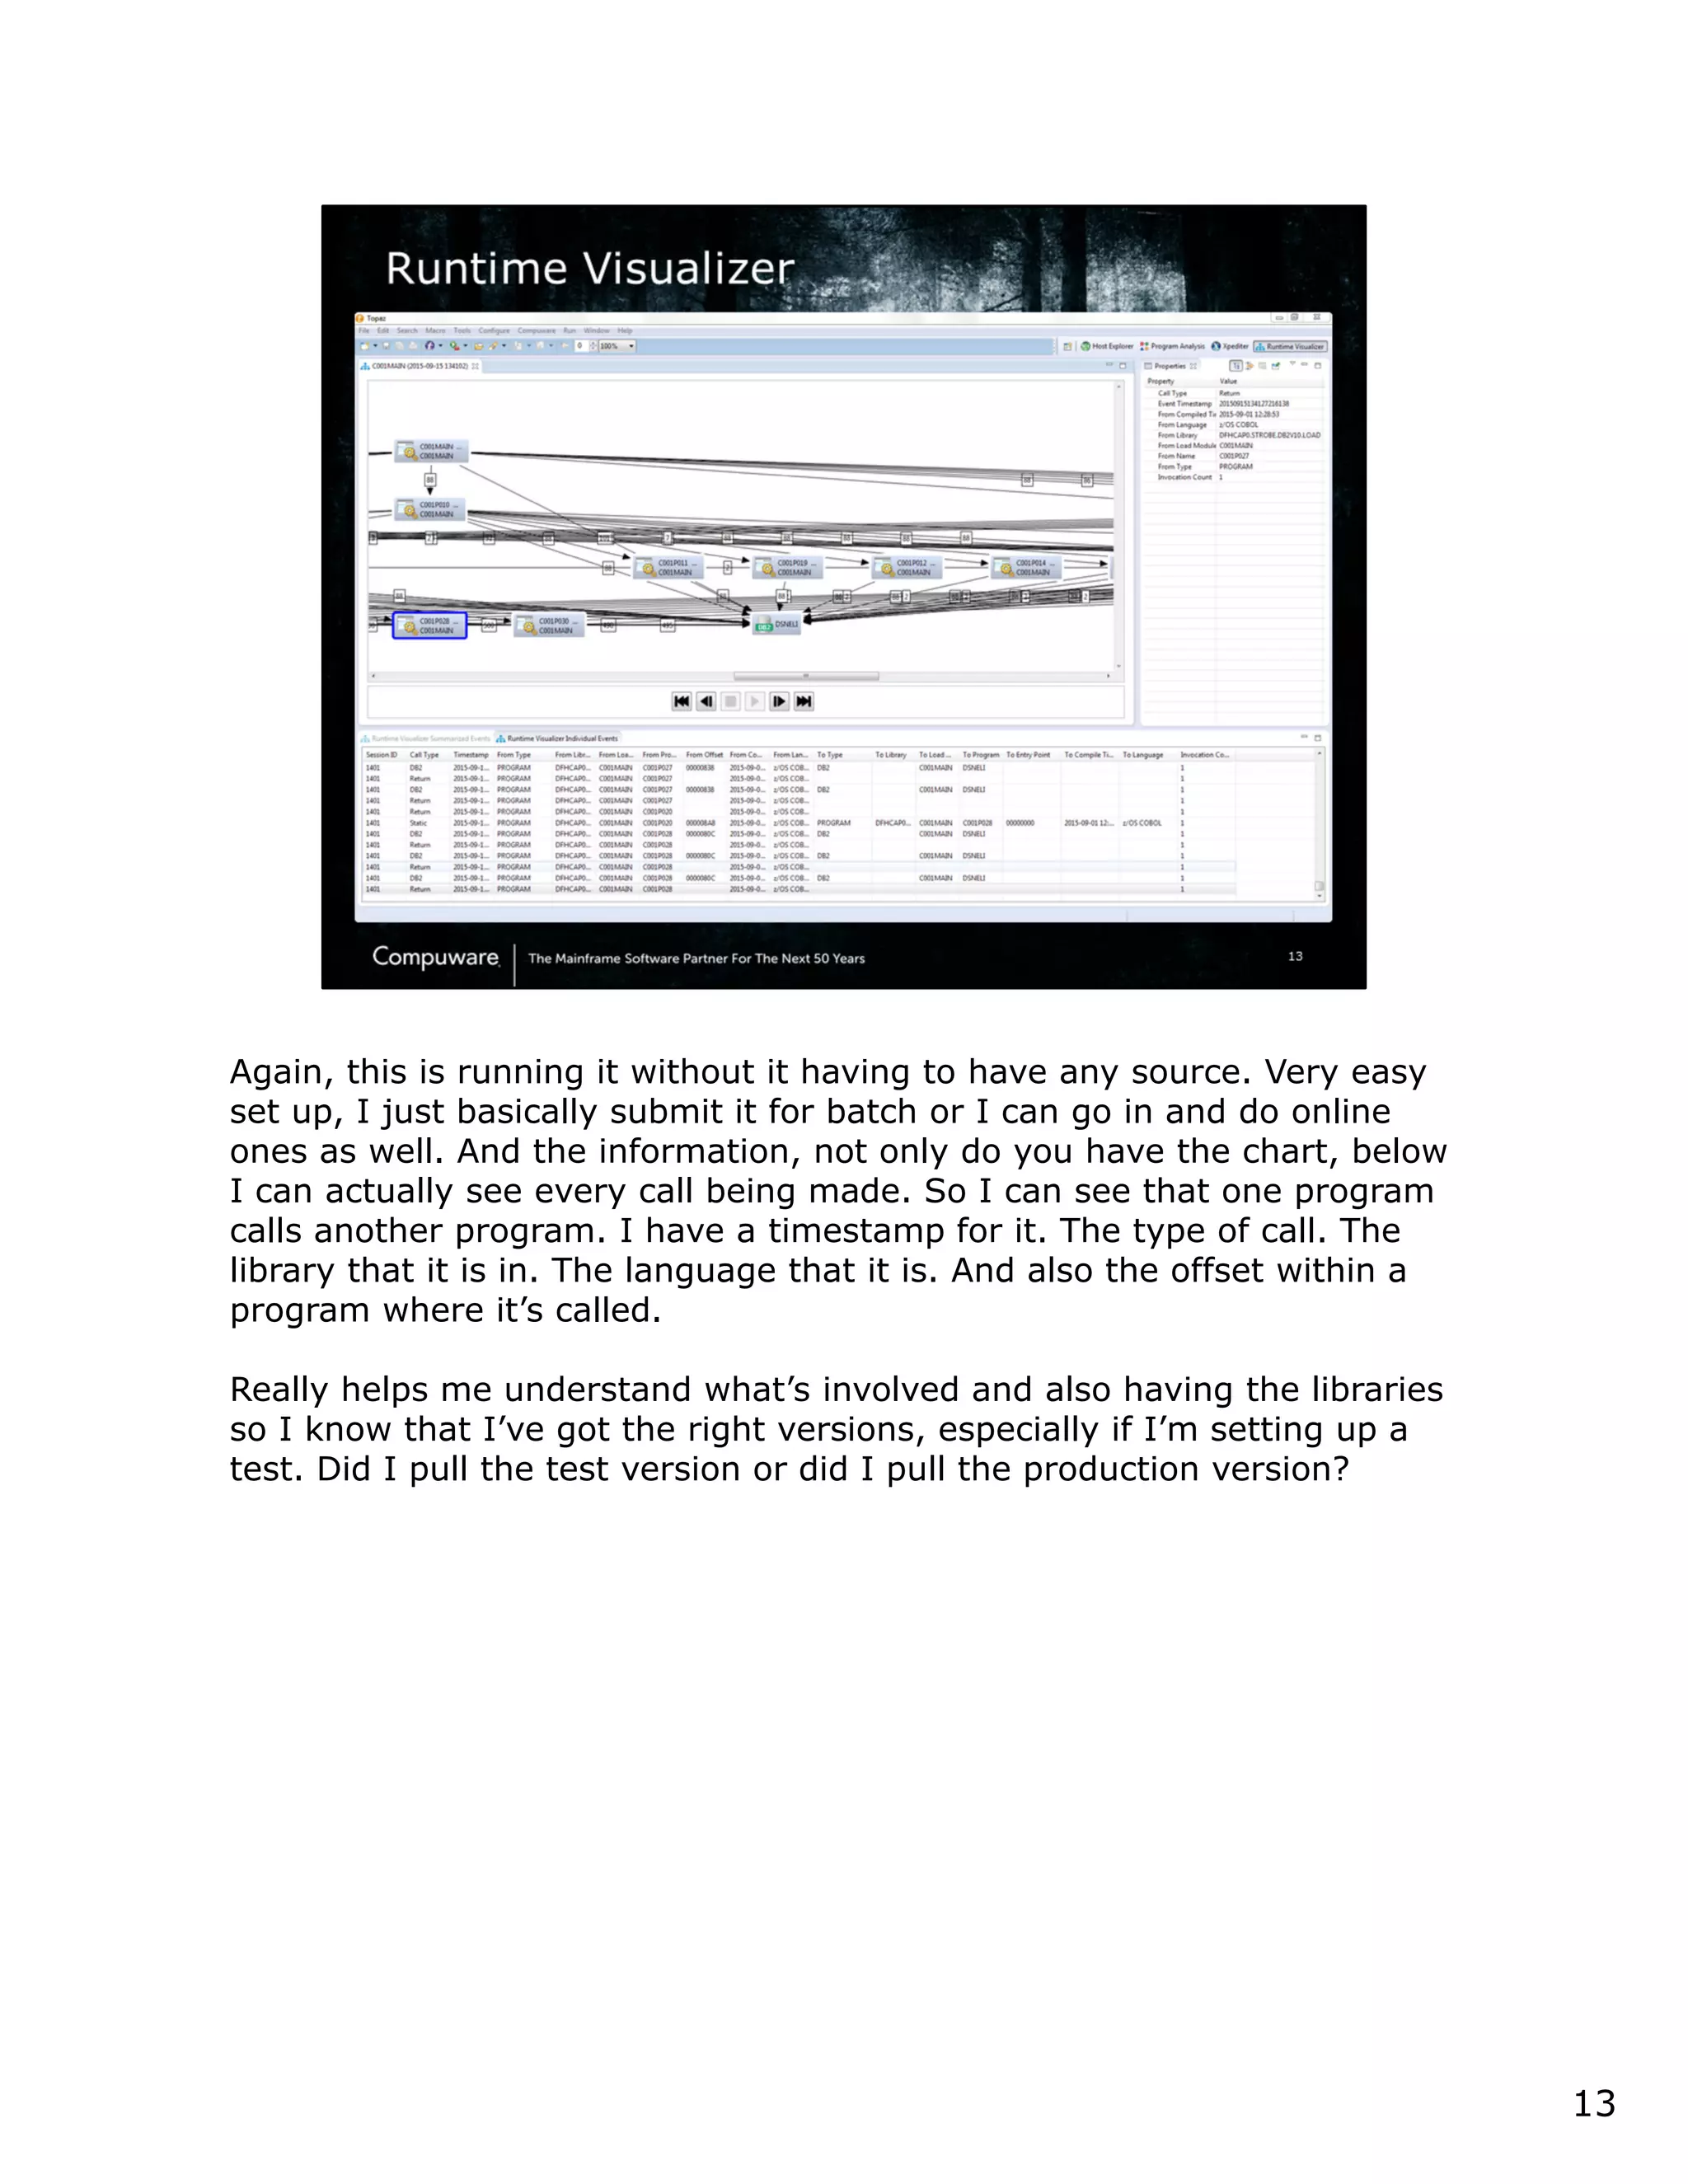
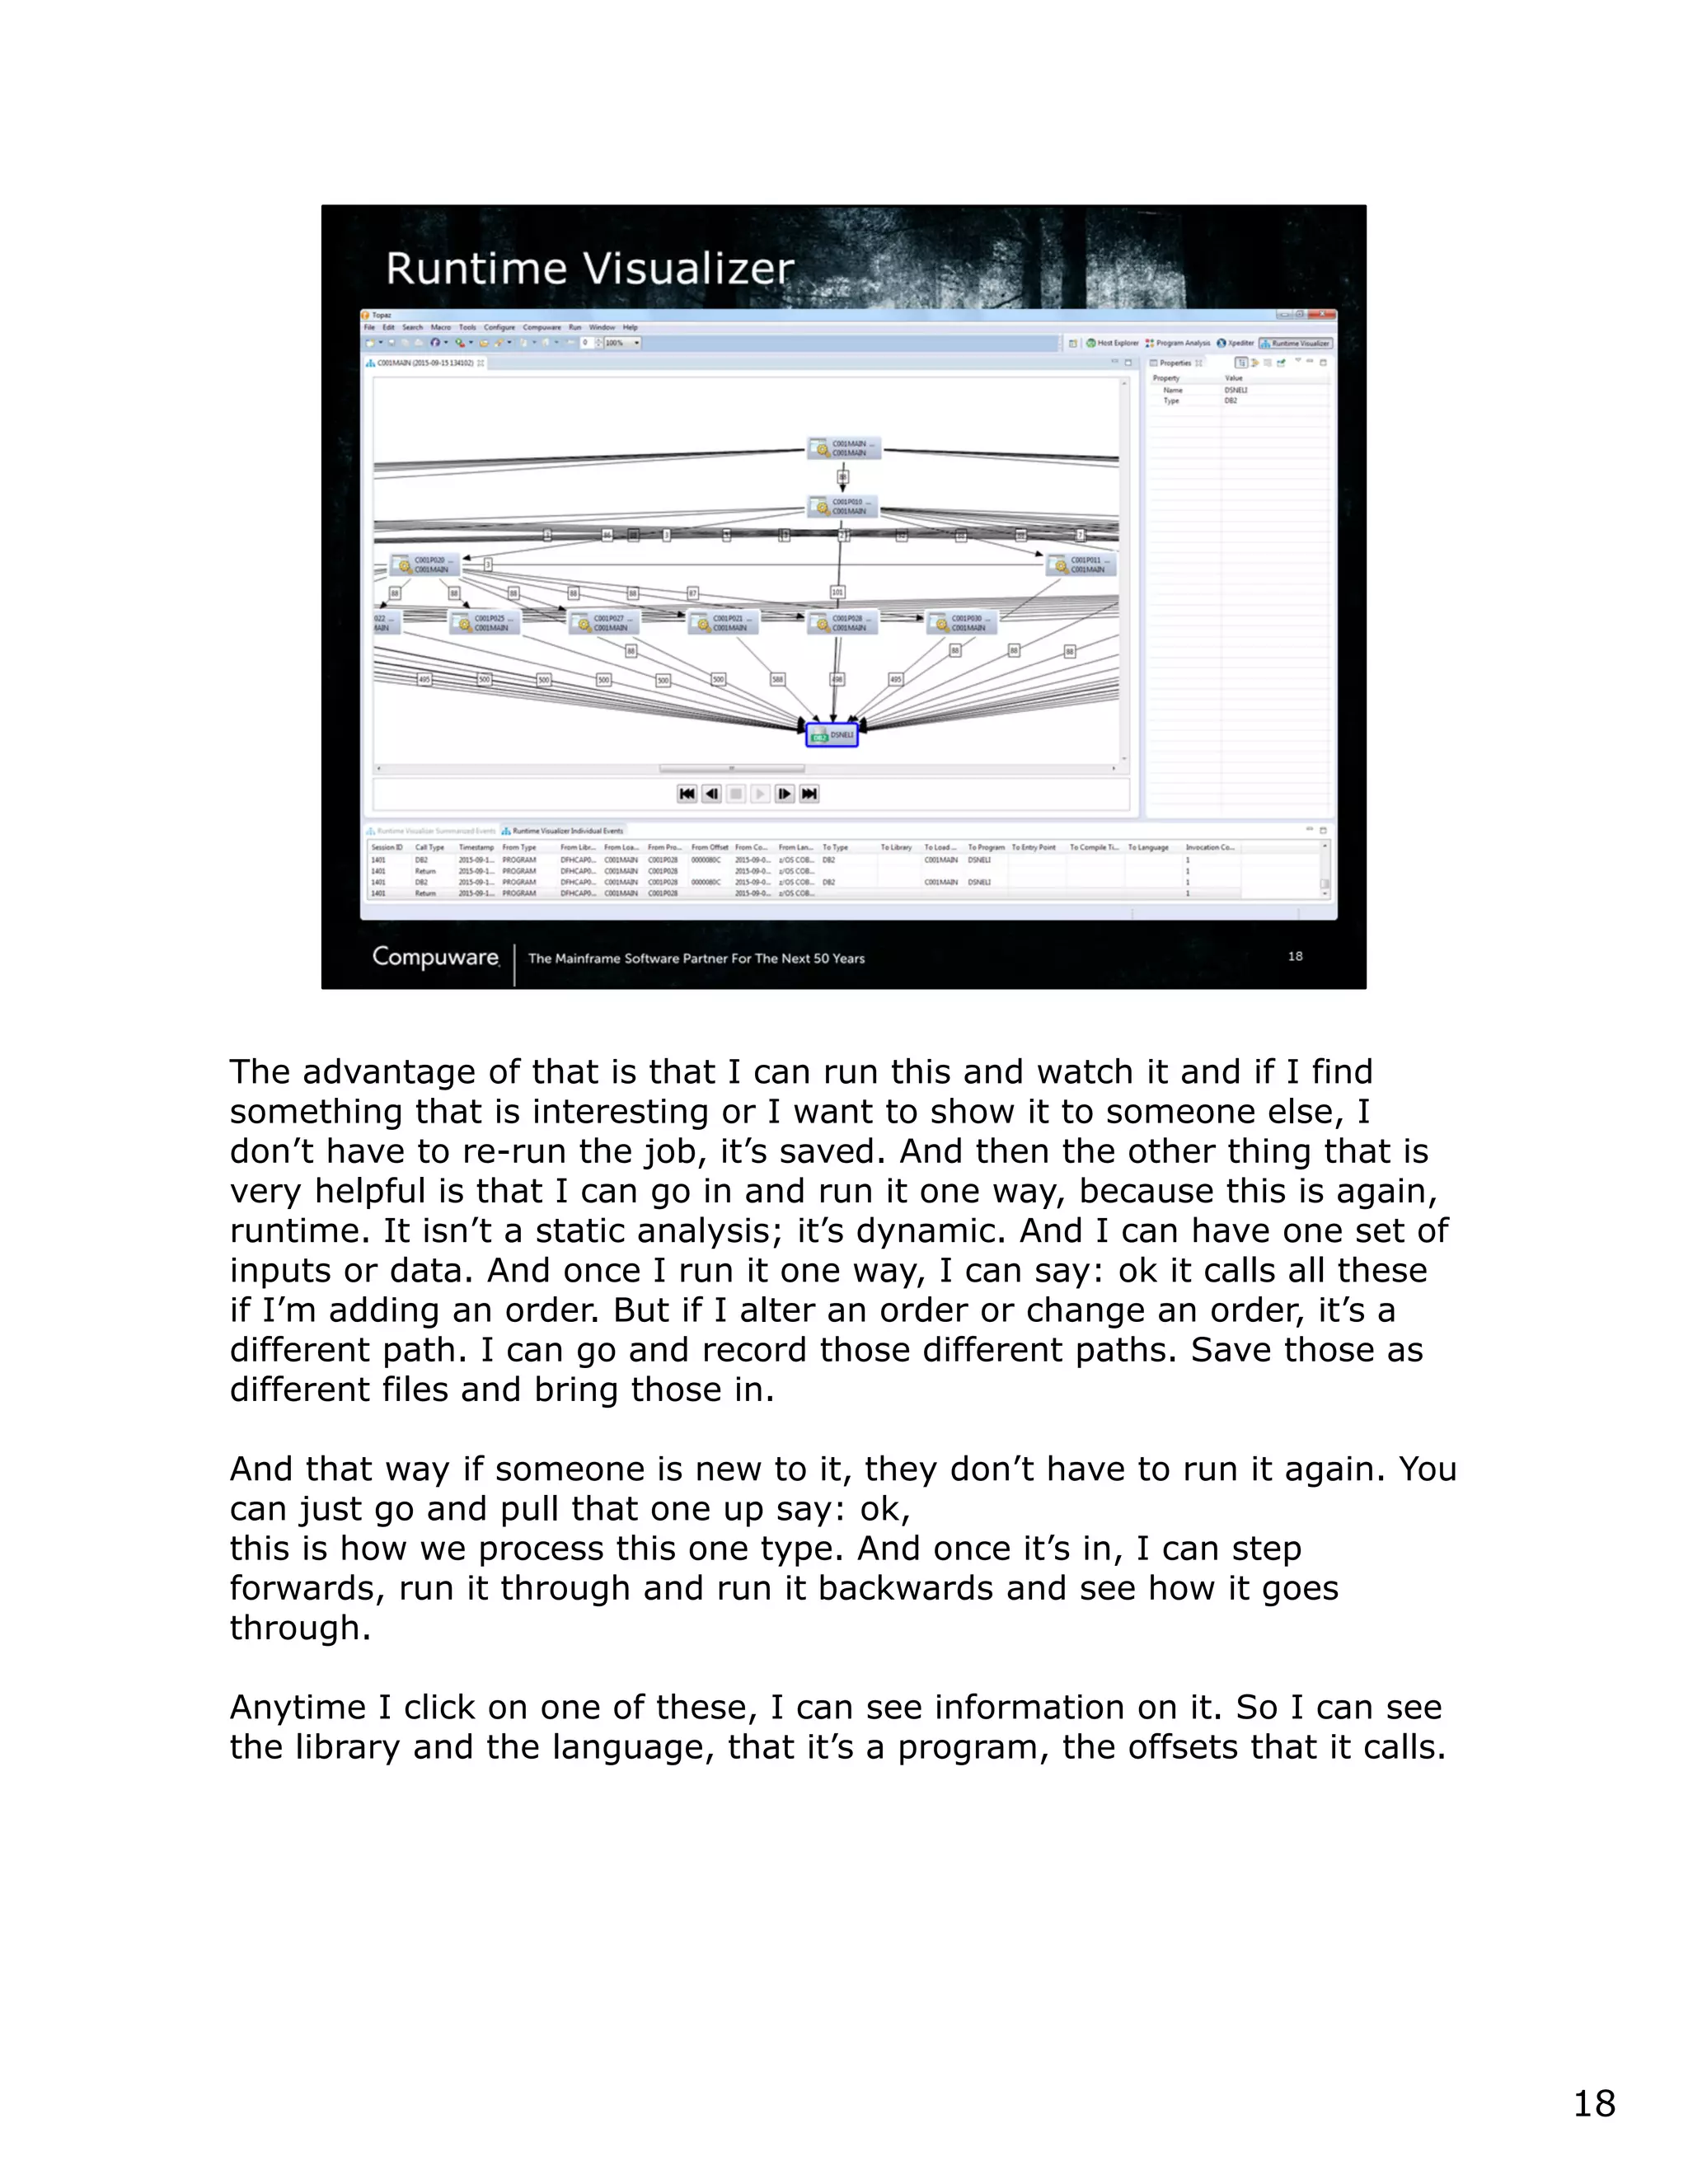
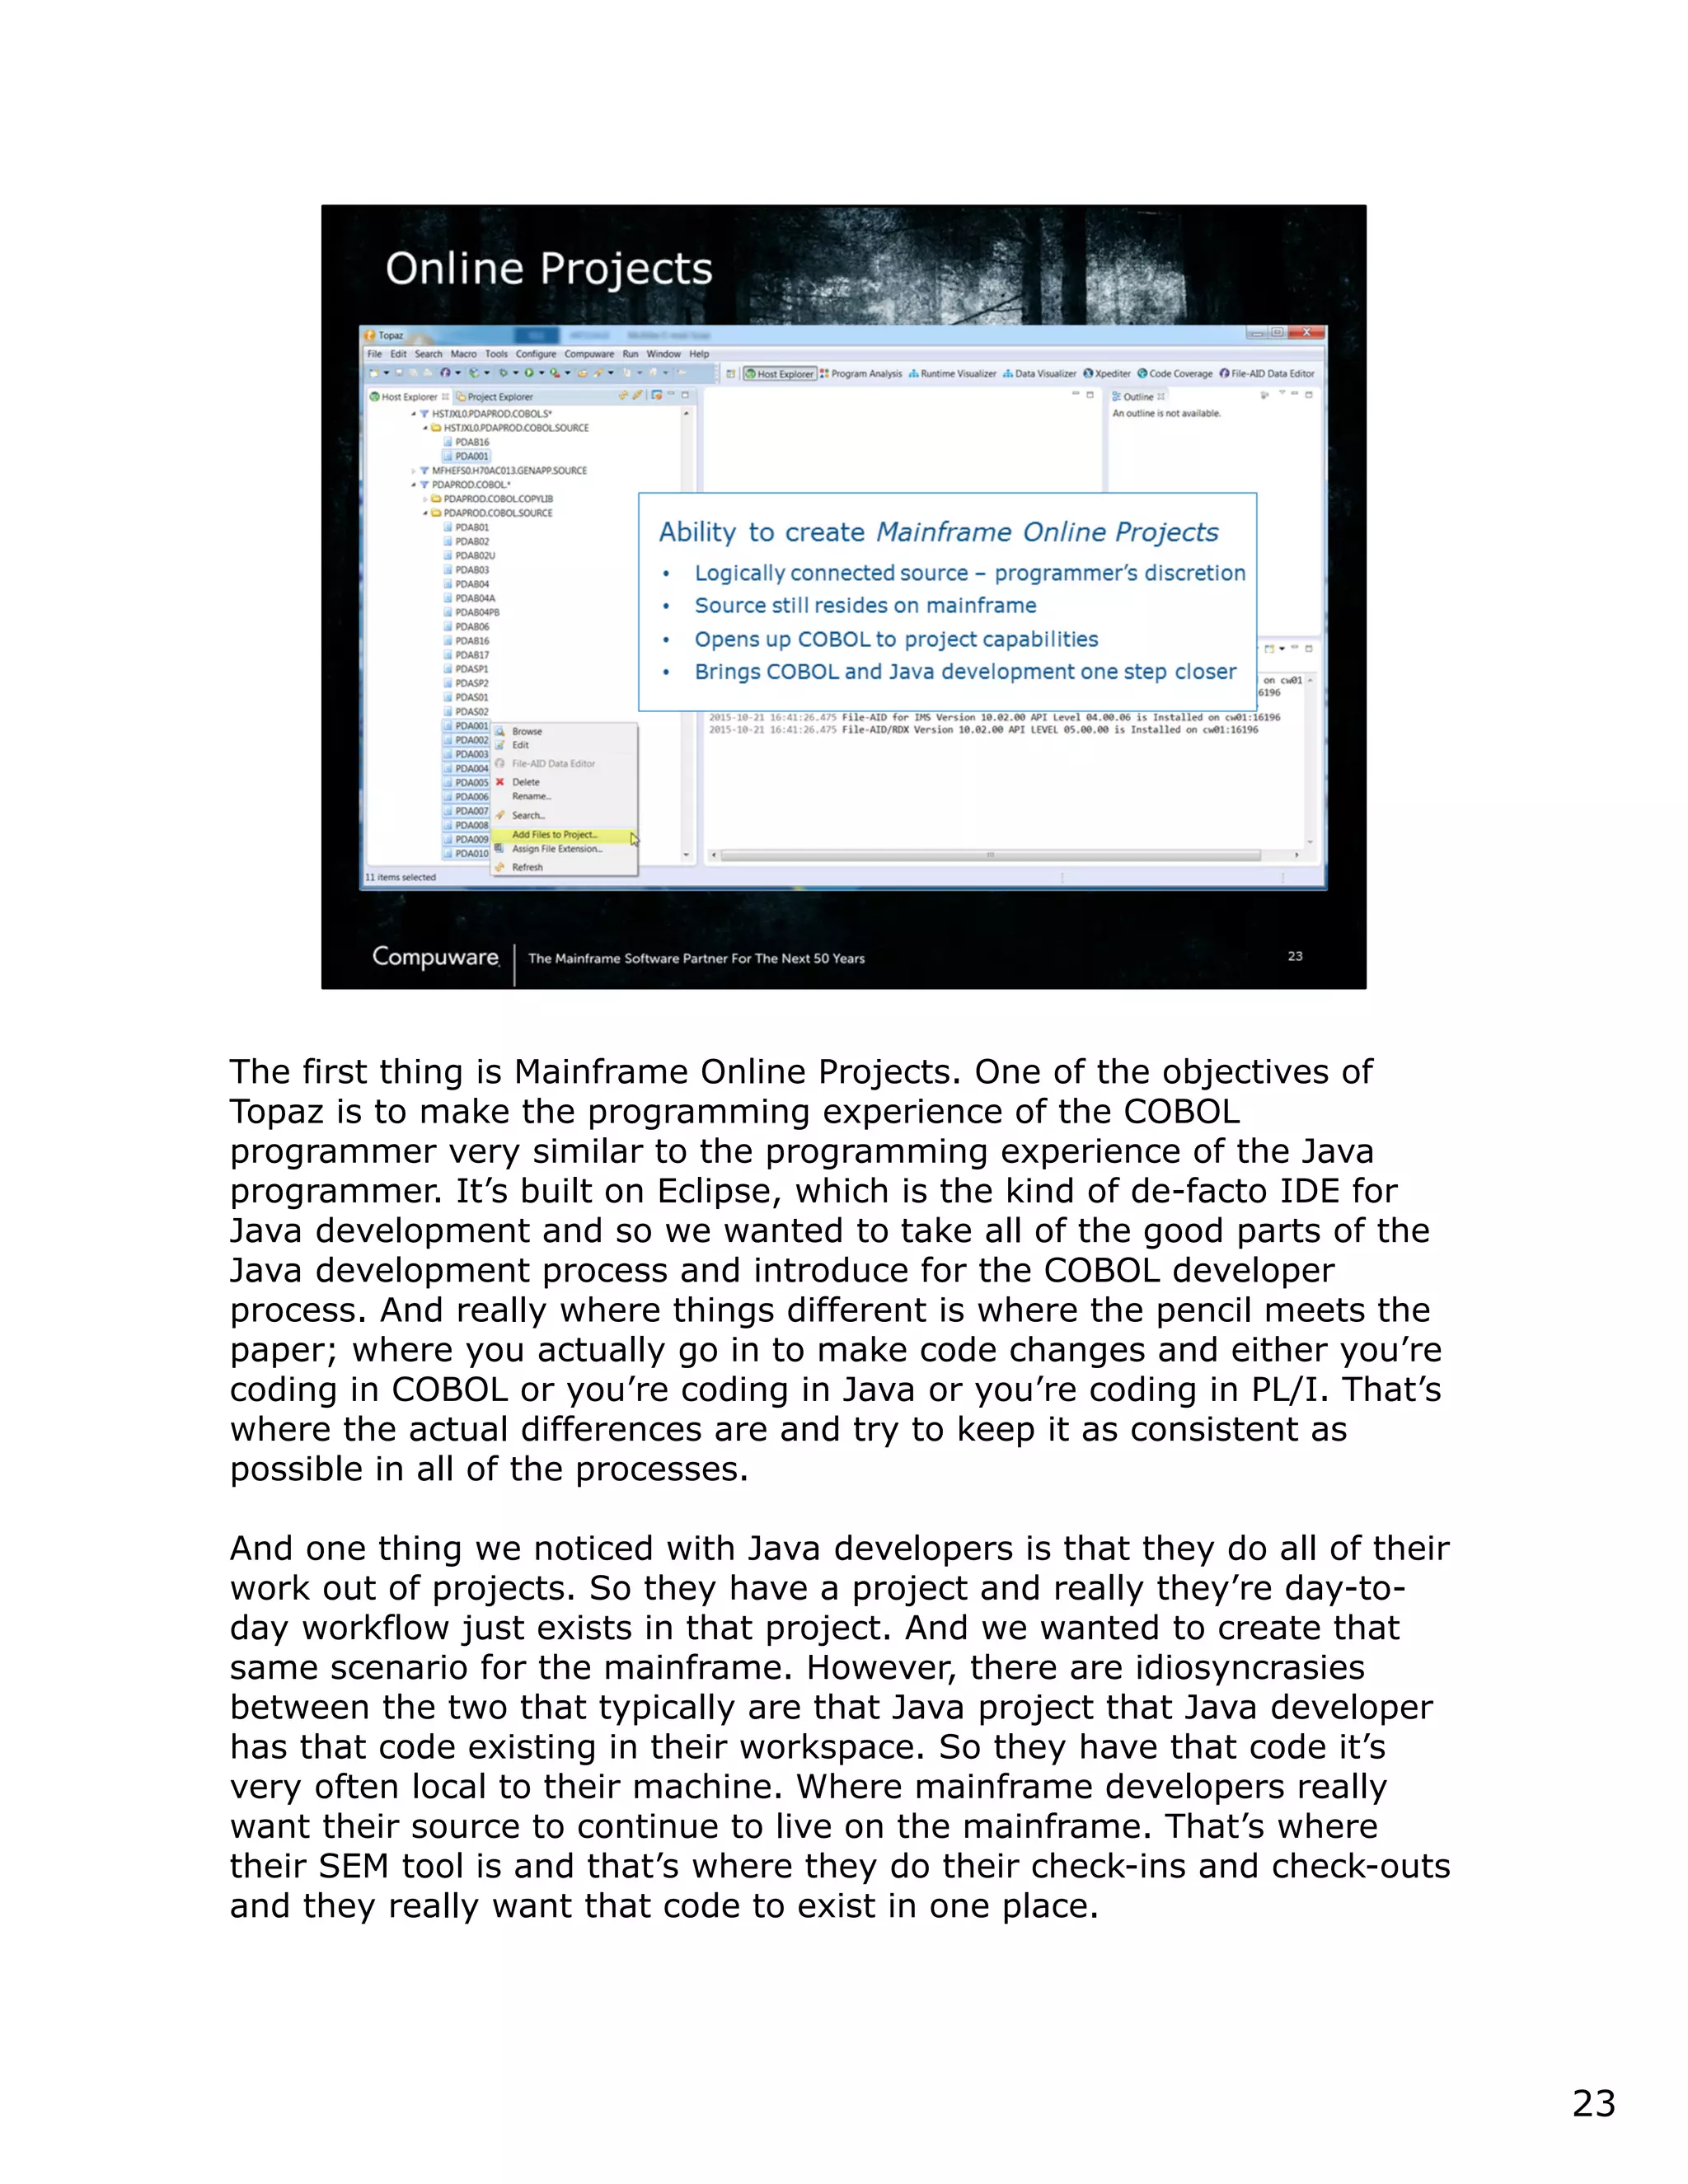
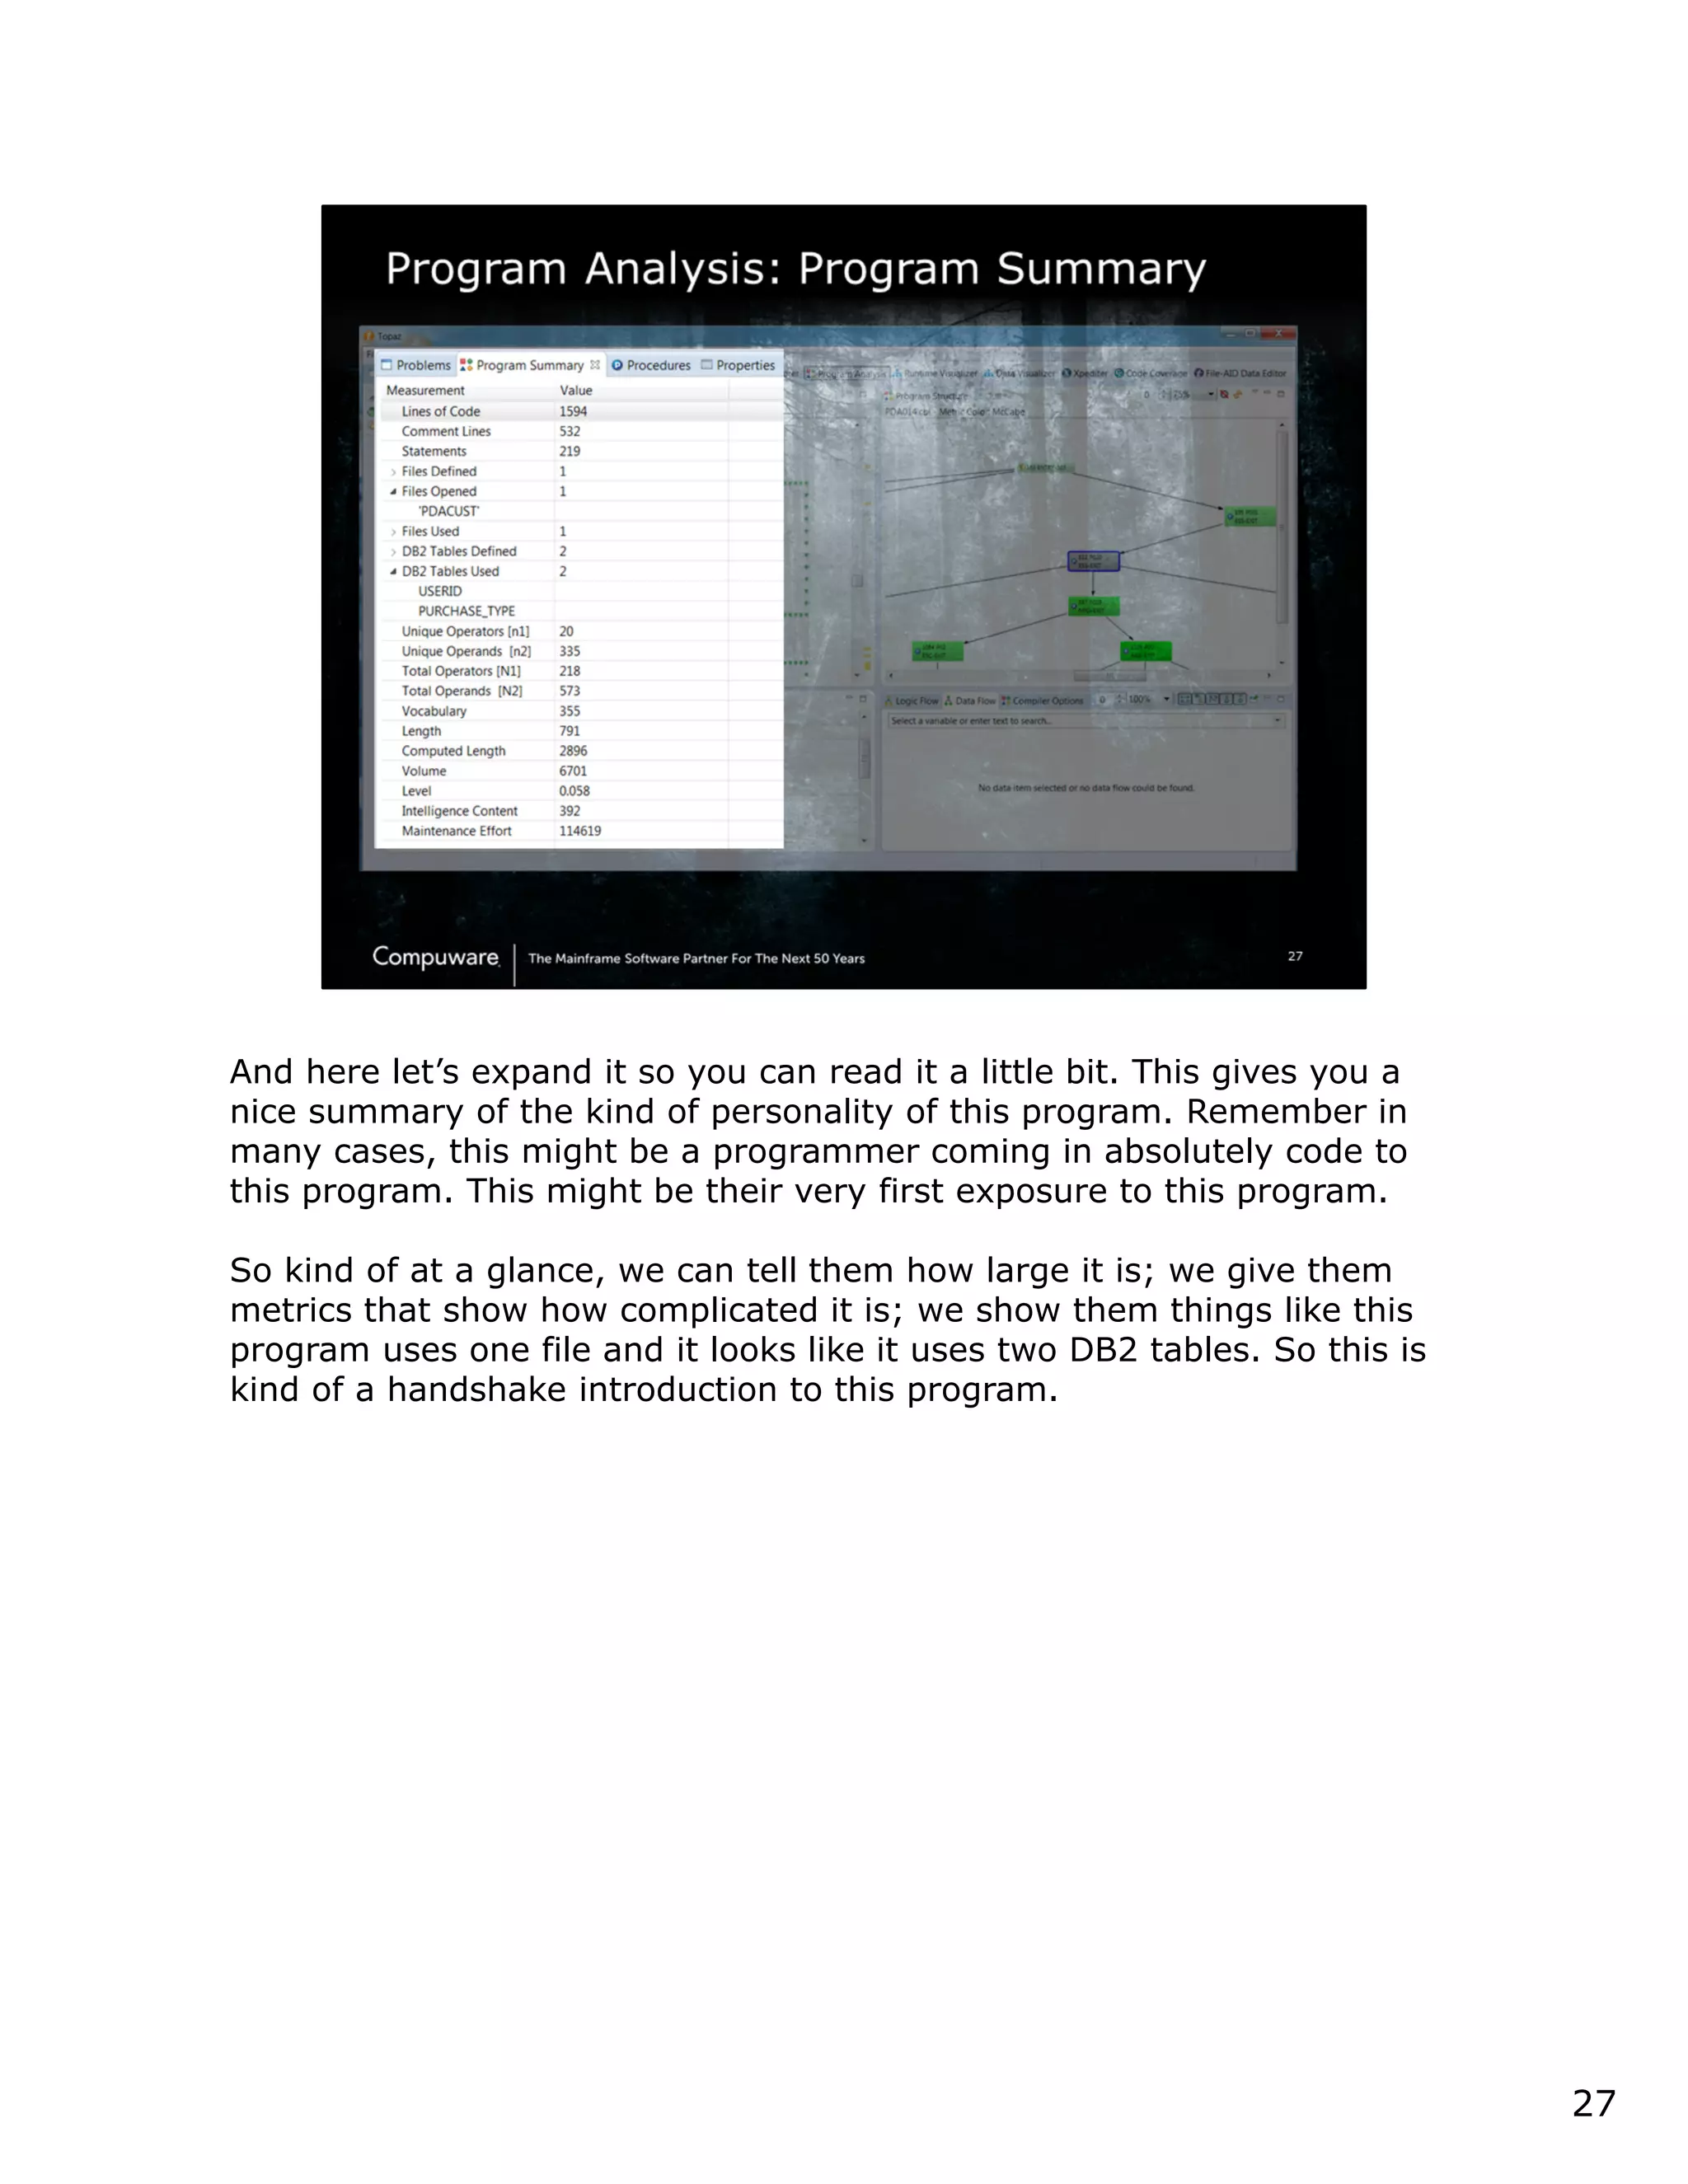
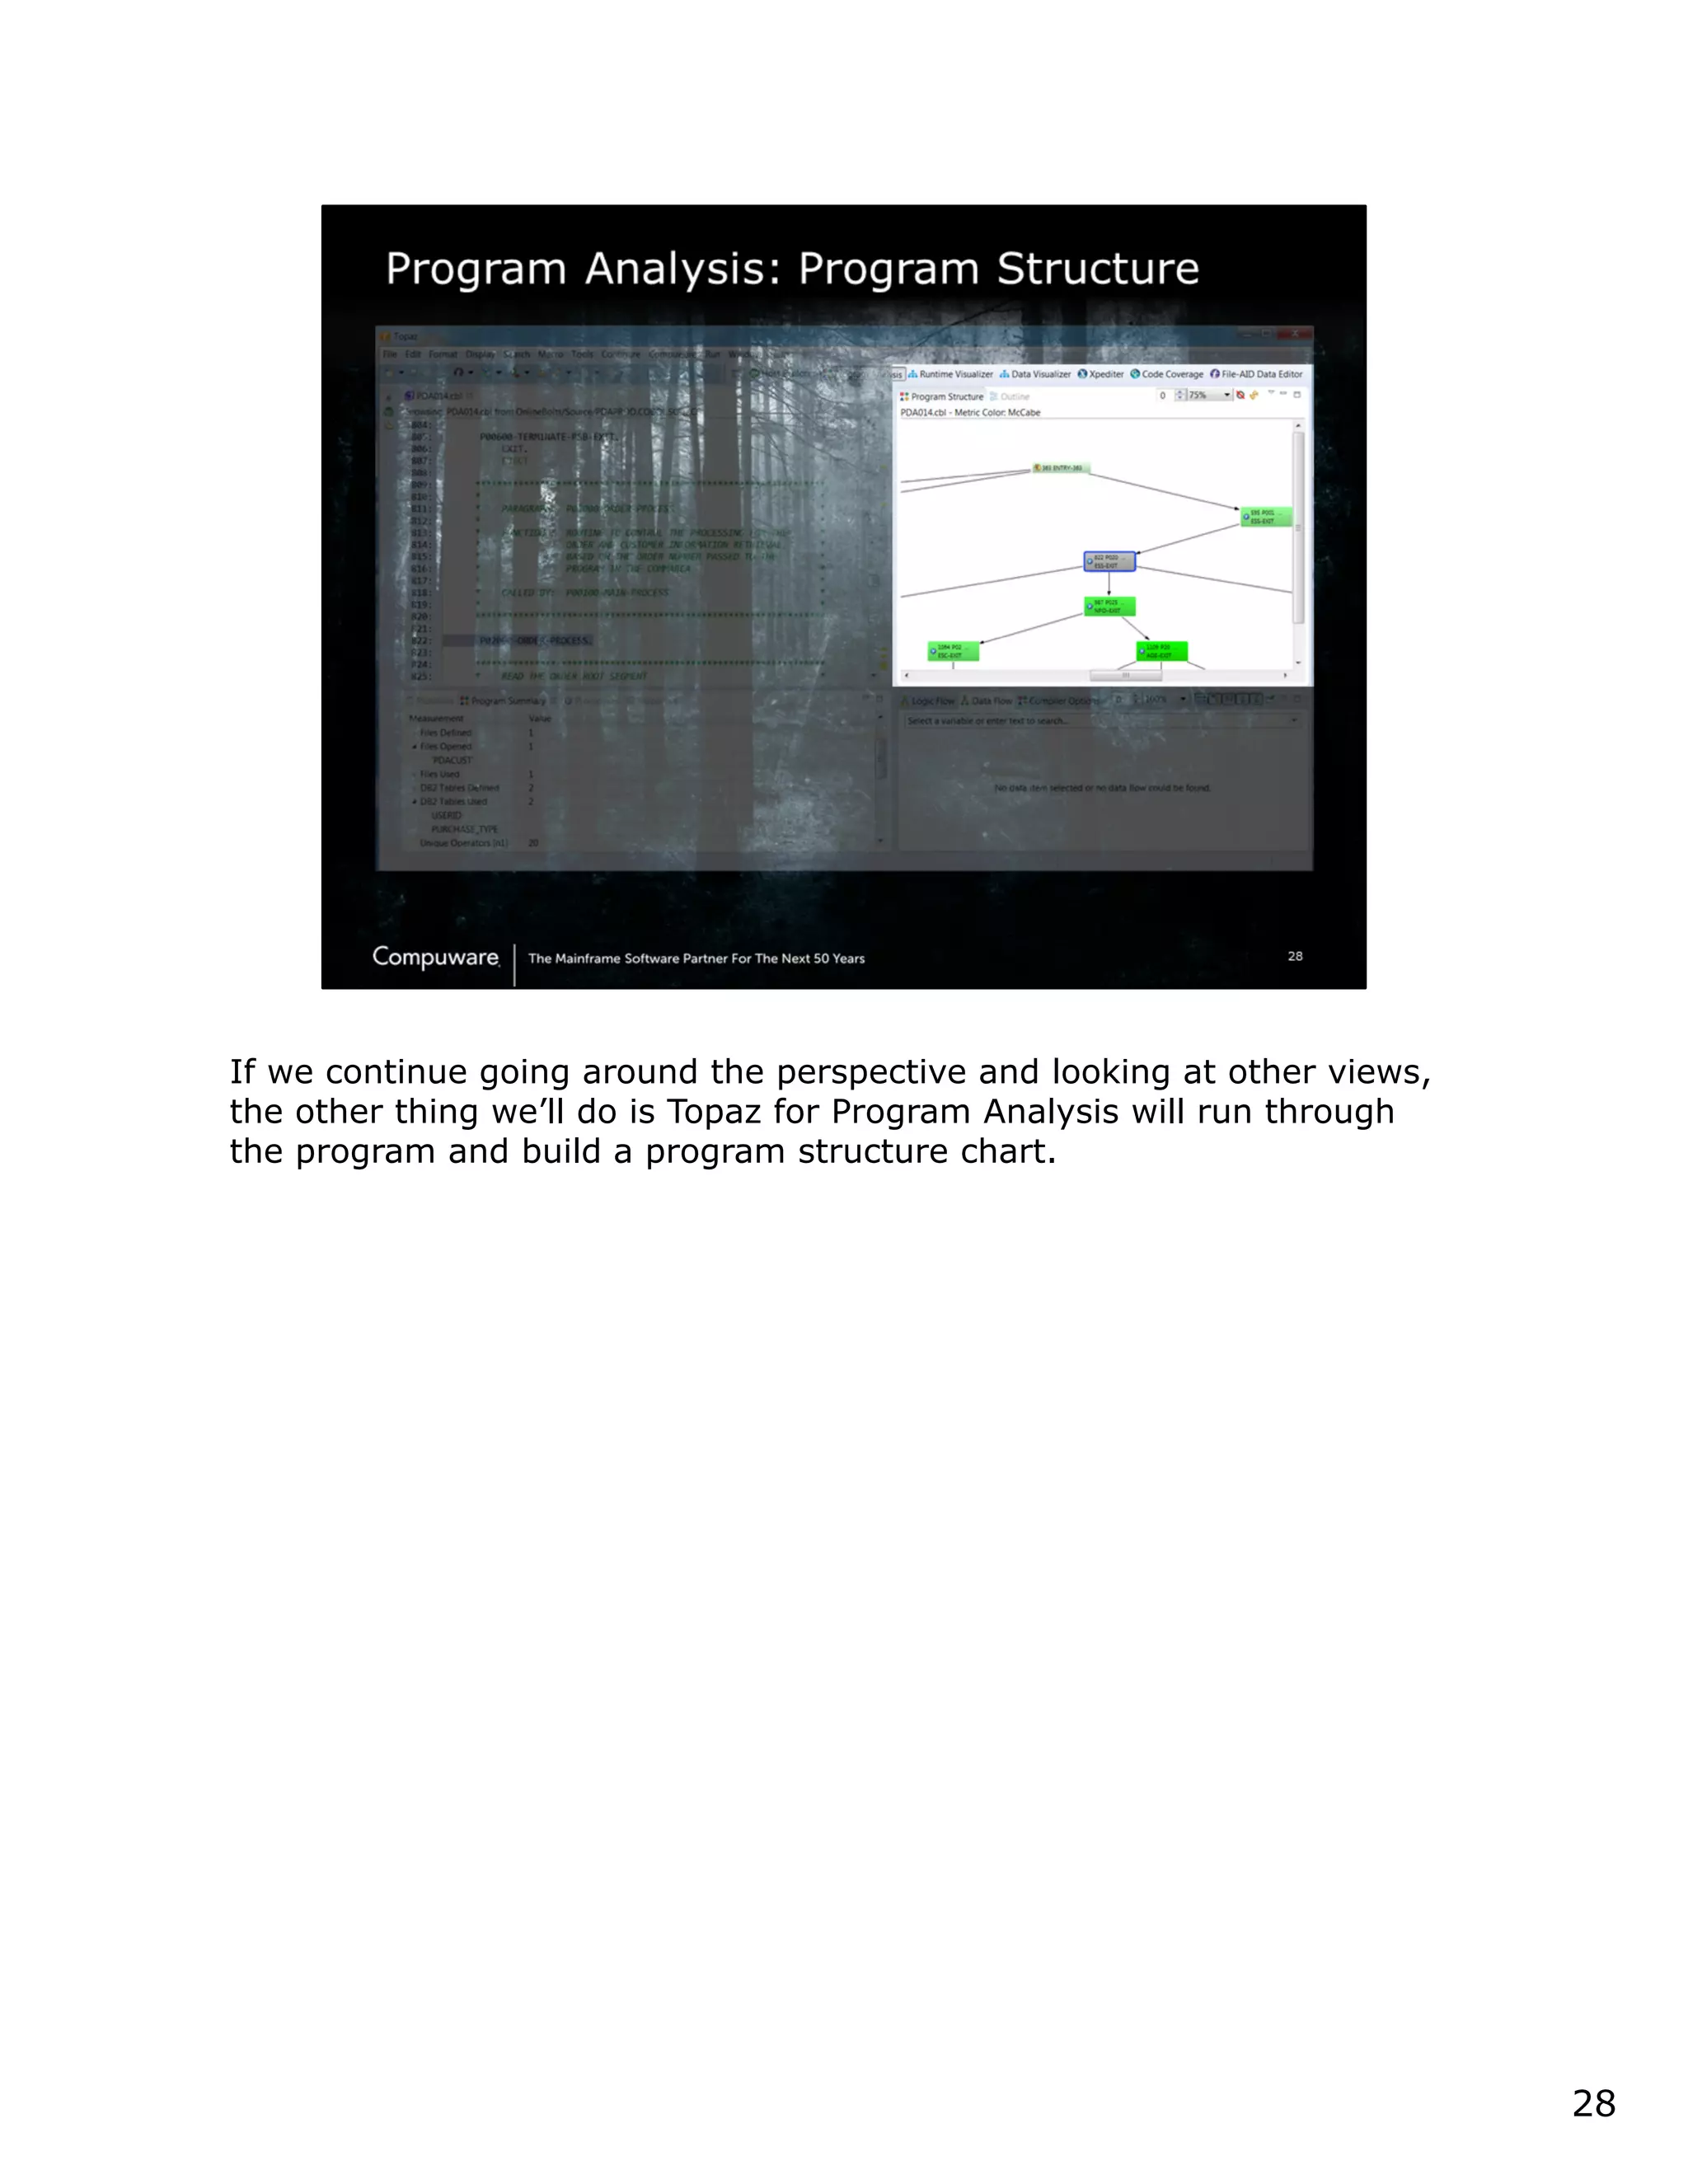
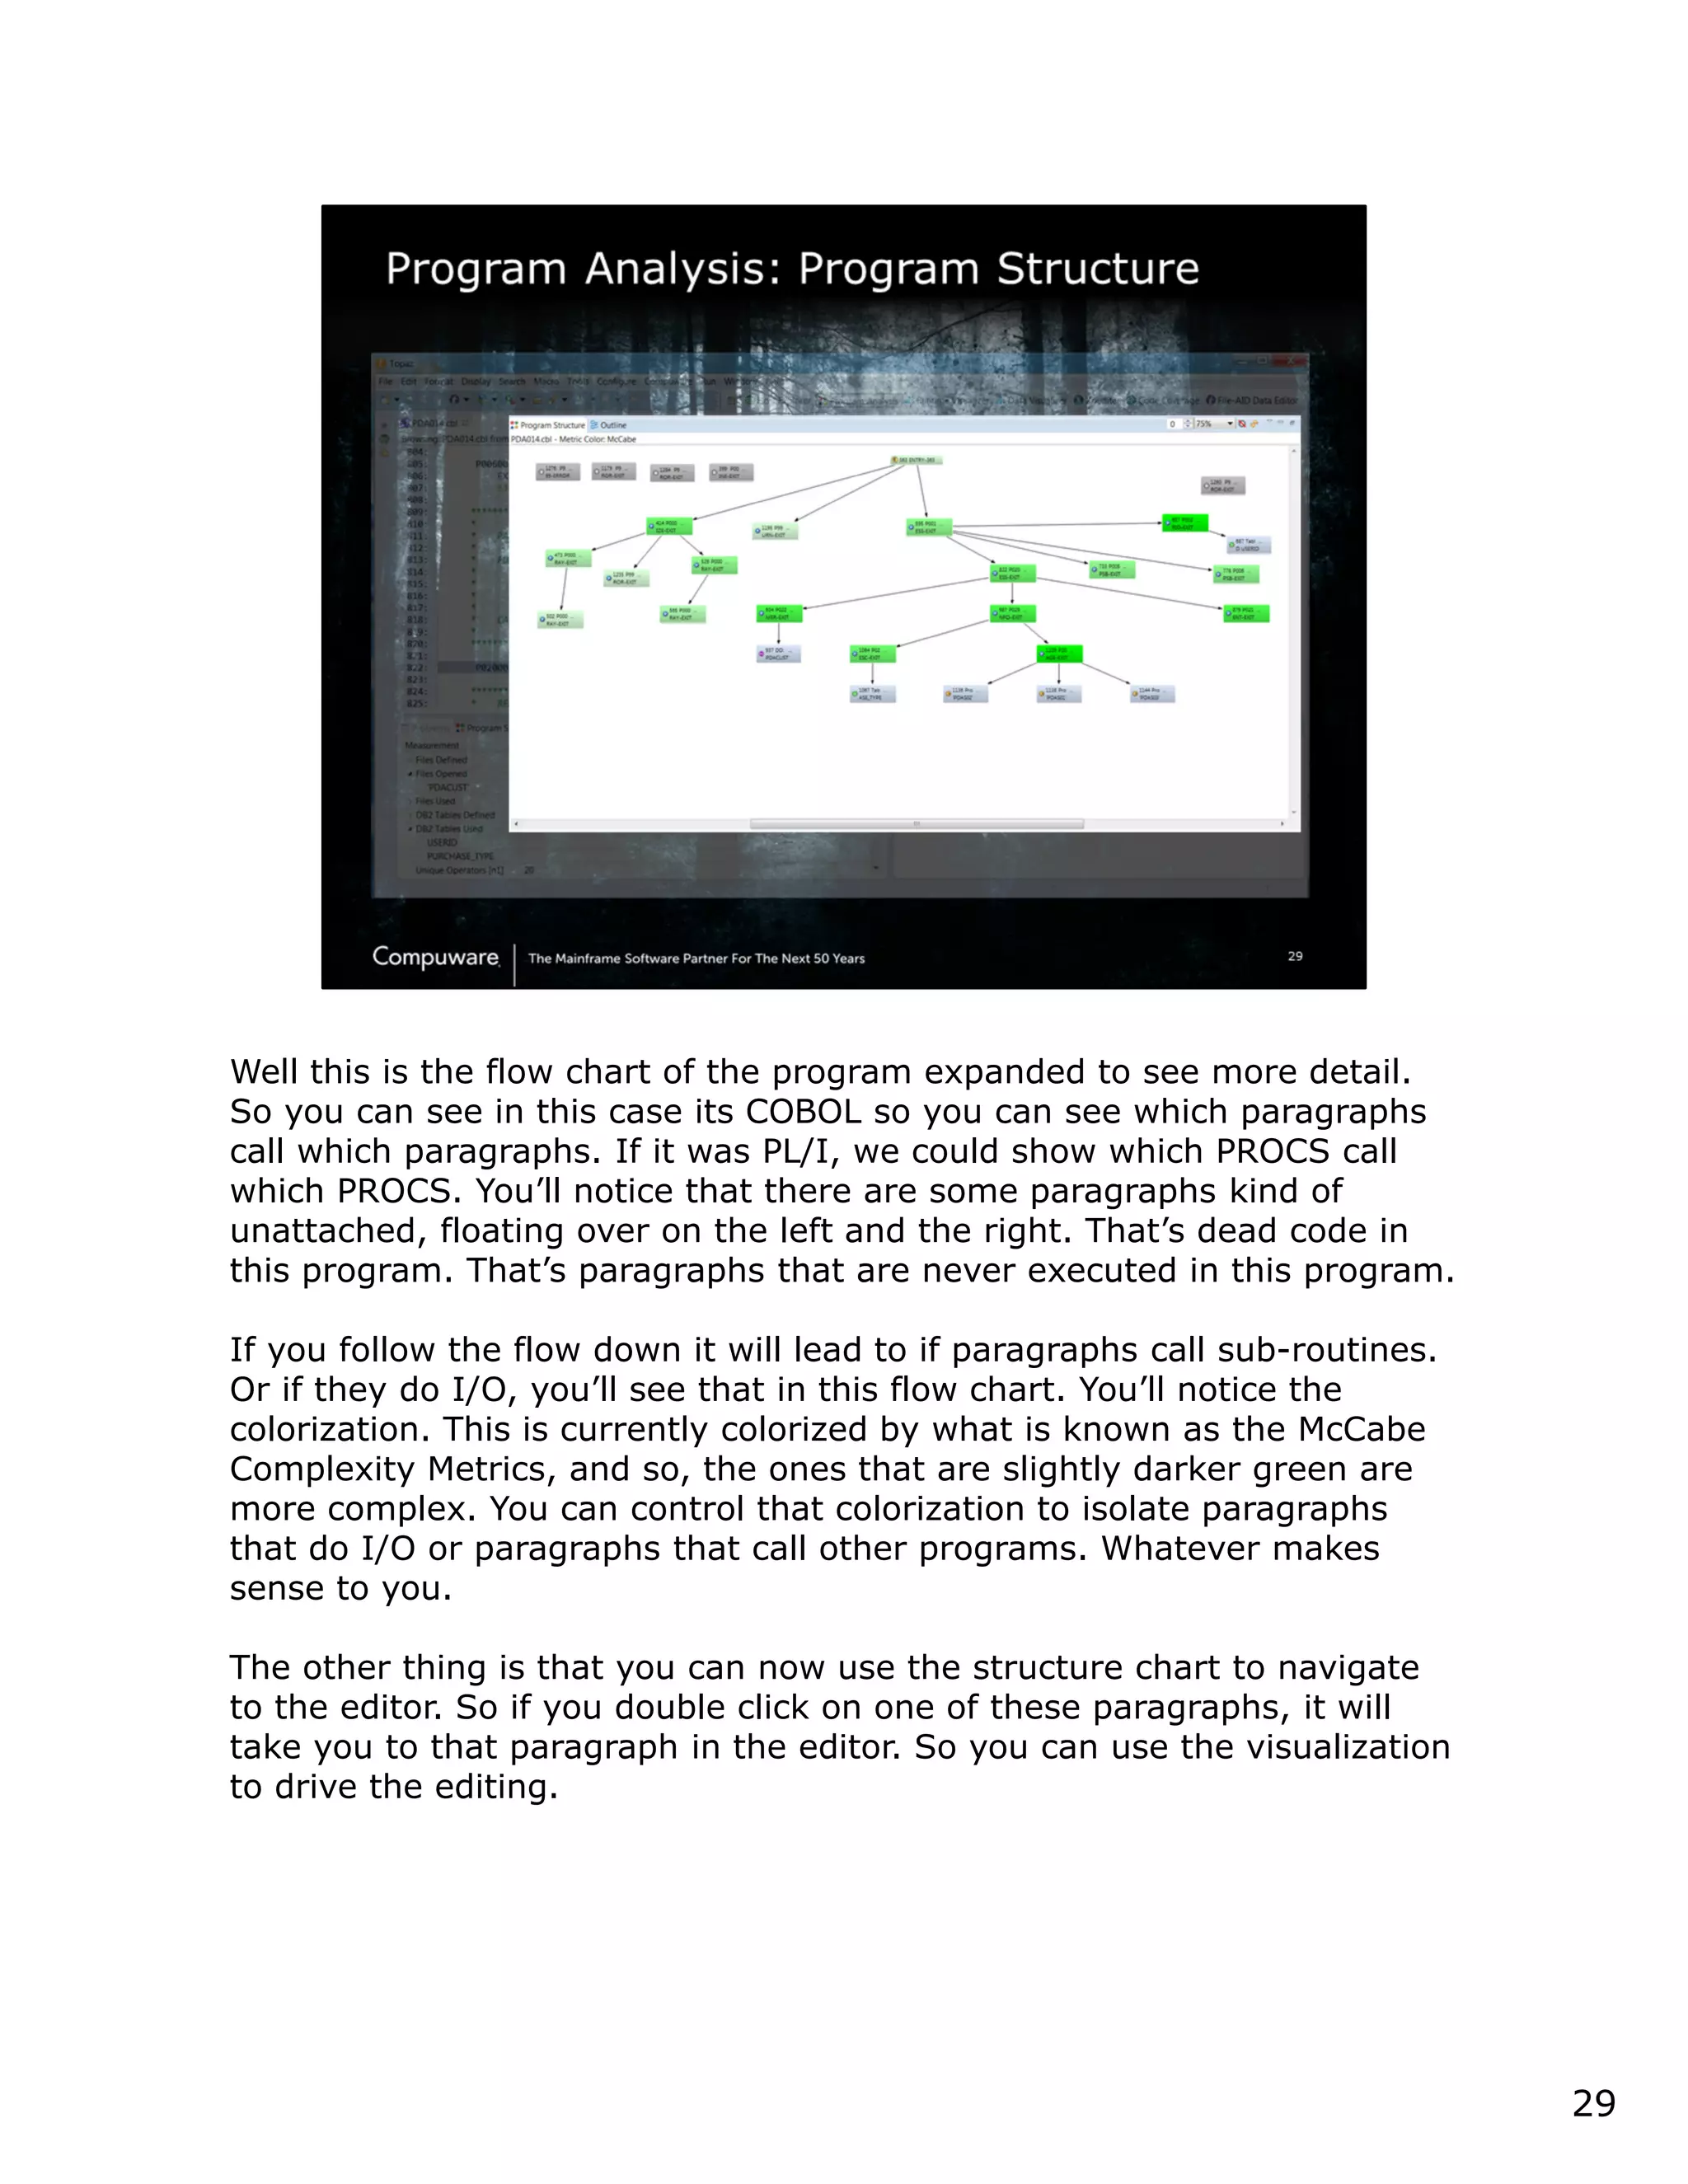
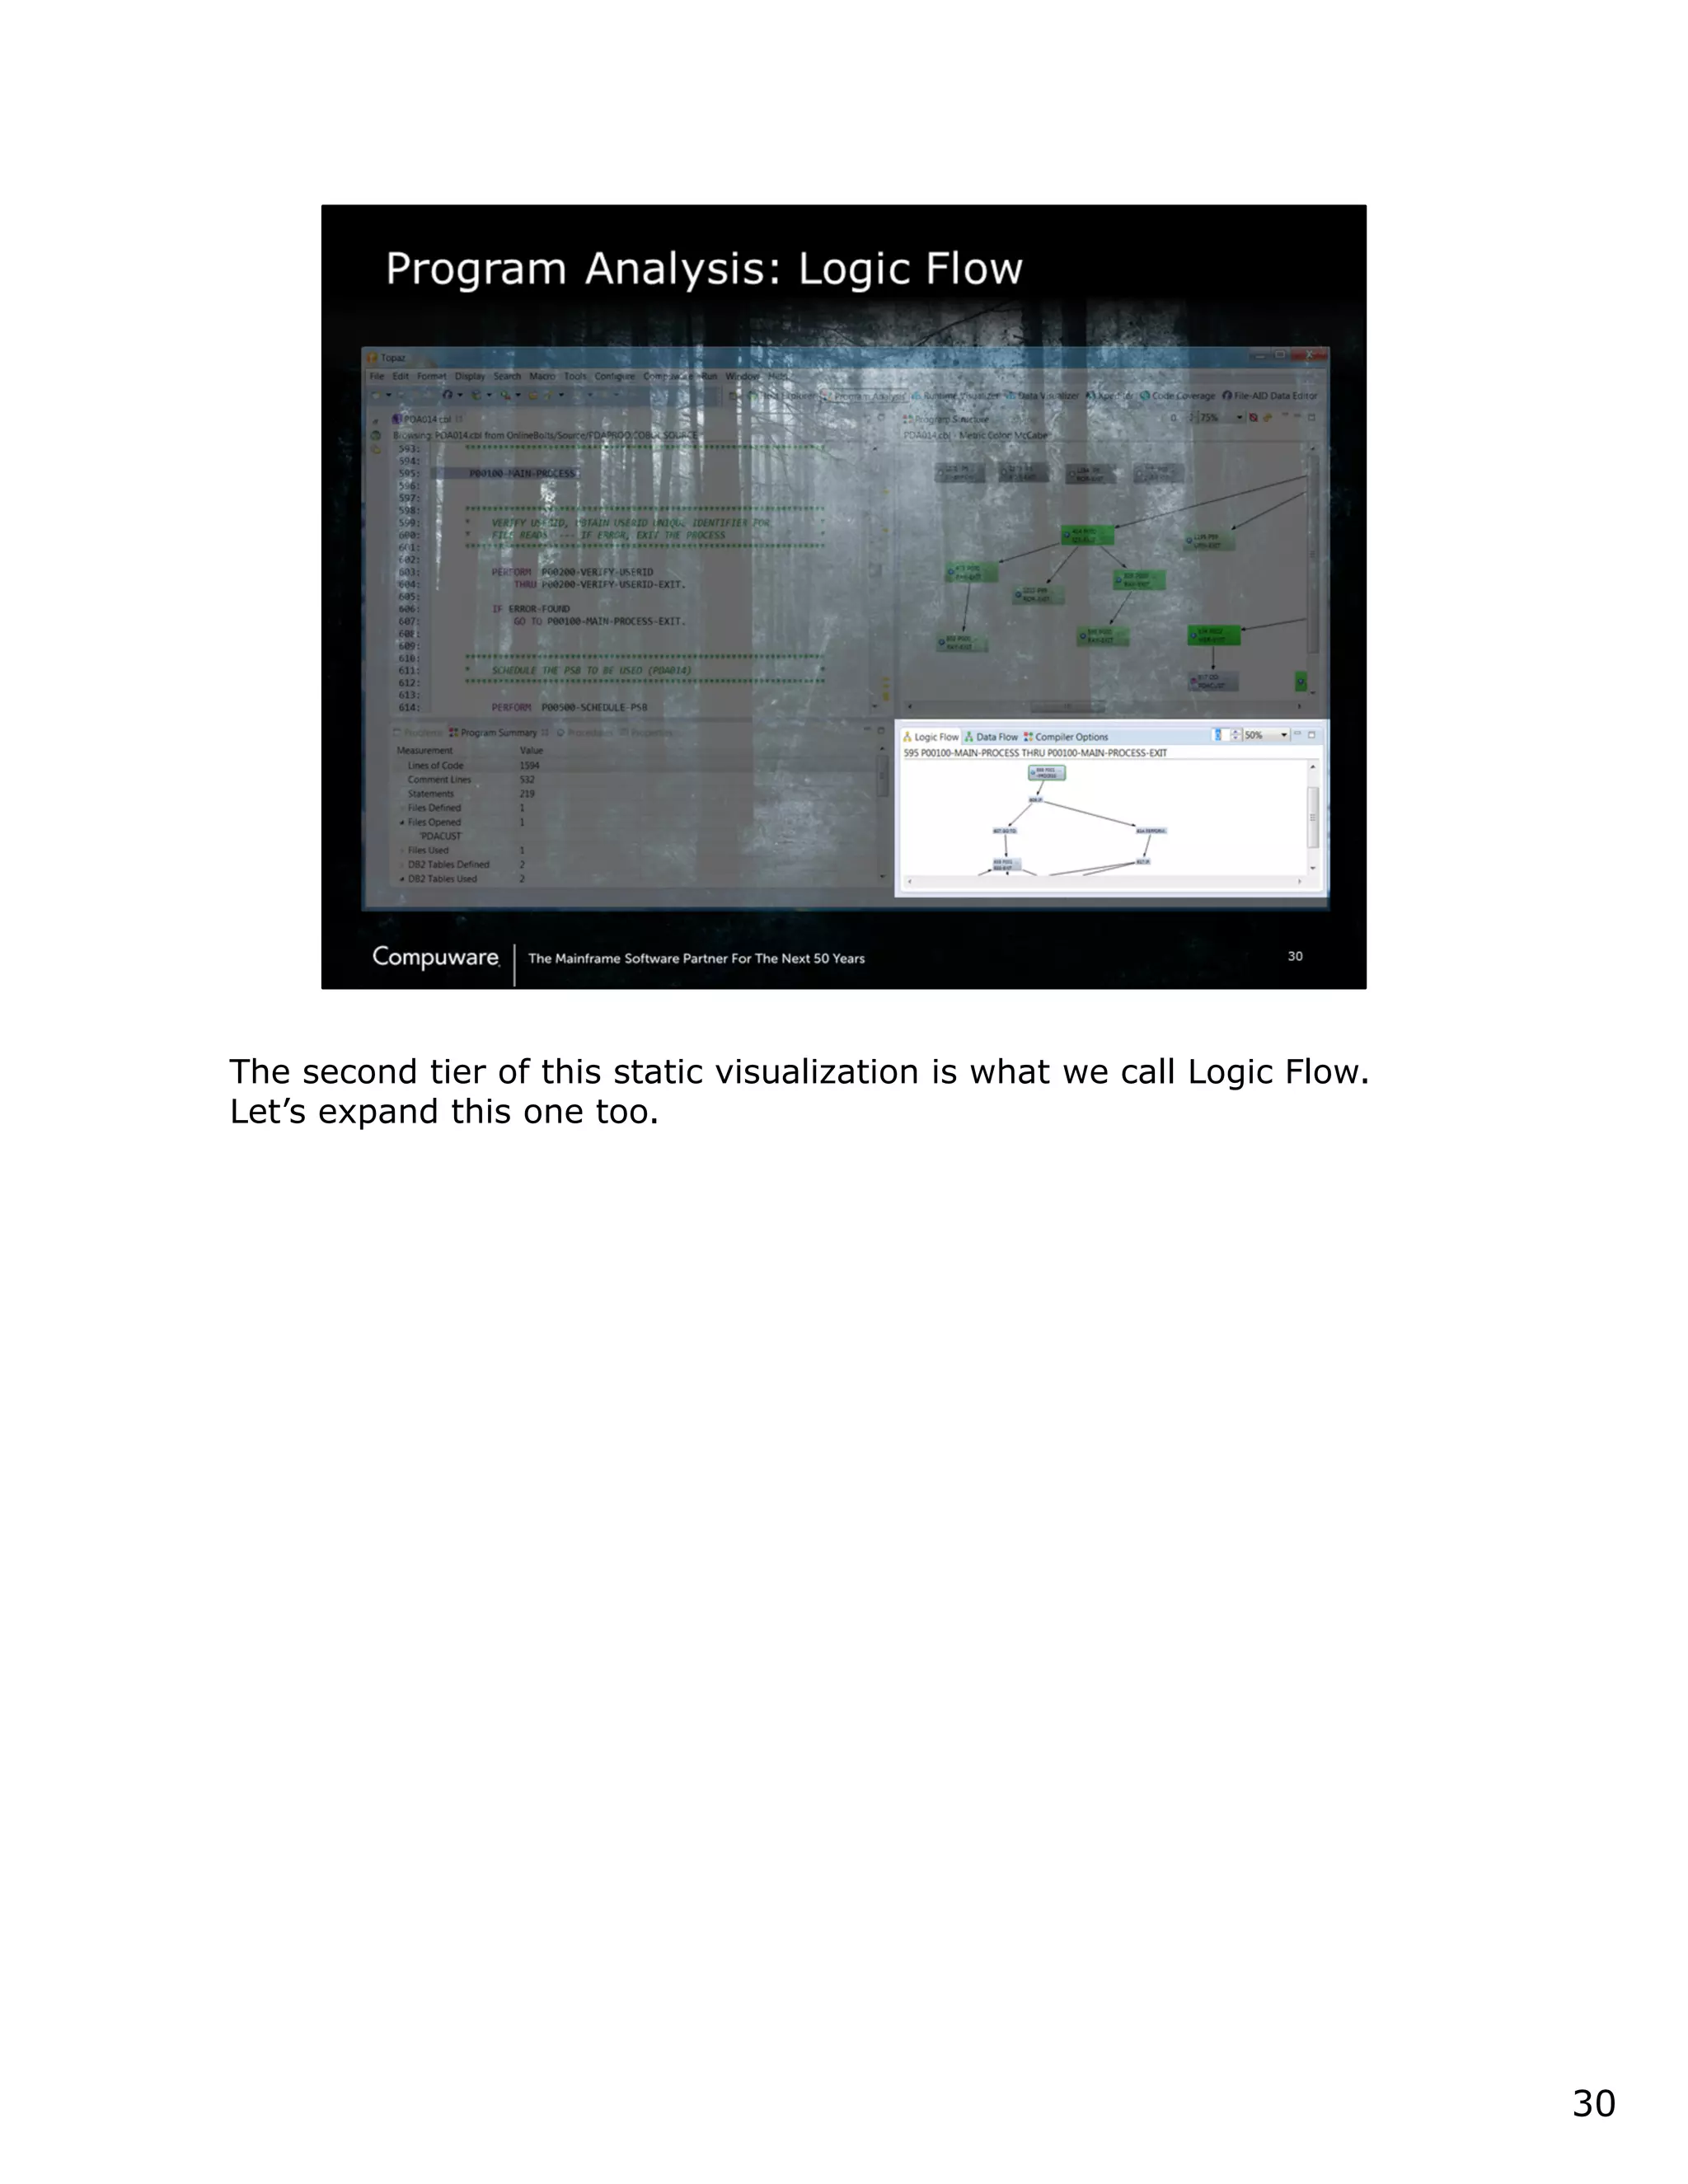
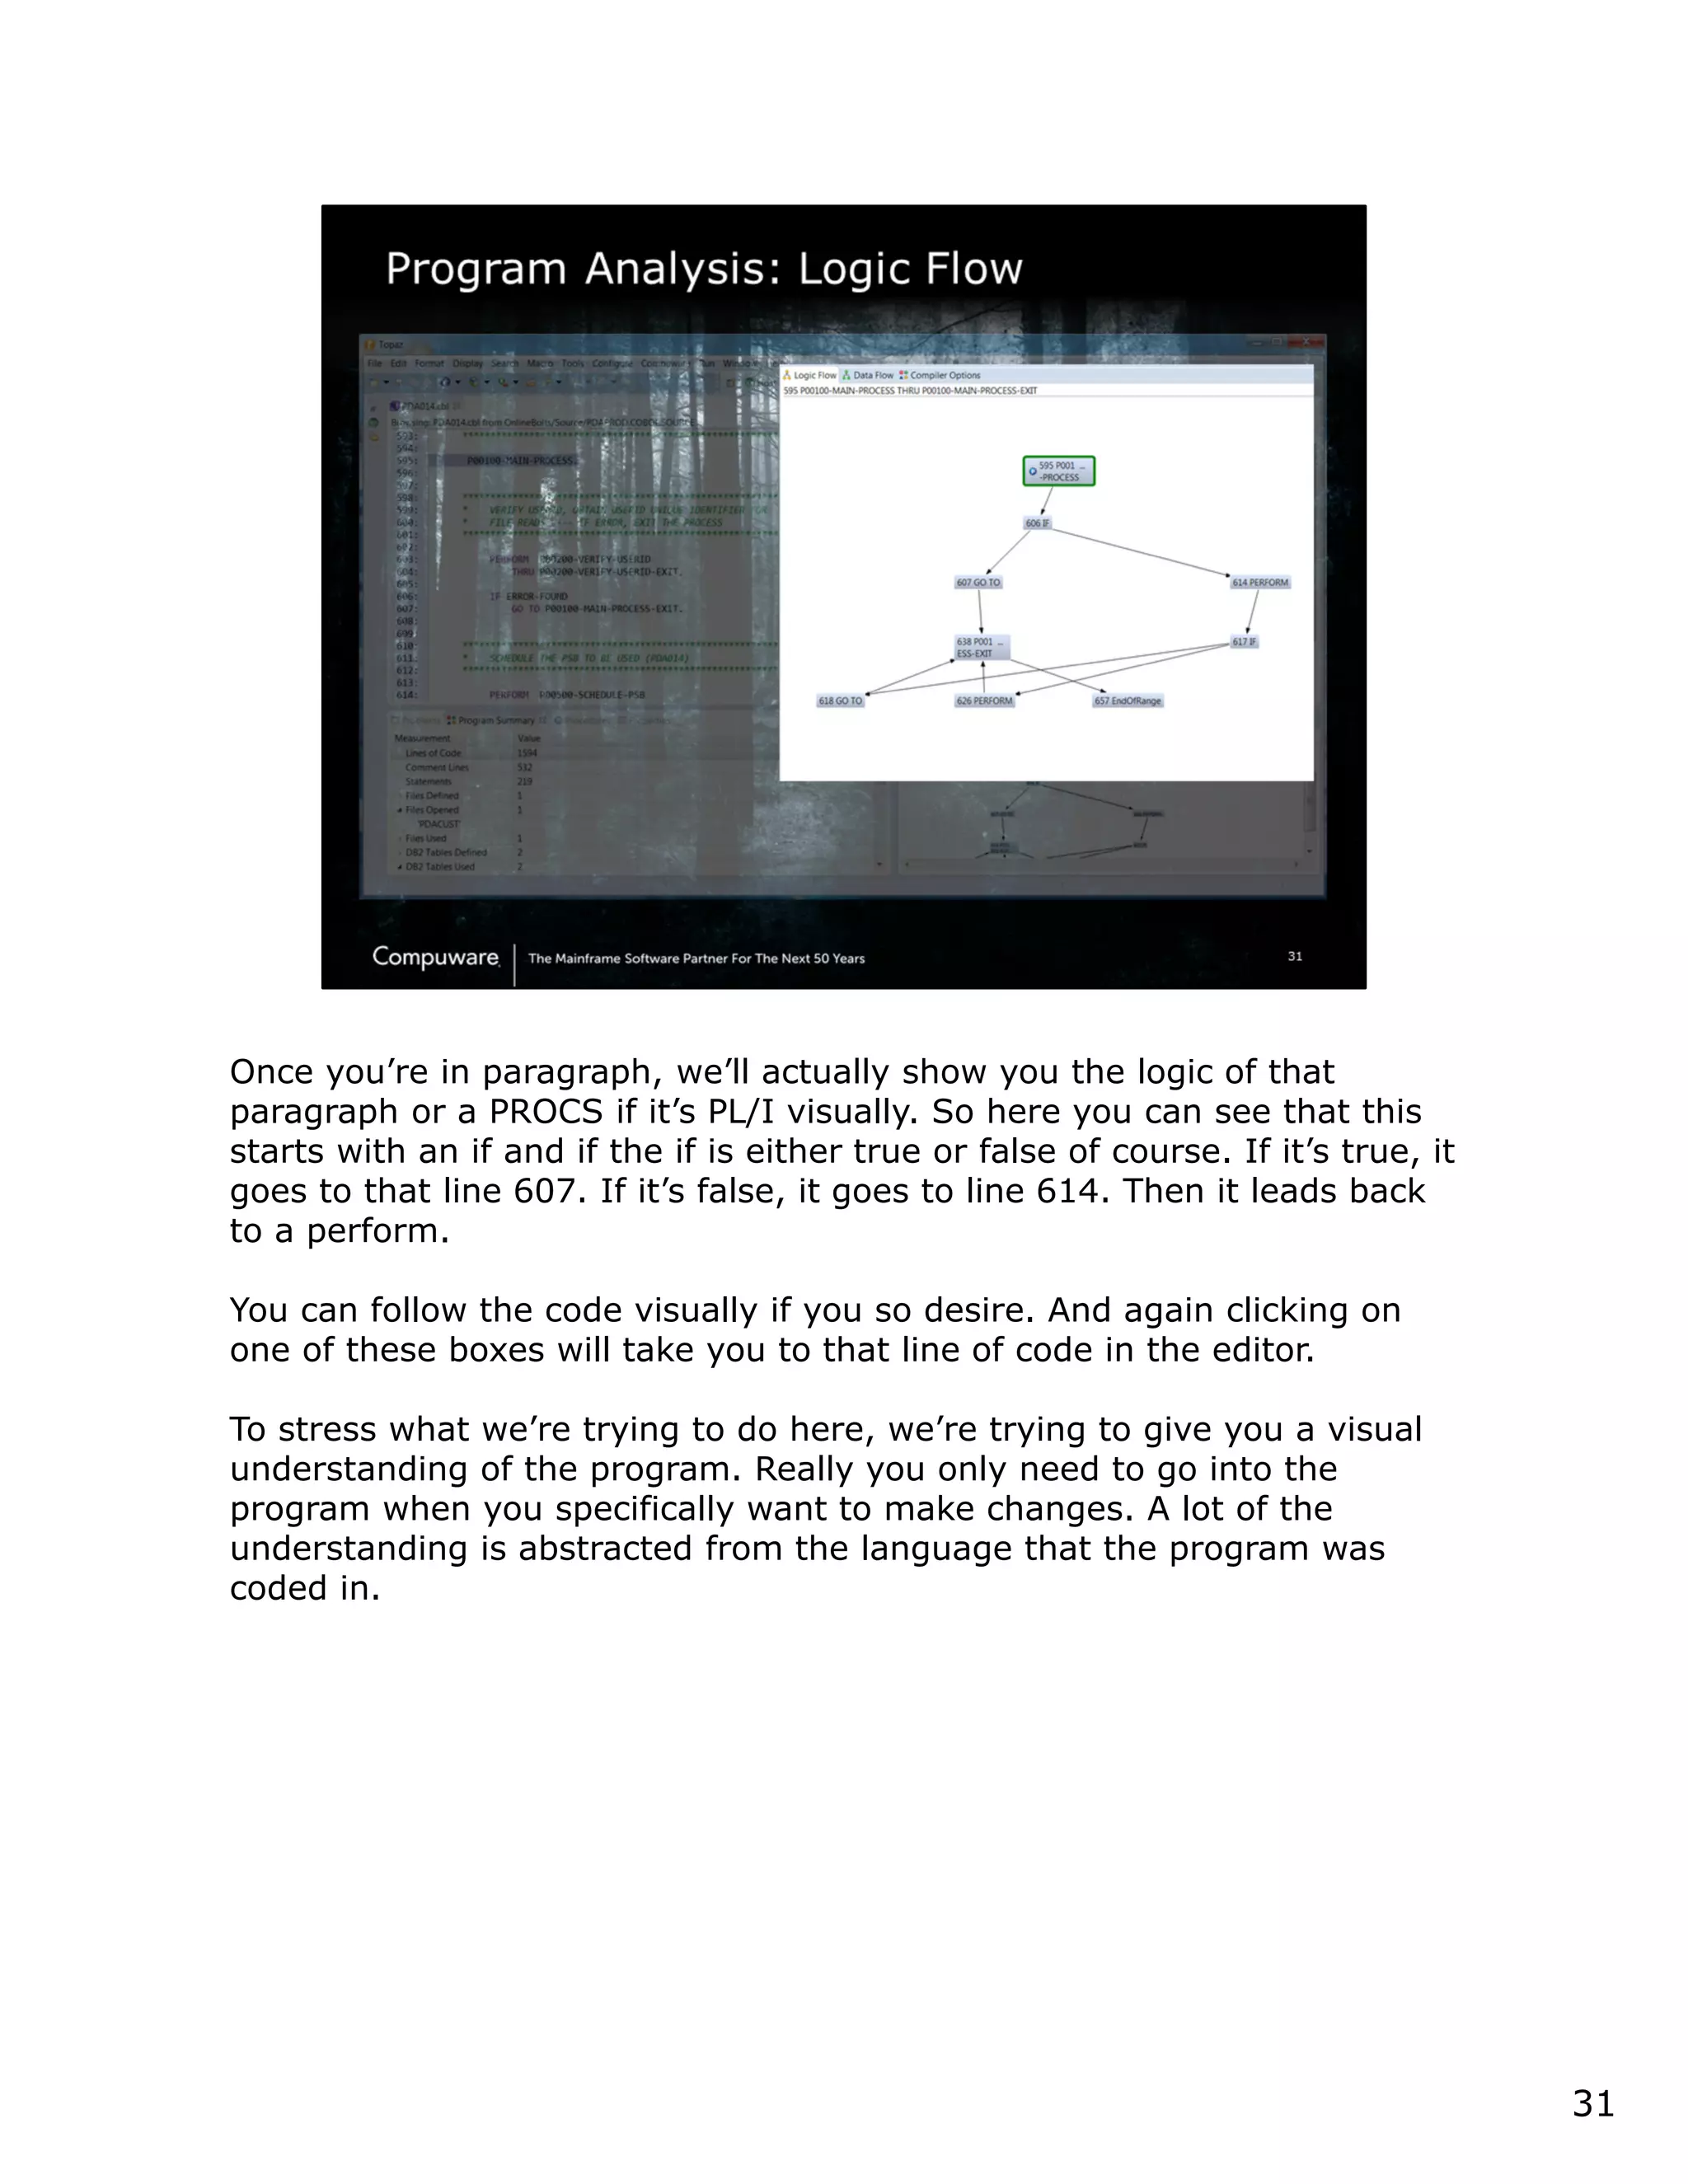
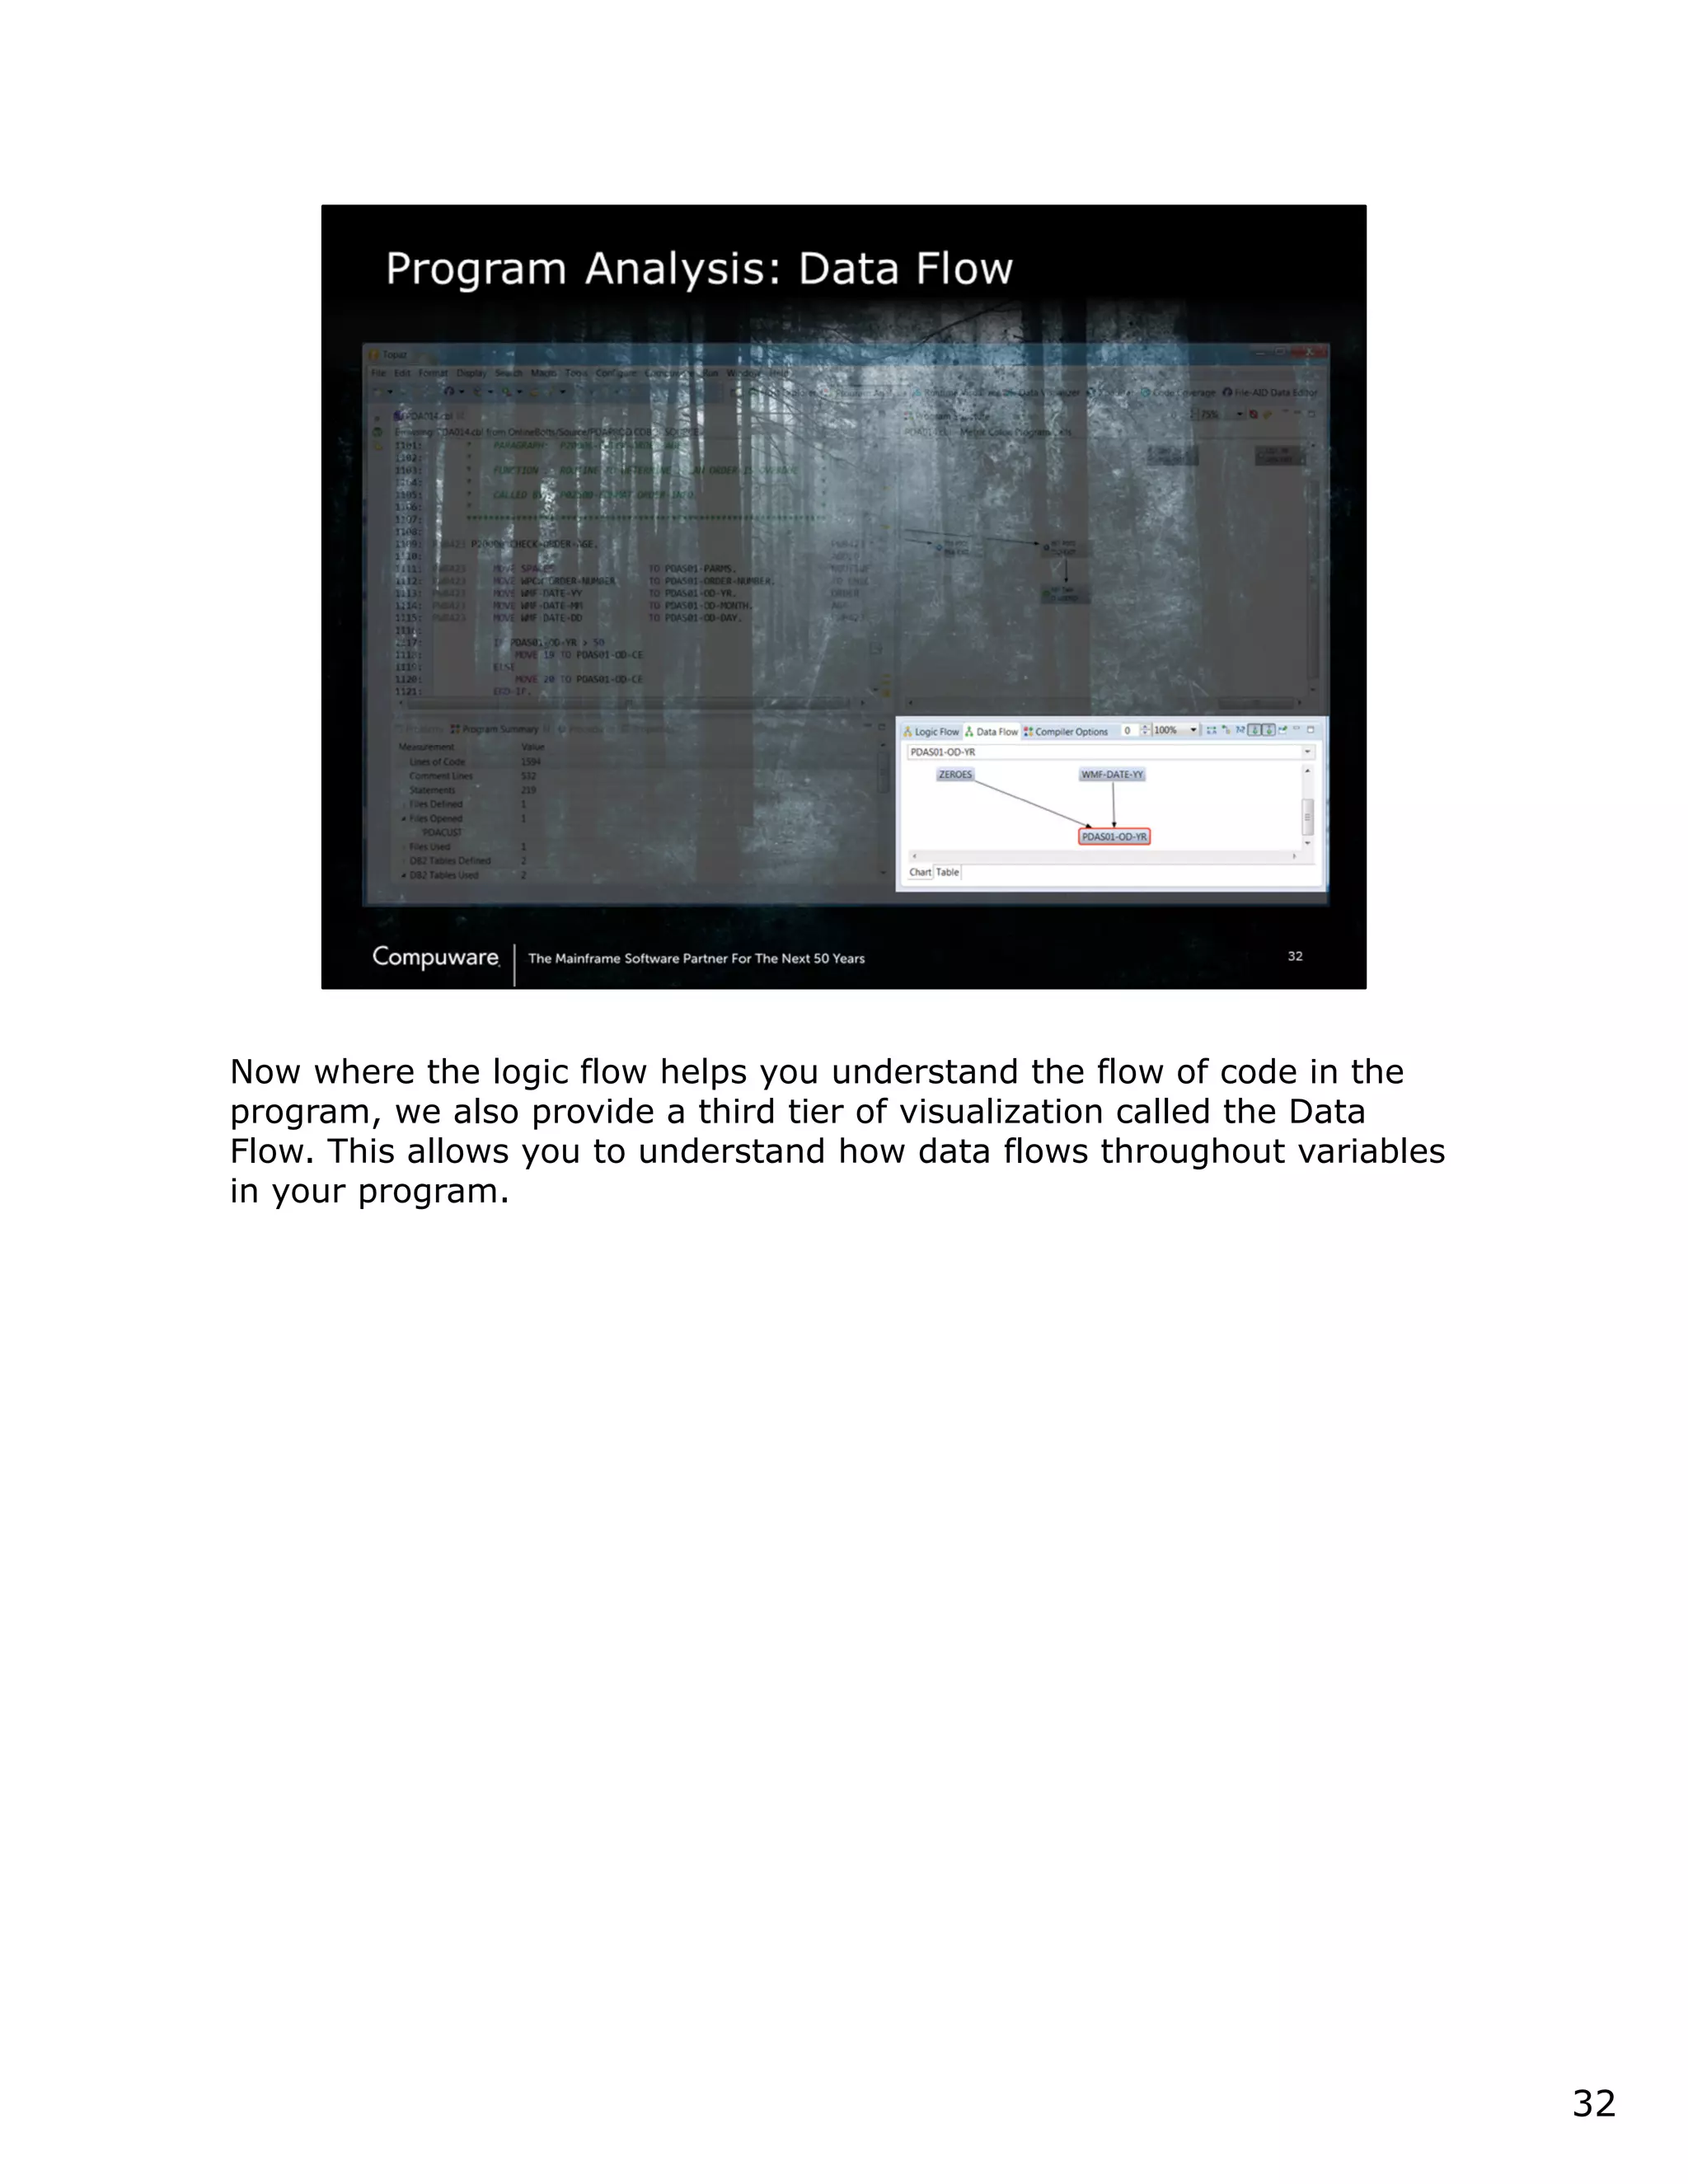
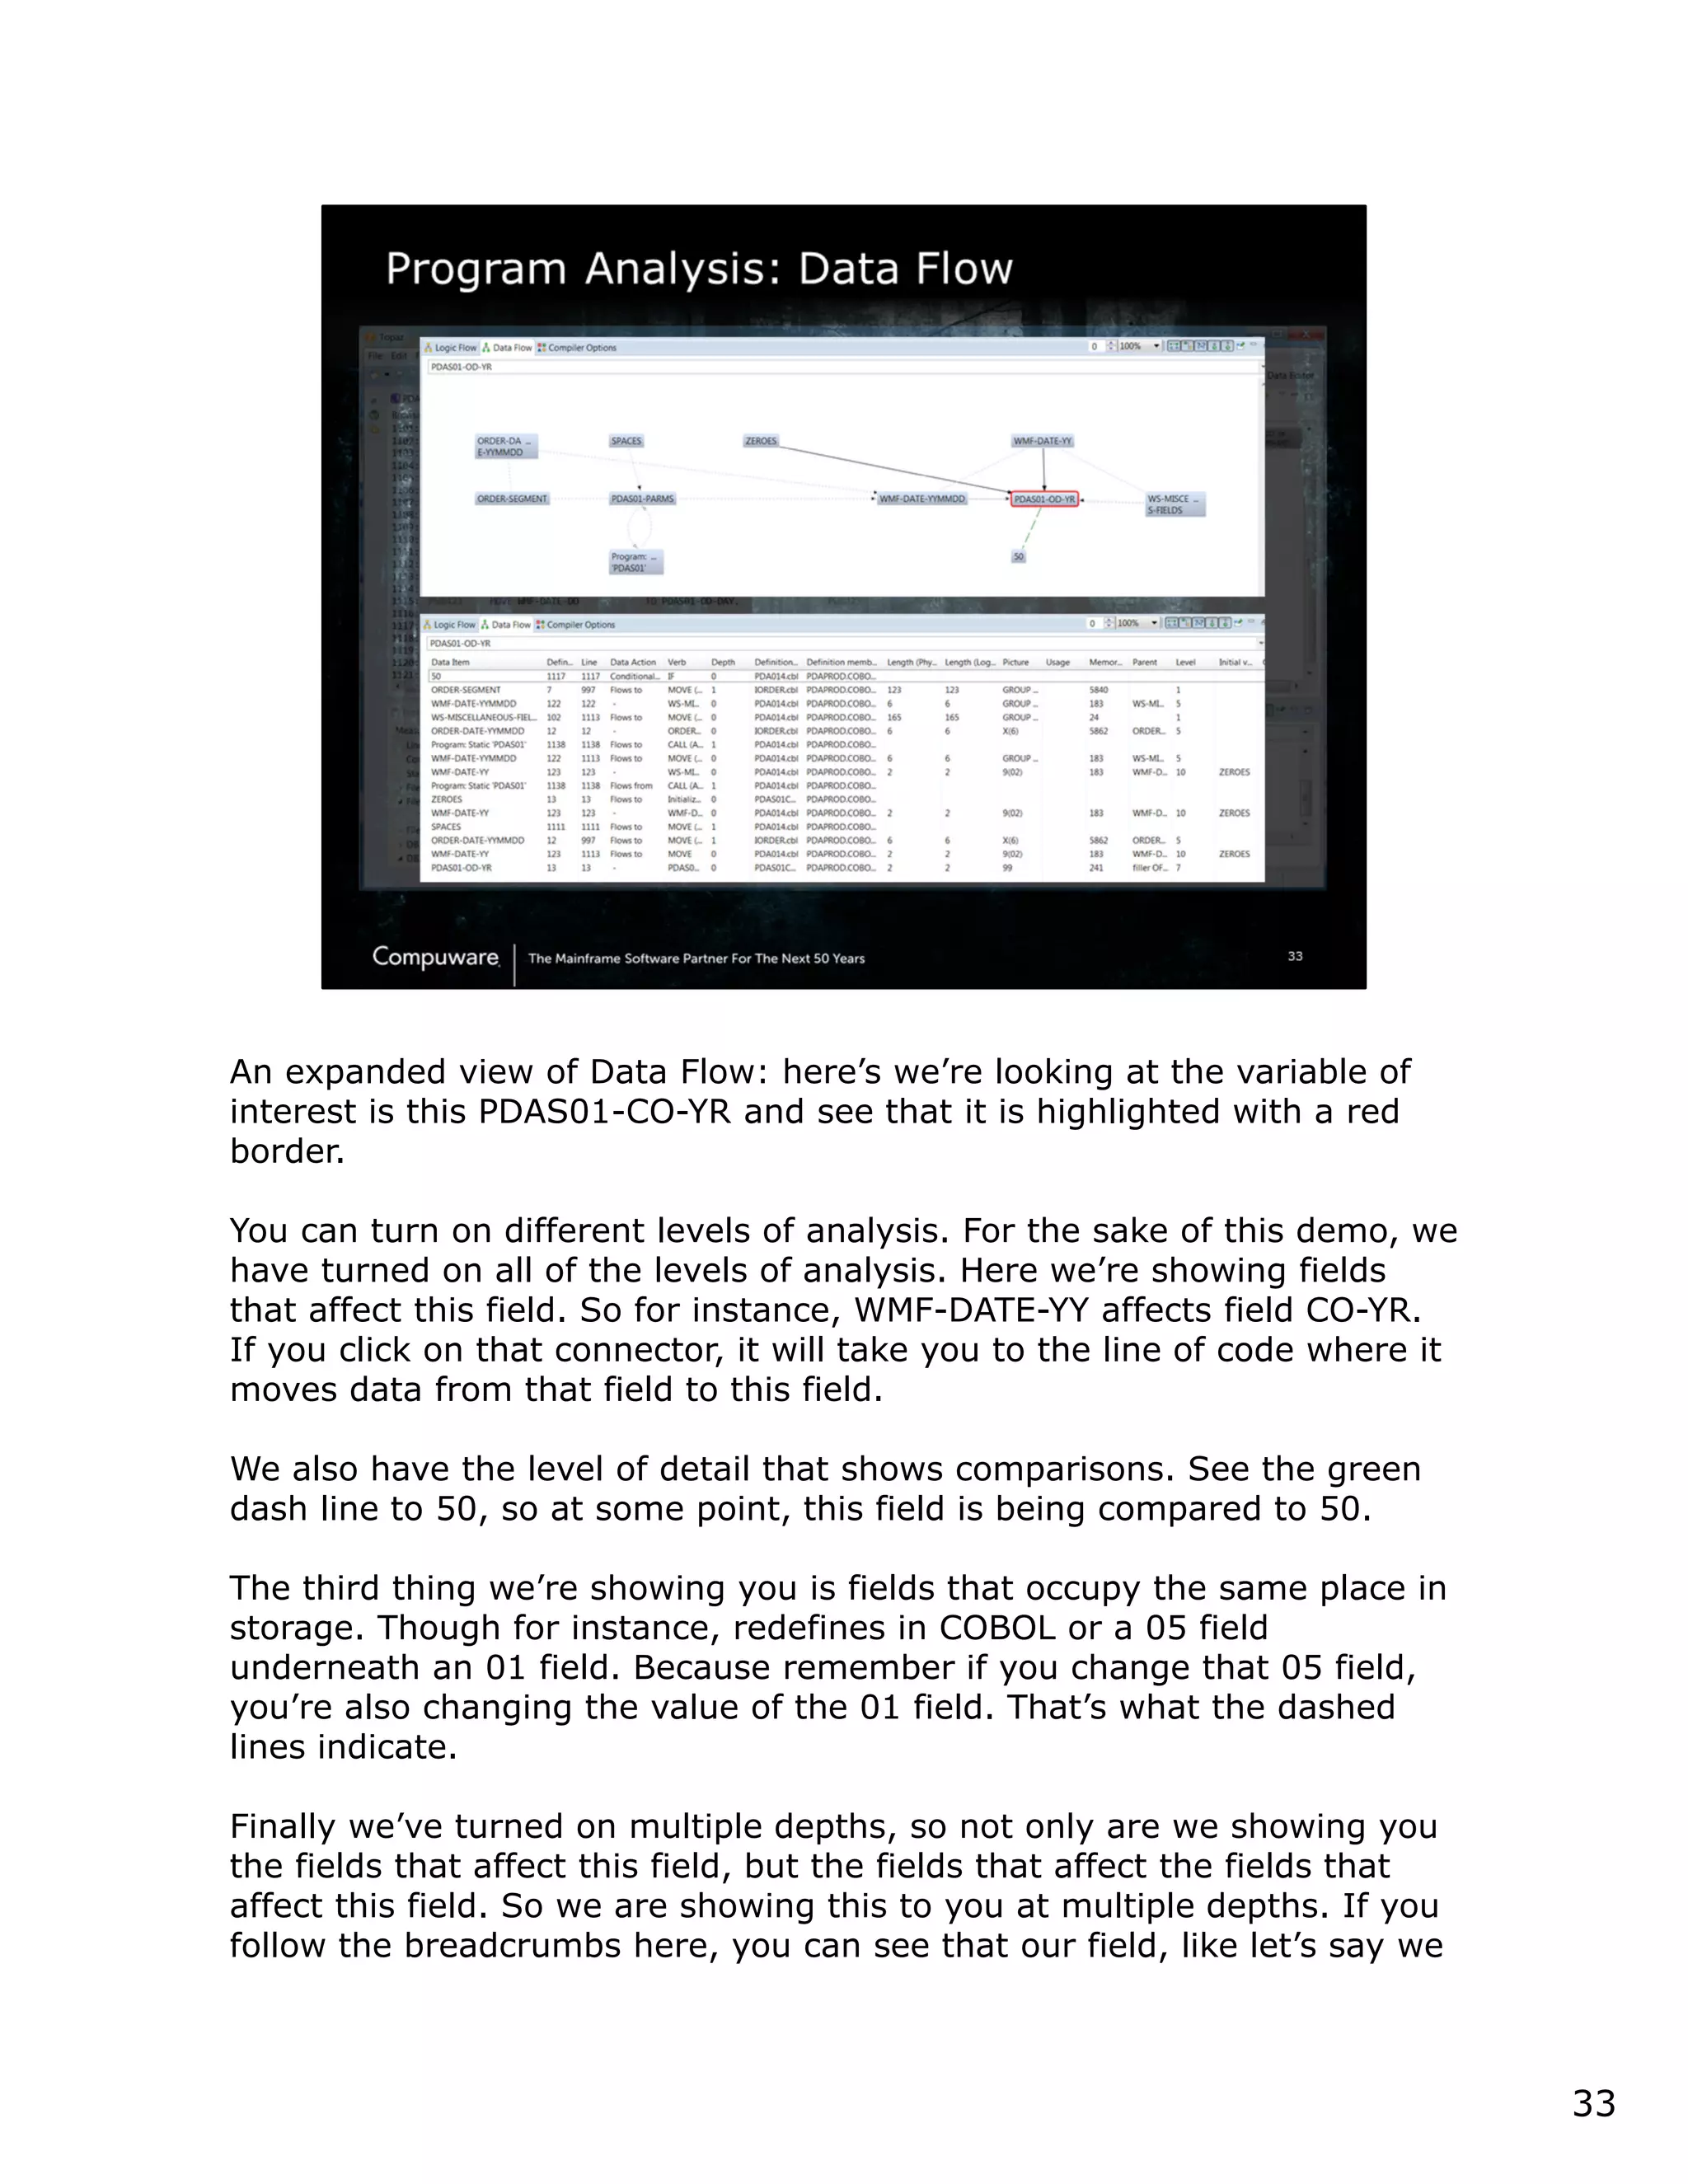
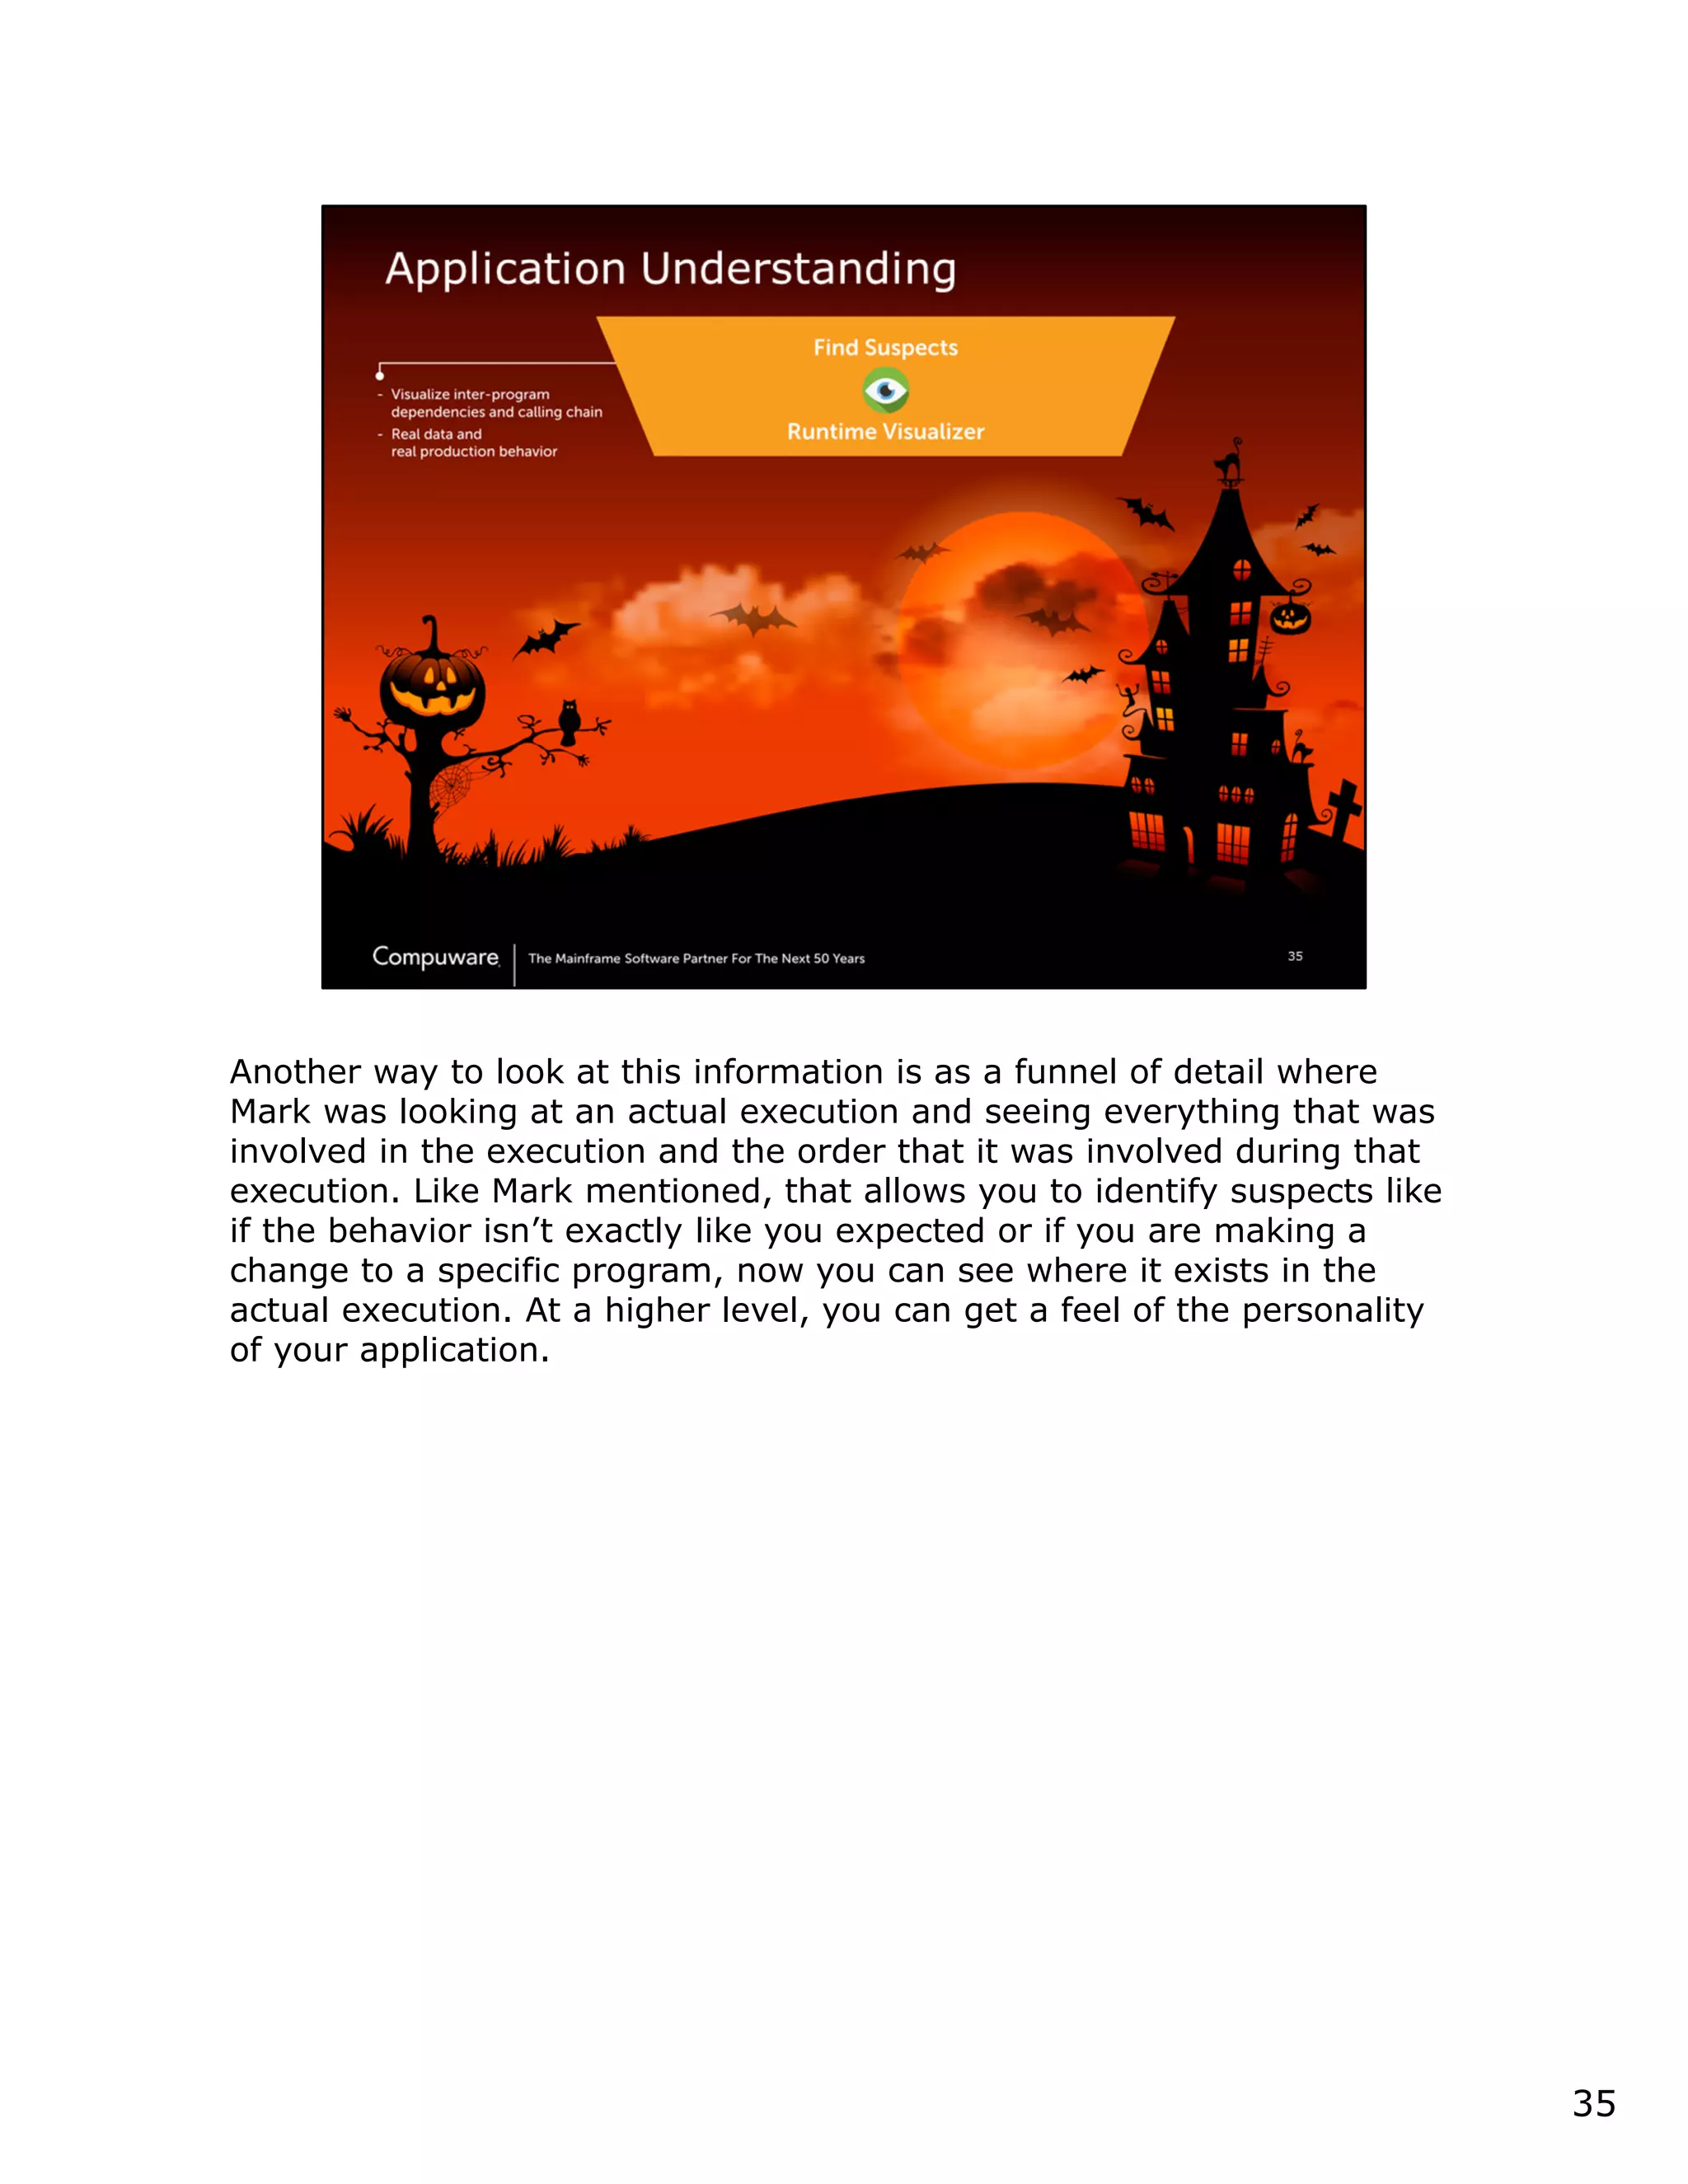
This document discusses a runtime visualizer tool that allows users to visually see how their code executes. It can dive deeper into code to help with debugging. The tool also enables online projects to connect mainframe source code logically, and provides impact analysis, program analysis and application understanding capabilities. These include seeing what programs call or are called by a given program, a program's structure and logic flow, and data flow. The document encourages that these tools can help overcome challenges in understanding unknown or complex codebases.
22. 22
WAIT … THERE’S MORE
What if you could dive
deeper into your code?
23. 2323
Online Projects
Ability to create Mainframe Online Projects
• Logically connected source – programmer’s discretion
• Source still resides on mainframe
• Opens up COBOL to project capabilities
• Brings COBOL and Java development one step closer
24. 2424
Impact Analysis
Hierarchy View
• For a given program – what programs call it
• For a given program – what programs it calls
• For a given program – what copybooks it includes
• For a given copybook – what programs include it
• Double click entry to edit
I just want to mention for the sake of the recording and people that will watch the replay in the future that this was recorded on October 29 and that explains the subtle Halloween theme that goes throughout the slides.
What we’d like to start with is listing three worries that often keep programmers up at night.
Where do you start when you don’t know where to start? We’ve often heard how writers fear the blank page. Well every programming task starts out as a blank page as well. And it can actually be worse because in mainframe development, often development tasks are built upon existing code. So not only does a task begin as a blank page, but it also begins as a black box. And often you can hit a case where you get that paralysis by analysis where you’re just not sure where to start and you don’t have enough information to be confident where you start and so you delay the start which of course has repercussions on when you finish.
And what we’re going to do in this presentation is show you how Topaz can help you eliminate this worry.
How do you know what you don’t know? Ok, so we’re now well underway on our programming tasks and often times, we’re moving smoothly, but there’s always a nagging thought in the back of your head that you are forgetting something. And I equate this to that recurring nightmare people have in high school where they show up for a class and suddenly it’s an exam that they haven’t studied for.
And this can have repercussions as well as things are going smoothly and you think you’re ahead of schedule, and almost anyone who has programming experience has experienced this, when suddenly somebody mentions something and you realize that you hadn’t taken a huge factor into account and where you originally thought you were well ahead of schedule, it turns out you’re well behind schedule.
Again, we’re going to take a look at how Topaz can help give you the confidence that you’re covering all the bases as you do your development.
And finally, the third worry: how do you fix something without breaking something else? And again the first worry was really “how do we get started.” The second one is “while we’re in progress, how can we be confident that we’re covering all the facets.”
Now this third one that often comes into play just as you move your changes into production. You’re confident that your changes address your specific assignment, but the big X factor is does it introduce something else much worse. The fear of unintended consequences.
Really the worst case scenario is you fix your specific assignment, but you introduce a much worse problem.
Again what we’re asking you here is keep in mind these three worries as we go through Topaz for Program Analysis and hopefully you’ll see parts of the capabilities within the product that will allow you to cross these worries off your list.
To begin that process, I’m going to hand it over to Mark and he’s going to show us a demo of the Runtime Visualizer.
Thanks Jim. I’m going to start off with something that, you know, Jim talked about all these fears, this might the nightmare scenario where you’re assigned to work on a program and you’ve never seen it before, and you know that it’s very complex. Everybody’s really afraid of it because it calls something else which calls something else. And there’s DB2 calls and you really don’t know where to start. You don’t really know anything about it. What you need is some basic information as to how this thing is all put together and how it kind of flows.
So what I’m going to do is submit this job using the Topaz for Program Analysis Runtime Visualizer. So it’s just running the job, I don’t have to worry about having the source available.
I just submit it and sit back and it comes up here in Topaz and I can actually watch it being built.
So I can see the main program there clearly and it’s calling other programs. As other programs are called, they are charted automatically.
I can also see that it is calling DB2, so I know that is involved. If it called IMS or there were files, I would also see those.
Again, this is running it without it having to have any source. Very easy set up, I just basically submit it for batch or I can go in and do online ones as well. And the information, not only do you have the chart, below I can actually see every call being made. So I can see that one program calls another program. I have a timestamp for it. The type of call. The library that it is in. The language that it is. And also the offset within a program where it’s called.
Really helps me understand what’s involved and also having the libraries so I know that I’ve got the right versions, especially if I’m setting up a test. Did I pull the test version or did I pull the production version?
I’m going to stop this replay right now and show you how you can go in and bring these in. Because all these things can be saved. So like this picture up at the top, I can export it and I can make it into a JPG on PNG. I can put it off into Visio or I can make a PDF of it. So if you have it as a Visio, you can go in and combine and work with it to produce your own charts.
Down below, I have all the individual events. That can be exported as a CSV file. So once I have that, I can put it into something like Excel and do my own analysis on it. Or what I can show you now, is I’m going to get out of here and bring it back in.
I can replay it at any time I want.
So I found where I saved that CSV. I bring it in. And this time I’m going to bring in the whole thing.
And this one had 50,000 different events, so 50,000 different calls. So it was quite a big complex run. And I brought that all in.
The advantage of that is that I can run this and watch it and if I find something that is interesting or I want to show it to someone else, I don’t have to re-run the job, it’s saved. And then the other thing that is very helpful is that I can go in and run it one way, because this is again, runtime. It isn’t a static analysis; it’s dynamic. And I can have one set of inputs or data. And once I run it one way, I can say: ok it calls all these if I’m adding an order. But if I alter an order or change an order, it’s a different path. I can go and record those different paths. Save those as different files and bring those in.
And that way if someone is new to it, they don’t have to run it again. You can just go and pull that one up say: ok,
this is how we process this one type. And once it’s in, I can step forwards, run it through and run it backwards and see how it goes through.
Anytime I click on one of these, I can see information on it. So I can see the library and the language, that it’s a program, the offsets that it calls.
Another interesting thing is the counts and I found some interesting things in here. If you look down across the bottom, there are several of these that are calling it 500 times. They are going after DB2. Several different programs. So that leads me to believe that it is a suspicion. Are they all going after the same thing? Should those modules really be combined into one so that they’re all doing the same thing? Or should they really be separate? Something I want to investigate.
What I would probably do, the next time I ran it, set a breakpoint for those in Xpediter or, more likely, bring it into Topaz for Program Analysis so I can get a deep dive look at it.
Also want to look for big counts. I have a lot of these that have counts of three, calling one or two. Those might just be setting up things. But when I get to something like this one that is 6,312 times that this program C001P032 is calling DB2. That draws my attention.
And if I look across, I also see there is another one that does 7,000 calls.
Those are really doing a lot of work in DB2 so I might wonder if those are modules that just do DB2 calls. I just pass them something and they call. Or is there real processing there?
So really what I’m using this for is to identify suspects. I might have 30-40 programs here. I can’t look at them all; I don’t want to look at them all. But what I now have done is narrow it down to those two programs. I want to take a quick look at those through Topaz for Program Analysis and see if they just do calls or is there processing there. If they are just doing calls, I’ll go back up the chain in here and find the programs that call them. I’ll also want to separately look at those doing the same number of calls and see what’s going on there.
I’ve gained a lot of valuable information here. I’ve cut through these programs so I now know the ones that I’m interested in. And it’s runtime, it’s a real run, easy set up. There’s really nothing to it and you don’t need the source.
I’m going to show you another thing here. And that’s what we call Differential Analysis. When I was discussing this with a customer, they brought this up as how they would really use this. And I mentioned that I could record one run and then I could record it maybe with different data another run. And then I could go look through it. And what they brought up was that I could just compare the files.
Topaz has built into this a file difference tool. So I brought in both versions of this CSV file where I ran it one way and ran another way. The differences are point in one area here where I’m calling a program C001P027 but in this other version I’m calling a different program P030. So it’s a differential analysis and I think where that would really be helpful is not only in trying to understand the differences between updating an order or deleting and order, for those type of processes, to really see what programs are involved in the differences, but also for production turnover time. It’s another check to make sure your changes did as expected. So you might put your changes in, you’d have one run before and you would run one after to compare.
A lot of times you don’t want any difference in the calling. So you would just make sure they were the same. Other times what you were doing would call new programs and do different processing, so you’d want to make sure those were there and record what the differences were. And it could also help you debug something. So something doesn’t seem right, you know exactly what it is, and I know the offsets within the program where it made that call, I can go right back in there.
It’s providing focus. It’s providing those suspects when you are trying to understand this scary, scary code in the beginning, give you that confidence and it provides the focus so that you can really master this. So it really isn’t that scary. So in this case, something that I’ve never seen before, I was really scared about it; I can run it through and I’m already understanding things in just minutes. I can really start to understand how it is.
Then I’m really ready for the next step which is more the deep dive. So for that, I’m going to turn it over to Jim.
Thanks Mark. And I think you can see why we at Compuware are so excited about Topaz for Program Analysis. Not only does it bring some powerful capabilities to the developer, but I think it also has an undeniable cool factor to it as well.
Now what I’d like to talk about is take that information that you’ve accumulated from Runtime Visualizer, and now there are more parts of Topaz for Program Analysis that can assist you through the development lifecycle.
The first thing is Mainframe Online Projects. One of the objectives of Topaz is to make the programming experience of the COBOL programmer very similar to the programming experience of the Java programmer. It’s built on Eclipse, which is the kind of de-facto IDE for Java development and so we wanted to take all of the good parts of the Java development process and introduce for the COBOL developer process. And really where things different is where the pencil meets the paper; where you actually go in to make code changes and either you’re coding in COBOL or you’re coding in Java or you’re coding in PL/I. That’s where the actual differences are and try to keep it as consistent as possible in all of the processes.
And one thing we noticed with Java developers is that they do all of their work out of projects. So they have a project and really they’re day-to-day workflow just exists in that project. And we wanted to create that same scenario for the mainframe. However, there are idiosyncrasies between the two that typically are that Java project that Java developer has that code existing in their workspace. So they have that code it’s very often local to their machine. Where mainframe developers really want their source to continue to live on the mainframe. That’s where their SEM tool is and that’s where they do their check-ins and check-outs and they really want that code to exist in one place.
So we introduced the concept of mainframe online projects to bring the power of projects to the mainframe developer, but still fit into their preferred environment.
If you look behind the callout, you can see that we’ve selected a bunch of files, some of them out of the dataset PDAPROD.COBOL.SOURCE. And then one out of a different dataset. We did a right click and we add those files to the project. At that point, we have the ability to tell the product that we want to create a mainframe online project.
So what is an online project? It is a logical collection of source that means something to you as a specific programmer. Right, the most obvious use case might be if you take Mark’s Runtime Visualizer example, you might grab all those programs that were called in that execution and create that as your Online Project. Or you might take a subset of those programs if you are only interested in a subset of that application. Or you might actually take all of the programs from an entire application. It’s really what makes sense to you as the programmer.
The second thing is, and you can notice this if you look closely at what’s happening behind the screen, you can actually add multiple versions of a program. So here you might add the production version of the program to your project and then also a version that you are going to change.
Moving forward, as you use the analysis feature of online projects, now you can see if your changed version is showing up on lists that the production version isn’t. And that gives you an indicator of the changes you made. Here we’re going to talk about one thing you can do with Online Projects and this is often referred to as Impact Analysis.
This is very analogous to what you can do with Java. So with Java, you have a project full of methods and classes and you can right click to bring up the hierarchy view to give you information on them. And now you can do the same thing with the mainframe online projects. You can right click on a program, you can right click on a copybook and ask for the hierarchy view to give you information.
This hones in on four specific capabilities: 1. For a given program, what programs call it? 2. For a given program, what programs does it call? Again if you look behind the callouts you can see we’re looking at program PDA10 and we’re currently showing the programs that it calls. And if you highlight one of those programs, it will actually show you the line of code where it does the call. If you double click on the program, it will bring it up in the editor at that line of code.
Another thing you can do is for a given program, see what copybooks it includes? And finally for a given copybook, what programs include it?
Again, what we’re trying to do is fill in those unknowns so as you begin to make changes, you can understand the impact your specific change maybe on a specific program or a specific copybook might impact the rest of the application.
And of course a really straightforward use case here is you’ve been charged with the task of enlarging one field in a copybook. And now what you can do is just get a list of the programs that include that copybook and that list kind of turns into your To Do list and you can just march down those programs and evaluate whether your change is going to have an impact on those programs.
The next think you can do is, so now we understand kind of a larger view of your change. Now let’s focus in on when you are actually editing a specific program to make your specific changes to that program.
Here Topaz for Program Analysis allows you to do another tier of visualization similar to the Runtime Visualizer to provide some information. Now this is static. Where the Runtime Visualizer is dynamic, it’s actually using runtime information, this is static analysis of your existing code.
And here I have a program PDA014 open in the editor. We did a right click and we selected “Perform Program Analysis.”
This opens up several more views that provide information and what I’m just going to do is kind of go around the perspective and talk a little bit about the new views. The first one is what’s known as the Program Summary.
And here let’s expand it so you can read it a little bit. This gives you a nice summary of the kind of personality of this program. Remember in many cases, this might be a programmer coming in absolutely code to this program. This might be their very first exposure to this program.
So kind of at a glance, we can tell them how large it is; we give them metrics that show how complicated it is; we show them things like this program uses one file and it looks like it uses two DB2 tables. So this is kind of a handshake introduction to this program.
If we continue going around the perspective and looking at other views, the other thing we’ll do is Topaz for Program Analysis will run through the program and build a program structure chart.
Well this is the flow chart of the program expanded to see more detail. So you can see in this case its COBOL so you can see which paragraphs call which paragraphs. If it was PL/I, we could show which PROCS call which PROCS. You’ll notice that there are some paragraphs kind of unattached, floating over on the left and the right. That’s dead code in this program. That’s paragraphs that are never executed in this program.
If you follow the flow down it will lead to if paragraphs call sub-routines. Or if they do I/O, you’ll see that in this flow chart. You’ll notice the colorization. This is currently colorized by what is known as the McCabe Complexity Metrics, and so, the ones that are slightly darker green are more complex. You can control that colorization to isolate paragraphs that do I/O or paragraphs that call other programs. Whatever makes sense to you.
The other thing is that you can now use the structure chart to navigate to the editor. So if you double click on one of these paragraphs, it will take you to that paragraph in the editor. So you can use the visualization to drive the editing.
The second tier of this static visualization is what we call Logic Flow. Let’s expand this one too.
Once you’re in paragraph, we’ll actually show you the logic of that paragraph or a PROCS if it’s PL/I visually. So here you can see that this starts with an if and if the if is either true or false of course. If it’s true, it goes to that line 607. If it’s false, it goes to line 614. Then it leads back to a perform.
You can follow the code visually if you so desire. And again clicking on one of these boxes will take you to that line of code in the editor.
To stress what we’re trying to do here, we’re trying to give you a visual understanding of the program. Really you only need to go into the program when you specifically want to make changes. A lot of the understanding is abstracted from the language that the program was coded in.
Now where the logic flow helps you understand the flow of code in the program, we also provide a third tier of visualization called the Data Flow. This allows you to understand how data flows throughout variables in your program.
An expanded view of Data Flow: here’s we’re looking at the variable of interest is this PDAS01-CO-YR and see that it is highlighted with a red border.
You can turn on different levels of analysis. For the sake of this demo, we have turned on all of the levels of analysis. Here we’re showing fields that affect this field. So for instance, WMF-DATE-YY affects field CO-YR. If you click on that connector, it will take you to the line of code where it moves data from that field to this field.
We also have the level of detail that shows comparisons. See the green dash line to 50, so at some point, this field is being compared to 50.
The third thing we’re showing you is fields that occupy the same place in storage. Though for instance, redefines in COBOL or a 05 field underneath an 01 field. Because remember if you change that 05 field, you’re also changing the value of the 01 field. That’s what the dashed lines indicate.
Finally we’ve turned on multiple depths, so not only are we showing you the fields that affect this field, but the fields that affect the fields that affect this field. So we are showing this to you at multiple depths. If you follow the breadcrumbs here, you can see that our field, like let’s say we were tasked with making a change to the OD-YR field, it would also affect a different field that if you look over to the left actually get passed as a parameter to a program PDAS01. And that field in this case happens to be a stored procedure.
This is what we mean about resolving the issue of unintended consequences where changing this field and when you look at this program, you think: ok, I have all my bases covered. But when you take this broader look, you see you have to take this stored procedure into account here.
If you think back, as programs go into production, if it doesn’t fly, often the bug is very far removed from your specific change. Sometimes it’s even hard to correlate your change to the bug. Here we’re hoping to eliminate that pain whatsoever.
Now some of these charts can get pretty complex as you might expect, so we also provide the same information in a table. Again, I like to think of this as almost like a To Do list that you could, if you’re really worried about this field, you could just march down each of those occurrences in the table and double clicking on it will take you to the reference in the code. You can satisfy in your mind that you’ve addressed that change.
Mark walked you through the dynamic capabilities of Runtime Visualizer, and I’ve marched you through the static capabilities of Topaz for Program Analysis. Hopefully if you are thinking back to those three worries that we started with, suddenly they don’t seem that big.
Another way to look at this information is as a funnel of detail where Mark was looking at an actual execution and seeing everything that was involved in the execution and the order that it was involved during that execution. Like Mark mentioned, that allows you to identify suspects like if the behavior isn’t exactly like you expected or if you are making a change to a specific program, now you can see where it exists in the actual execution. At a higher level, you can get a feel of the personality of your application.
Then I suggested creating an Online Project which now we’re beginning to close in on the details of our changes. Again, an Online Project might be all of the programs involved in the visualizer; or it might be all of the programs exposed by the visualizer and even more programs; or it might be a subset. It’s totally up to you, but given that list of programs, it allows you to identify dependencies across those programs so you can begin to understand as you make your change what impact it will have on the larger picture.
Finally, we’re honing down to the utmost level of detail where you are making specific changes to a specific program. Here we will maximize the information at your disposal just by opening the program up in the editor and performing program analysis. We’ll give you visual clues and you can use the visual capabilities tab to actually edit the program.
That is really Topaz for Program Analysis as it exists today. I’ll hand it back to Mark for questions.
We’ve got several questions here and I’m going to try to group them as much as I can in the order in which they were presented.
We had a couple come in about the Runtime Visualizer, so I’ll handle those right now.
Q: How do we configure this tool?
A: I didn’t show that, but it is in Topaz, you would go in through Xpediter Eclipse. So you do have, and that’s another question we had here, what products are required, you have to have Topaz for Program Analysis and you have to have Xpediter for that environment. So TSO for Batch, CICS for CICS Online or IMS for IMS Online. You have to have current 9-4 release with October maintenance because that’s when it came out.
You would go into Xpediter Eclipse, set up your test as normal, again you don’t have to have source for those programs. We’ll get them anyway. There’s just one tab in there for Runtime Visualizer and you go in there and check that tab, that you want that on. Go in there and set up your profile, click Runtime Visualizer, submit it and you’ll come to that perspective. You’ll see it start to build the chart.
Q: Is this tracing an application vs. sampling an application, more like Strobe?
A: Interesting question. You’re interested in how this thing really works. I kind of got to it there. We’re using Xpediter technology, so we’re not really sampling like Strobe. We’re not going out there because if we did sampling, we would miss things. If you popped in every once in a while and tried to get something, you would miss a call. We looked at that. We’re actually more involved with it with Xpediter, but really minimal overhead. Obviously, you’re going to have some, but we’re not in there examining every instruction. We’re not duplicating the work. Very low overhead. We’re waiting for events to happen like a call, and then we’re invoked. So we’re involved in that way. We’re not doing sampling.
Q: Is Topaz running on the mainframe or distributed platform?
A: Kind of both. Topaz is built on Eclipse, so it’s distributed there, but as you can see it’s interacting with a lot things on the mainframe. It interacts with File-AID, Xpediter, some other products.
Q: Online Projects: Is this only for Online Projects? Projects in Endeavor?
A: Ok, is this only for Online Projects? That’s a good question because I kind of skipped over that fact. As I segwayed between Online Projects and Program Analysis, the part that shows you the structure chart and the data flow and logic flow, those two are actually independent of each other. If you open up a program via Online Projects, you have access to Program Analysis. If you just open up a program outside of online projects, you can still do Program Analysis. For those of you familiar with Topaz, for instance if you go into Host Explorer and navigate to a dataset, and then let’s say it’s a PDS and you navigate to a member in that PDS and double click it to edit it, you can still do Program Analysis with that program. It doesn’t have to exist in the project.
The capability that the project gives you is those hierarchy views that show you the dependencies across programs.
The second one is about an Endeavor integration, and again to answer this at the high level, Topaz provides a degree of Endeavor integration.
The specific question was do products have Endeavor integration, and the answer is yes, you can include programs out of Endeavor into a project.
Q: Does Topaz interact with DevEnterprise, Metadata Analyzer, Program Analyzer, Code Coverage? Someone uses Program Analyzer, Metadata Analyzer for Impact Analysis by administrator. Do you need one?
A: They are separate, so what we showed you with Topaz for Program Analysis is a separate tool. What’s different is that it is actually with source you can edit, that you brought in there, and you are working through an edit session. You could make a chance, save it and re-analyze it. It’s a different thing.
No, you don’t need an administrator. Where the Metadata Analyzer analyzes thousands, tens of thousands of programs, you need an administrator to set that up. With this, we designed it more for the individual developer, so there is no administrator. They can work on their programs themselves. A lot simpler to work with.
Q: We do have some questions on Code Coverage.
A: There is a Xpediter Code Coverage product and in the Topaz Workbench, there is a part for Code Coverage so you can see the Code Coverage display in there.
Q: We’ve got a question here. Do we identify potential looping scenarios?
A: In Topaz for Program Analysis, we go through and do a lot of identification of code flaws. We can find recursive calls in there. We have a specific diagnostic for that. If a paragraph is calling itself, we can find those. It’s interesting in looking at customer portfolios, every once in a while I do find one. It’s a latent loop that they obviously haven’t hit, but we do try to look for looping scenarios.
Q: Will this product analyze both Batch and CICS programs?
A: Across the board, everything we talked about today works for Batch, CICS and Online.
Q: Question on languages.
A: The Runtime Visualizer will do COBOL, PL/I, Assembler and some C, but if Program Analysis is just COBOL and PL/I.