Download to read offline
![DOLAP@EDBT/ICDT 2023
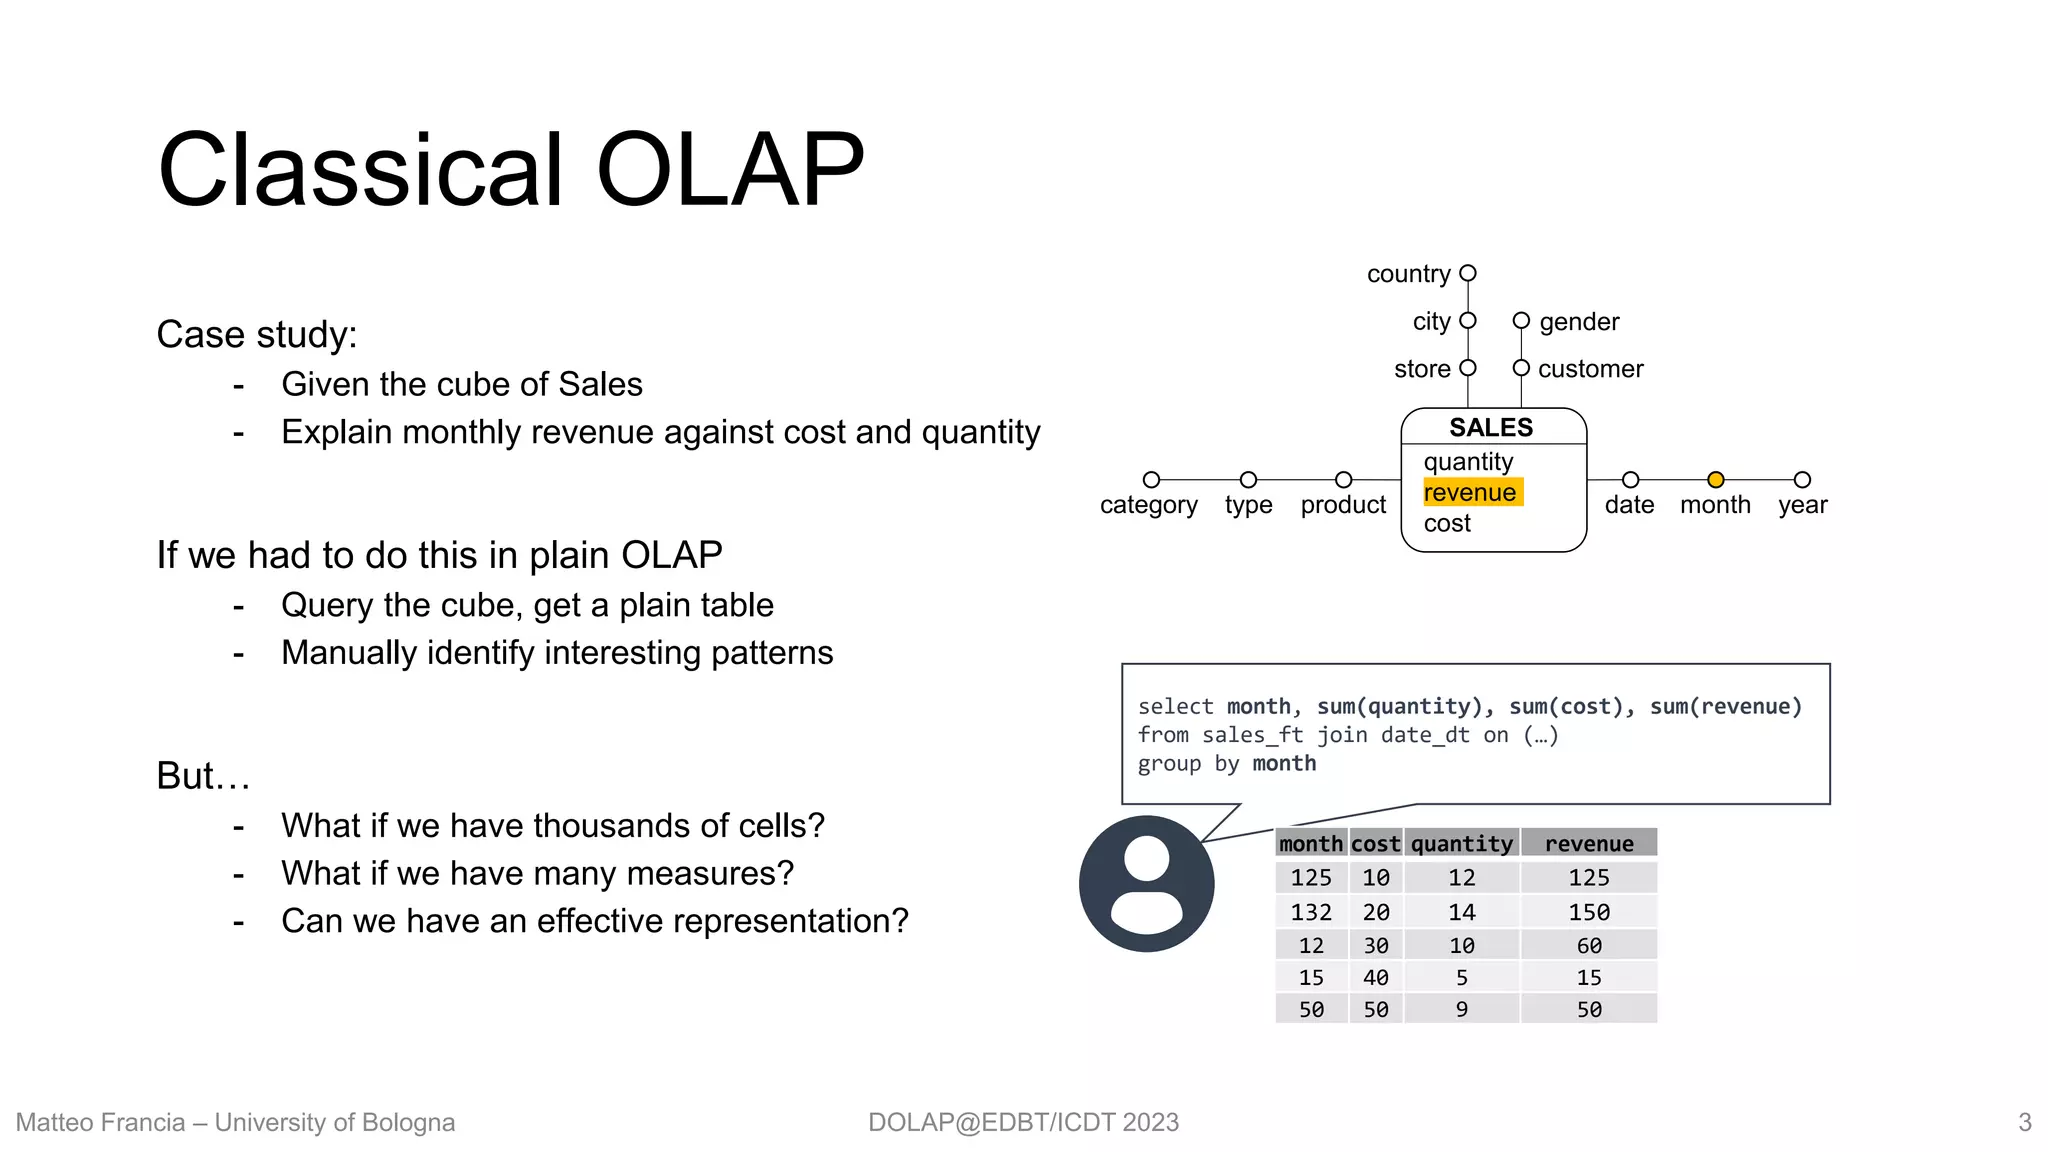
Intentional Analytics Model
Context: Intentional Analytics Model (IAM) [1]
- Facilitate OLAP analysis of multidimensional cubes
- Escape from query answers as plain tables
Express high-level intentions, not queries
- Describe, Assess, Explain, etc.
Get cubes enhanced with insights
- Apply (mining/ML) models to data
- Return interesting insights
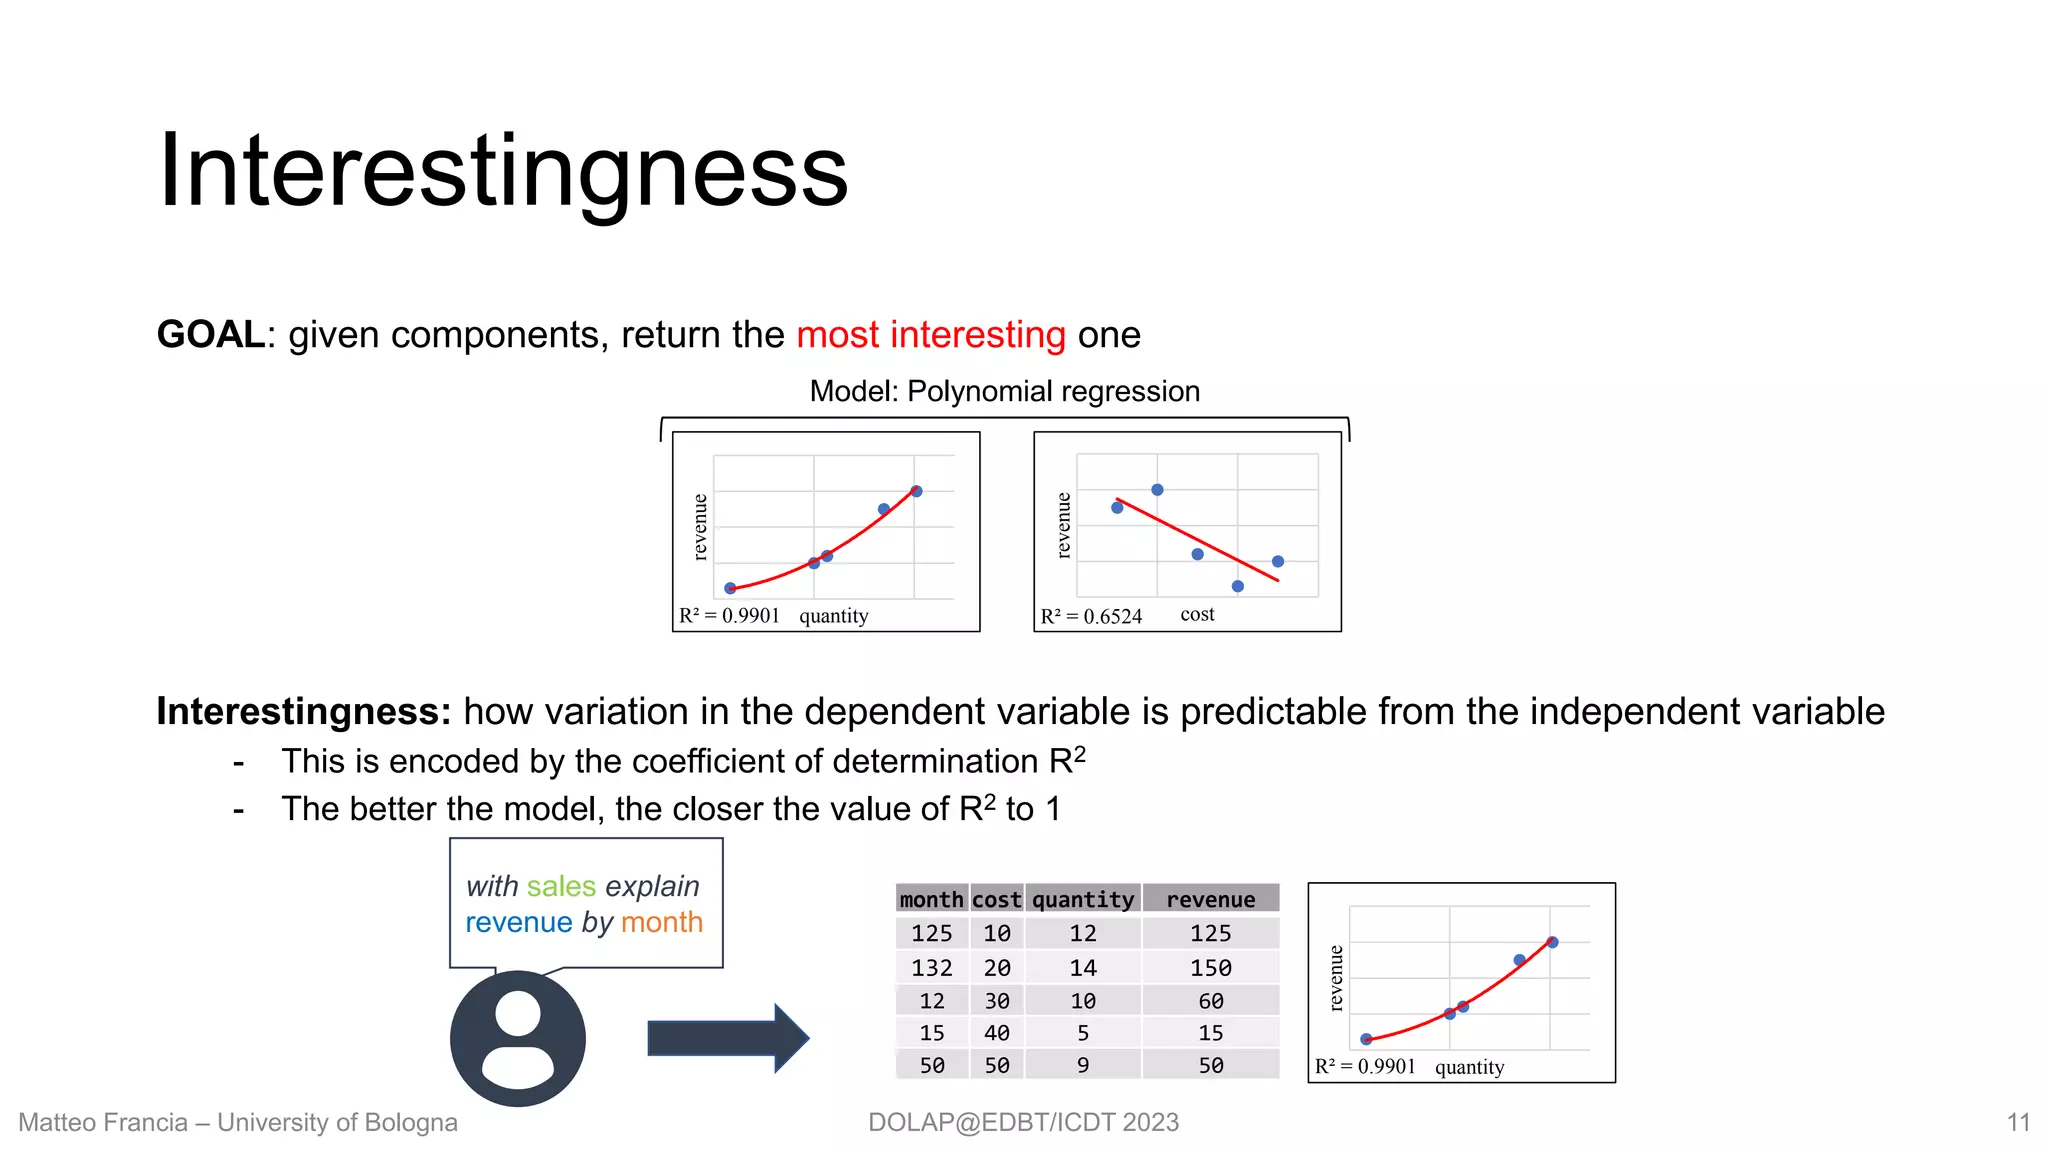
Explain: finding interesting relationships in cube facts
- Data exploration: automatically extracts meaningful relationships from facts
- Validating user’s belief: check if known relationships hold
- In agriculture, the quantity of potassium is correlated with the quality of Kiwifruits.
Do facts confirm this belief?
Matteo Francia – University of Bologna 2
[1] Panos Vassiliadis, Patrick Marcel, Stefano Rizzi: Beyond roll-up's and drill-down's:
An intentional analytics model to reinvent OLAP. Inf. Syst. 85: 68-91 (2019)](https://image.slidesharecdn.com/slides-230328124515-687c8704/75/DOLAP2023-The-Whys-and-Wherefores-of-Cubes-2-2048.jpg)
![DOLAP@EDBT/ICDT 2023
Intentional OLAP: Explain
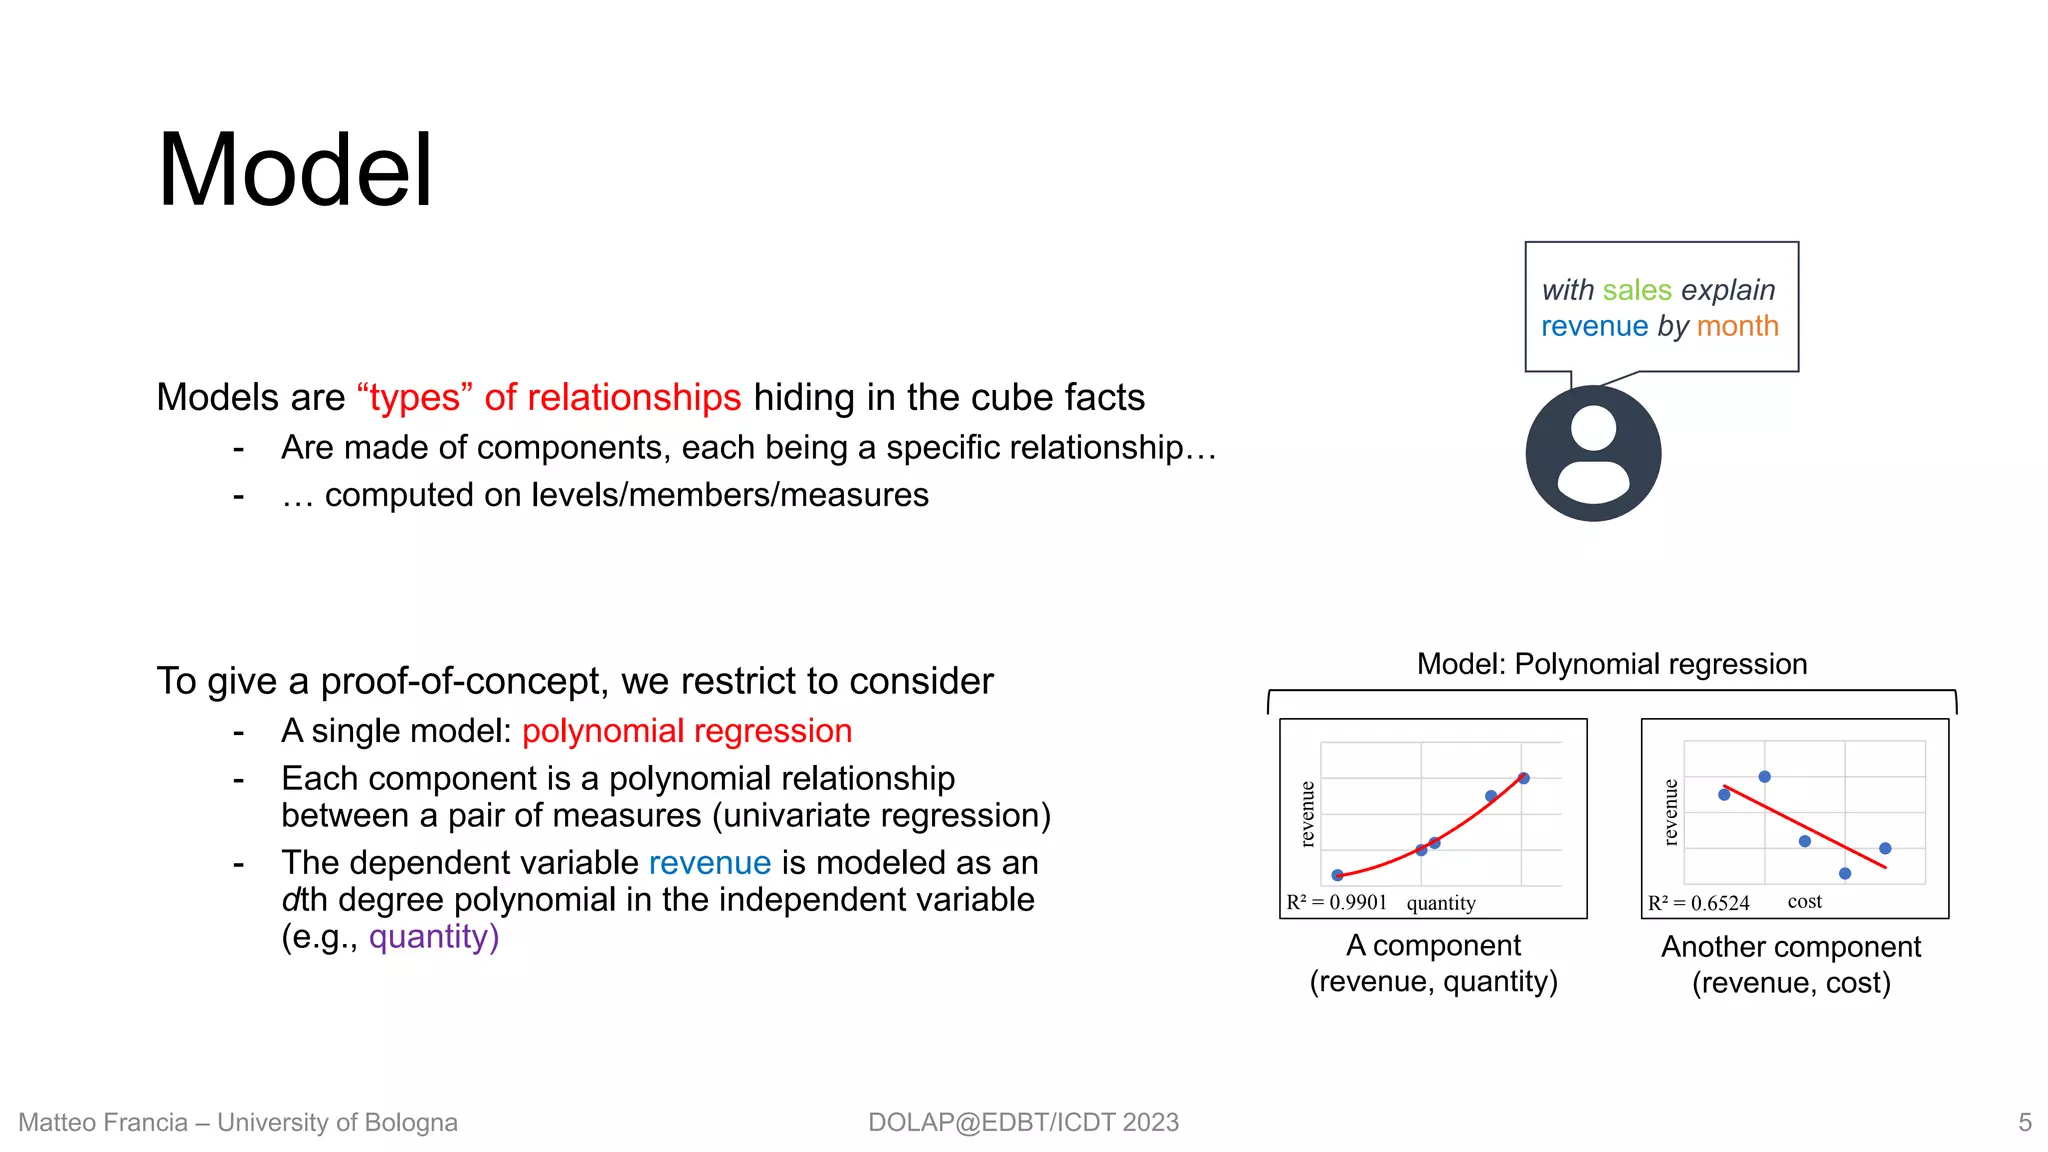
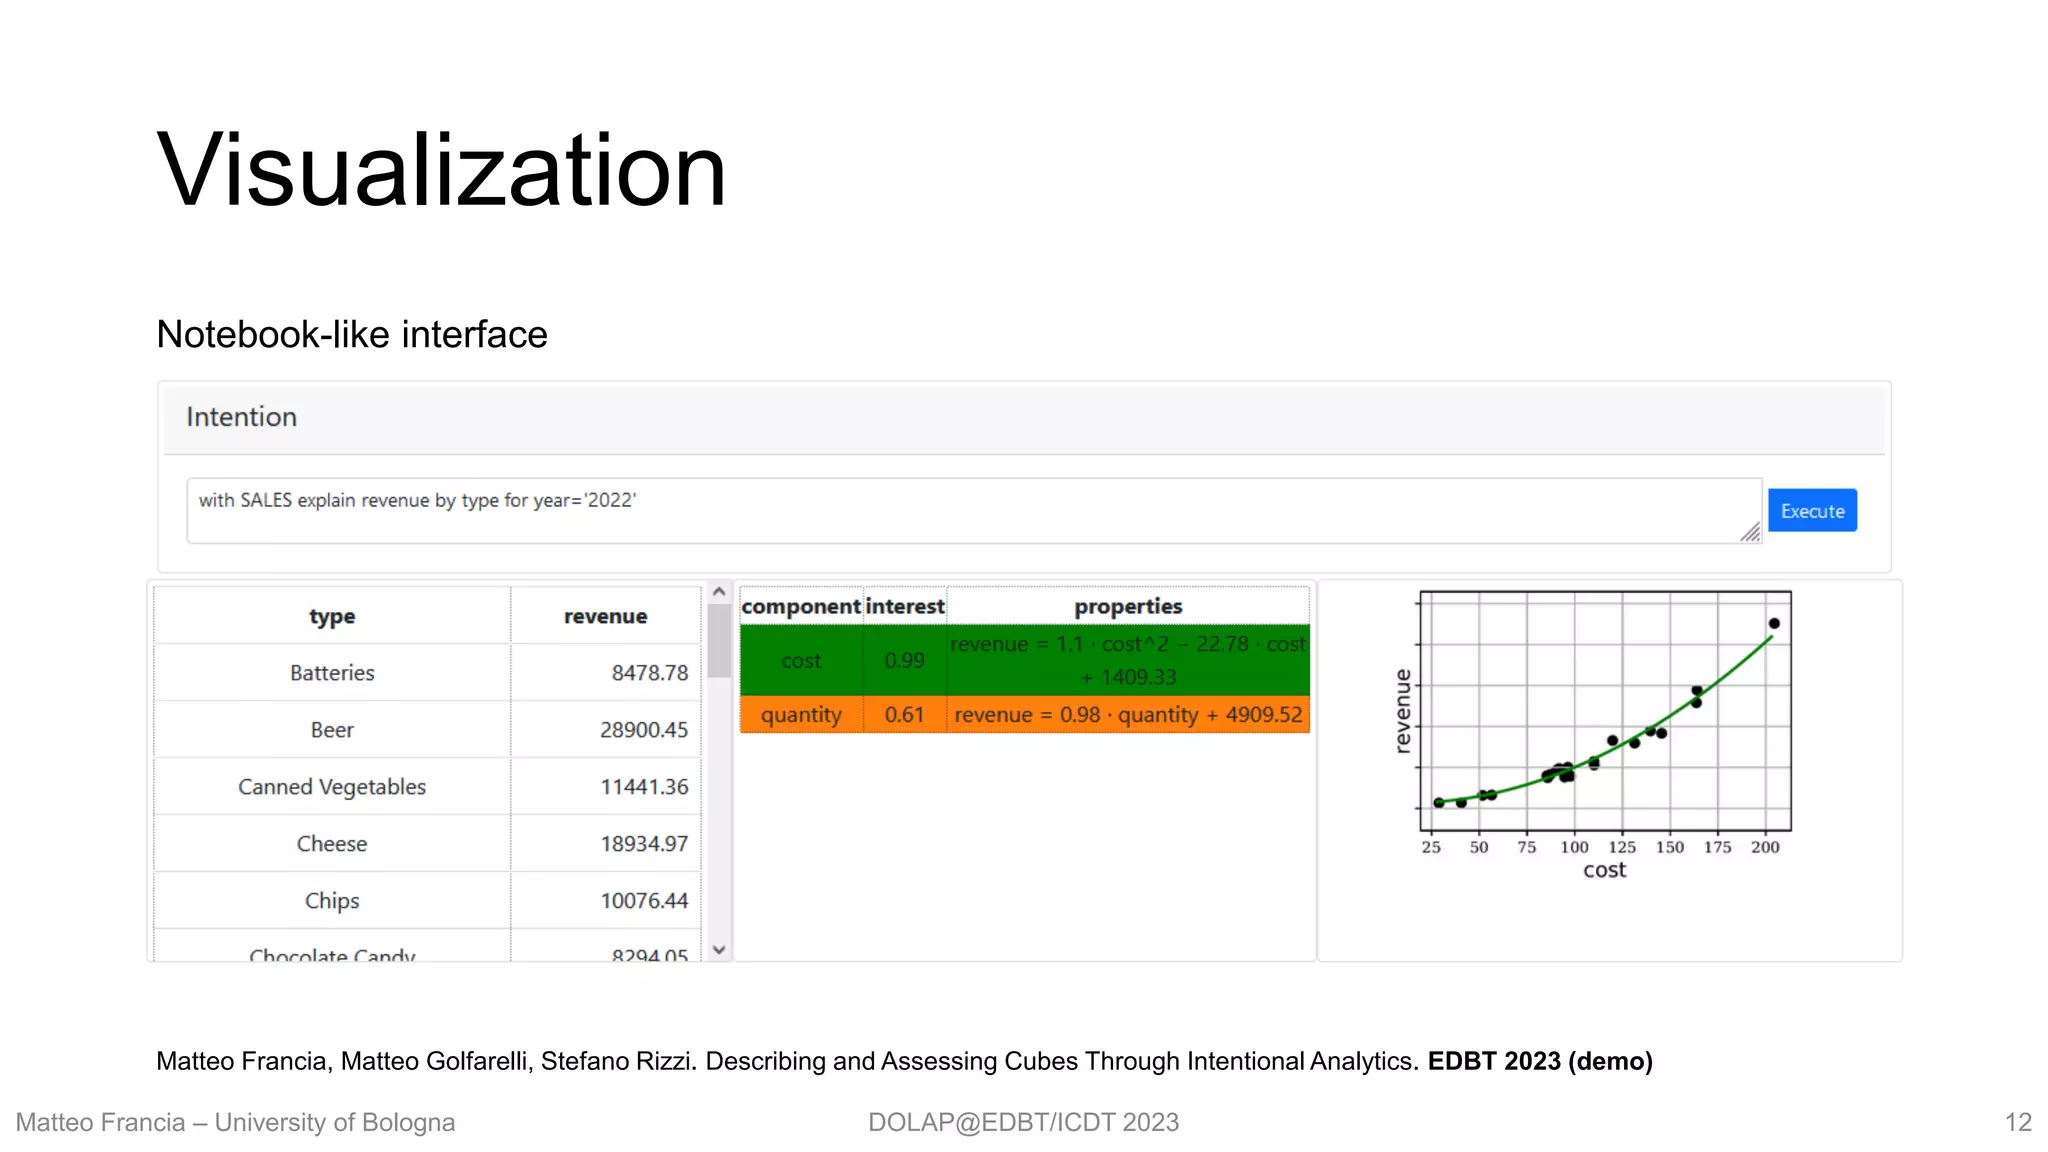
`Explain` intention:
with cube explain m [ for P ] by l1,…,ln [ against m1, ..., mr ]
“Explained” measure: m
Selection predicate: P (consider all facts if omitted)
Group-by set: l1,…,ln (at least one level)
Measures: m1, ..., mr (compute against all measures if omitted)
Semantics translates into an execution plan
i. Execute query for given cube,
measures, predicate, group-by set
ii. Apply models explaining relationships
through components
iii. Rank components by interestingness
iv. Return effective visualization
Matteo Francia – University of Bologna 4
with sales explain
revenue by month
Analytic dashboard
R² = 0.9901
revenue
quantity
month cost quantity revenue
125 10 12 125
132 20 14 150
12 30 10 60
15 40 5 15
50 50 9 50](https://image.slidesharecdn.com/slides-230328124515-687c8704/75/DOLAP2023-The-Whys-and-Wherefores-of-Cubes-4-2048.jpg)
![DOLAP@EDBT/ICDT 2023
Discussion
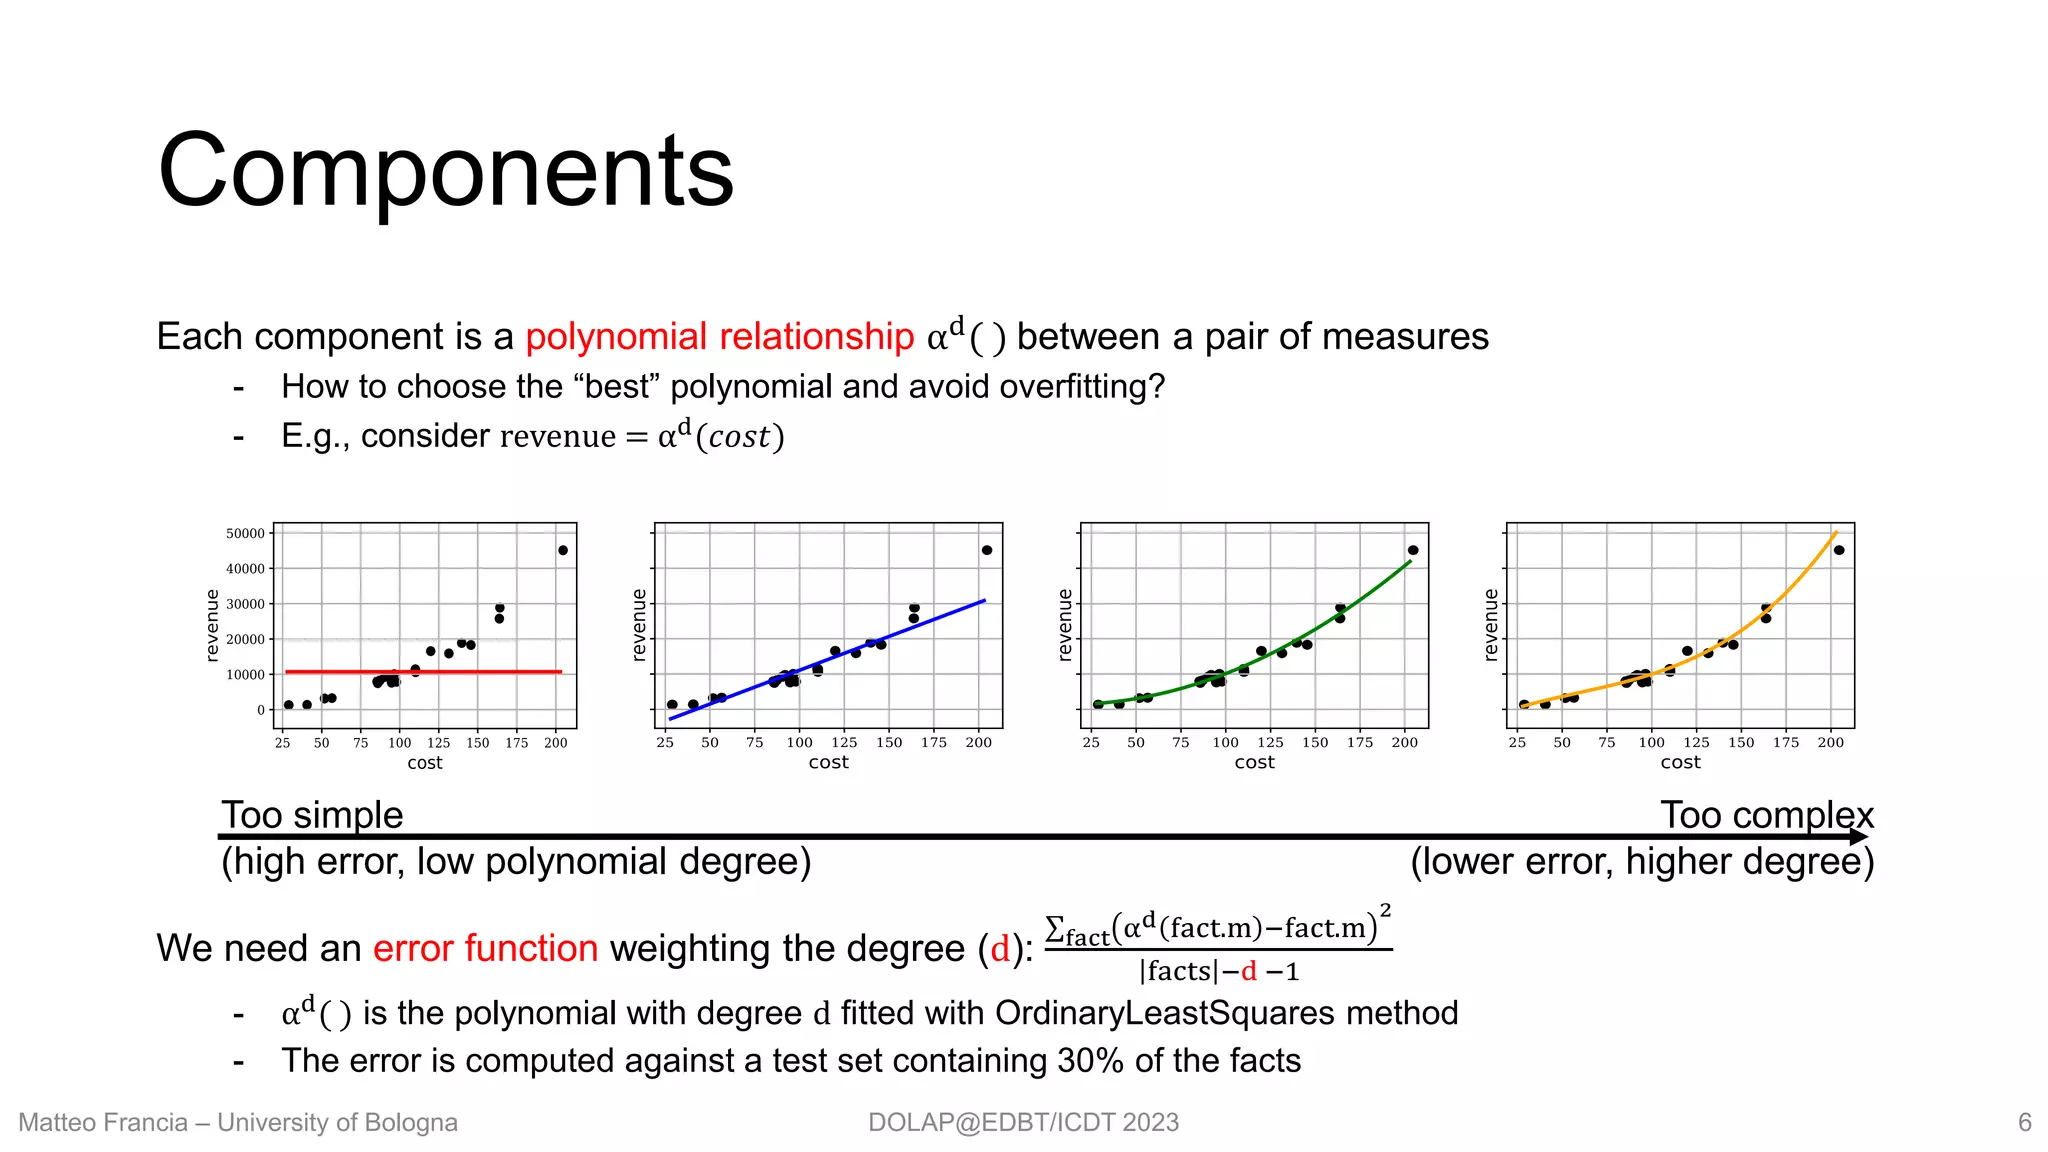
Overall, this paper is not about:
- (Polynomial) Regression optimization
- “Yet Another” explainability approach
We propose a modular framework where approaches to aggregate data explanation can be plugged
- Regression: return relationships between a dependent variable and one or more independent variables [4]
- Data lineage: which database tuple(s) caused that output to the query? [1]
- Intervention: an input is a cause to an output if a change affects the output [2, 3]
The added value is in the IAM paradigm and augmented analytics
- Data scientists can express high-level intentions…
- … and the system (automatically) selects the most interesting explanations
- … coupled with data and visualization
14
[1] Alexandra Meliou et al. 2010. The Complexity of Causality and Responsibility for Query Answers and non-Answers. VLDB
[2] Sudeepa Roy et al. 2014. A formal approach to finding explanations for database queries. SIGMOD
[3] Zhengjie Miao et al. 2019. LensXPlain: Visualizing and Explaining Contributing Subsets for Aggregate Query Answers. VLDB
[4] Fotis Savva et al. 2018. Explaining Aggregates for Exploratory Analytics. BigData.
https://xkcd.com/605/](https://image.slidesharecdn.com/slides-230328124515-687c8704/75/DOLAP2023-The-Whys-and-Wherefores-of-Cubes-14-2048.jpg)

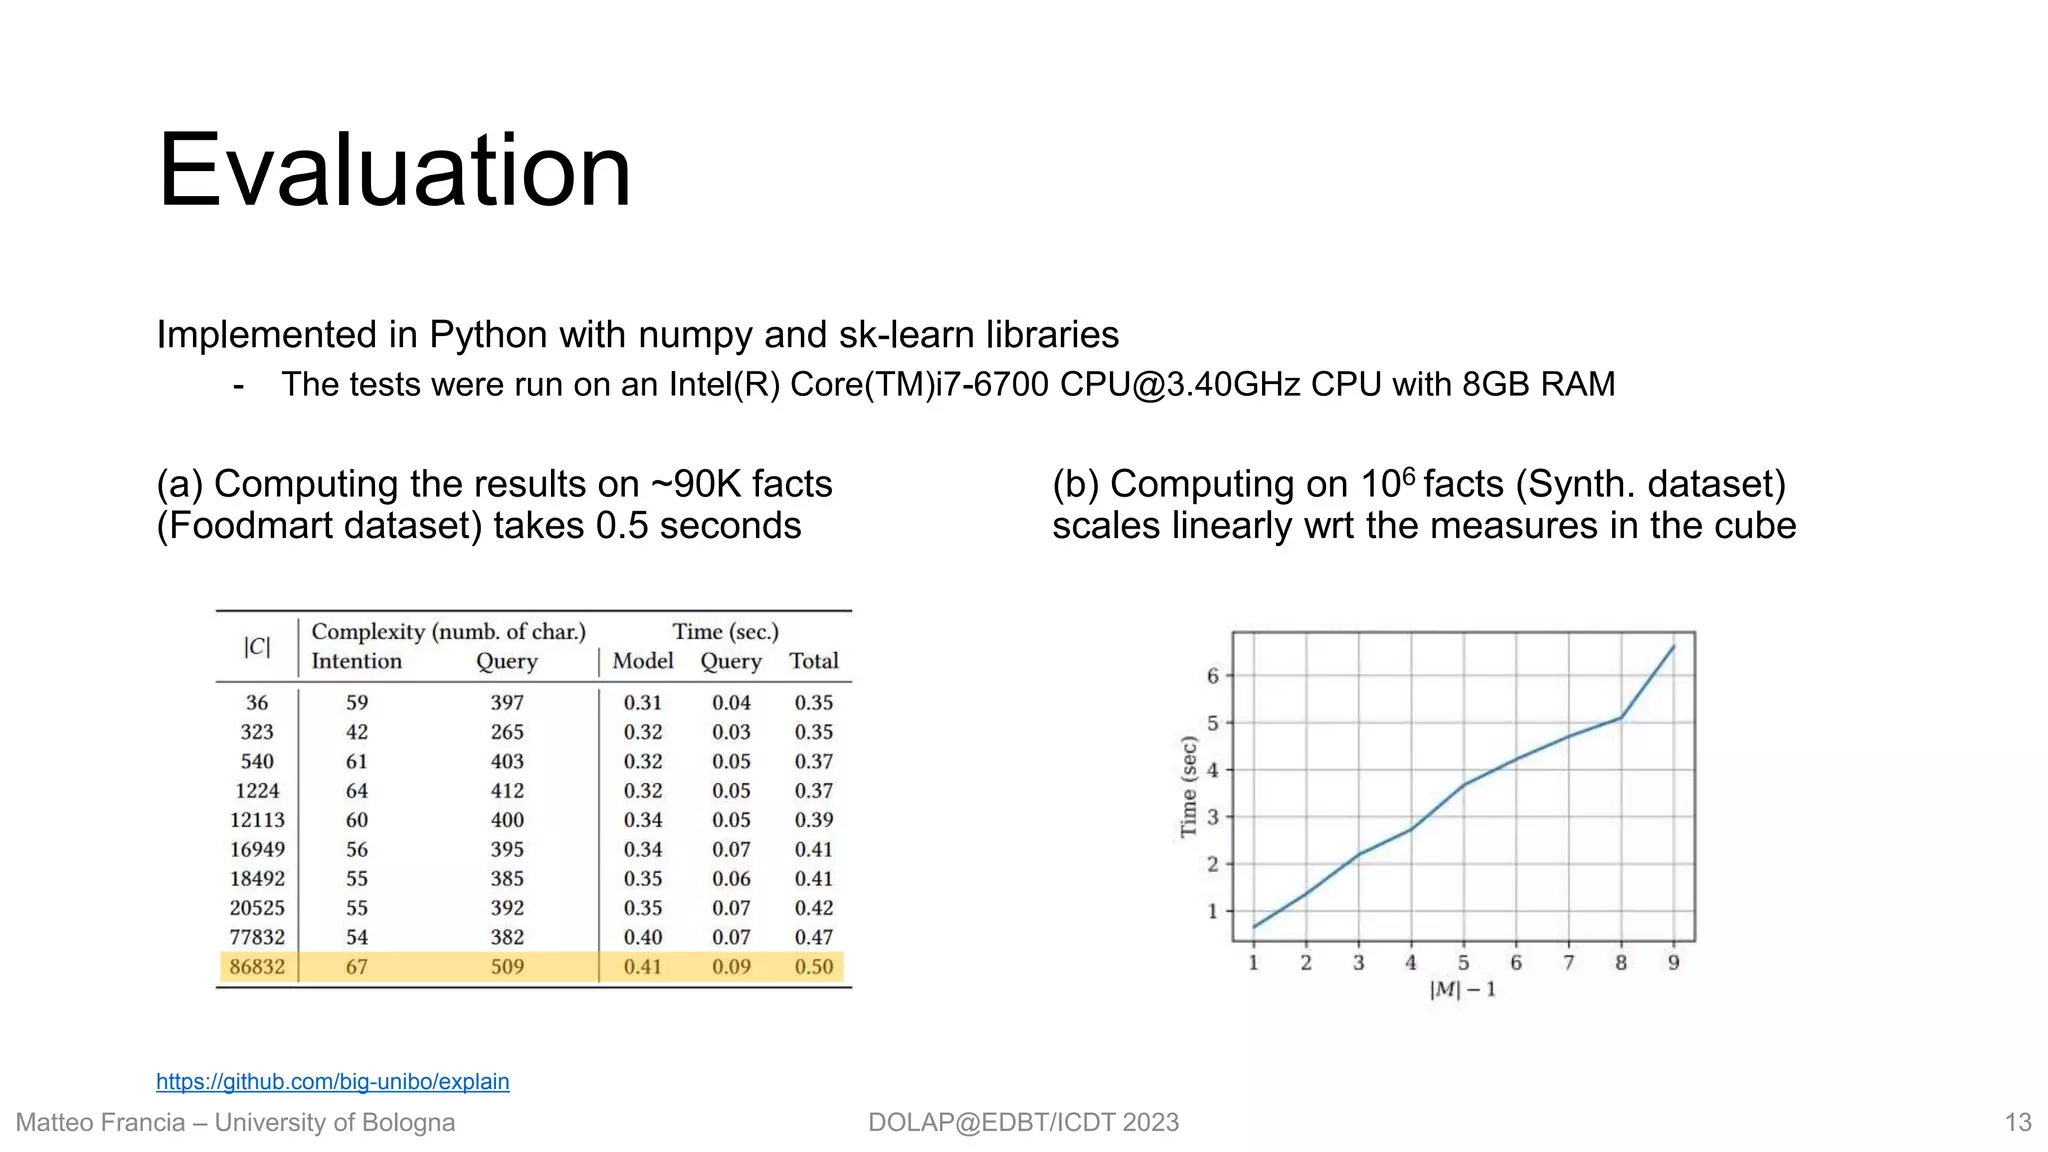
The document discusses the Intentional Analytics Model (IAM) for enhancing OLAP analysis of multidimensional cubes, emphasizing the need to express high-level intentions rather than simple query answers. It presents a framework for automatically discovering and explaining relationships in data, utilizing polynomial regression as a proof-of-concept for identifying significant patterns and insights within cubes of data. The authors highlight future research directions for expanding the model to multi-measure relationships and improving the interpretability and actionability of explanations.


![[EDBT2021] Assess Queries for Interactive Analysis of Data Cubes](https://cdn.slidesharecdn.com/ss_thumbnails/slides-210325110531-thumbnail.jpg?width=640&height=640&fit=bounds)
![[EDBT2023] Describing and Assessing Cubes Through Intentional Analytics (demo...](https://cdn.slidesharecdn.com/ss_thumbnails/slides-230329165138-bacab0e0-thumbnail.jpg?width=640&height=640&fit=bounds)


![[PhDThesis2021] - Augmenting the knowledge pyramid with unconventional data a...](https://cdn.slidesharecdn.com/ss_thumbnails/slides-210528090916-thumbnail.jpg?width=640&height=640&fit=bounds)


![[EDBT2021] Conversational OLAP in Action (Best Demo Award EDBT2021)](https://cdn.slidesharecdn.com/ss_thumbnails/slides-210326073202-thumbnail.jpg?width=640&height=640&fit=bounds)
![[MIPRO2019] Map-Matching on Big Data: a Distributed and Efficient Algorithm w...](https://cdn.slidesharecdn.com/ss_thumbnails/slides-cut-190522132504-thumbnail.jpg?width=640&height=640&fit=bounds)
![[SEBD2021] Conversational OLAP](https://cdn.slidesharecdn.com/ss_thumbnails/slidesnoext-210908071706-thumbnail.jpg?width=640&height=640&fit=bounds)
![[ADBIS2022] Insight-based Vocalization of OLAP Sessions](https://cdn.slidesharecdn.com/ss_thumbnails/francia-slides-220906132957-d9530b93-thumbnail.jpg?width=640&height=640&fit=bounds)
![[DOLAP2019] Augmented Business Intelligence](https://cdn.slidesharecdn.com/ss_thumbnails/mfrancia-abi-190327143945-thumbnail.jpg?width=640&height=640&fit=bounds)

![[SEBD2020] OLAP Querying of Document Stores in the Presence of Schema Variety](https://cdn.slidesharecdn.com/ss_thumbnails/sebd2020v2-200625135821-thumbnail.jpg?width=640&height=640&fit=bounds)
![[DOLAP2020] Towards Conversational OLAP](https://cdn.slidesharecdn.com/ss_thumbnails/dolap2020conversationalbi-200330094829-thumbnail.jpg?width=640&height=640&fit=bounds)
![[DataPlat2023] Opening](https://cdn.slidesharecdn.com/ss_thumbnails/opening-230329132737-fce2a0b5-thumbnail.jpg?width=640&height=640&fit=bounds)

![[DSC Europe 25] Ivan Peric - Intelligence Swarm Logic and Techno-Functional M...](https://cdn.slidesharecdn.com/ss_thumbnails/7my7c97fsduiccadgavw-2-251212103249-5a03f7c6-thumbnail.jpg?width=640&height=640&fit=bounds)


![[DSC Europe 25] Nikolay Burlutskiy - Best Practices for Building Enterprise M...](https://cdn.slidesharecdn.com/ss_thumbnails/uirvaiuvq8y1w8hzd9tx-7-251212103249-2619edb4-thumbnail.jpg?width=640&height=640&fit=bounds)
![[DSC Europe 25] Jovan Bogicevic - Legacy to AI-Driven Defense: Transforming D...](https://cdn.slidesharecdn.com/ss_thumbnails/rsarluadt563hntyfc8q-3-251211083849-3e7bc4c0-thumbnail.jpg?width=640&height=640&fit=bounds)
![[DSC Europe 25] Branko Urosevic -Rethinking Financial Talent: Integrating Cod...](https://cdn.slidesharecdn.com/ss_thumbnails/8jjrus8ttko6qj64f58f-3-251212103250-642c6374-thumbnail.jpg?width=640&height=640&fit=bounds)

![[DSC Europe 25] Vladimir Jelic - The AI-Driven Security Shift From Reactive D...](https://cdn.slidesharecdn.com/ss_thumbnails/6g5gj25mtjwayniqem1t-6-251209104645-7a5a5fc6-thumbnail.jpg?width=640&height=640&fit=bounds)

![[DSC Europe 25] Kaja Kandare - LLM as a judge.pptx](https://cdn.slidesharecdn.com/ss_thumbnails/arxyccaxsdsd1ba99wjw-7-251212104007-2b4e3f64-thumbnail.jpg?width=640&height=640&fit=bounds)
![[DSC Europe 25] Bassam Maharmeh - Artificial Intelligence: Opportunities and ...](https://cdn.slidesharecdn.com/ss_thumbnails/thhfmr2fqpawzj7hsjpg-5-251211083048-2c23204f-thumbnail.jpg?width=640&height=640&fit=bounds)
![[DSC Europe 25] Hans Kleinsman - The Compliance Gearbox: How Tax Tech Mediate...](https://cdn.slidesharecdn.com/ss_thumbnails/dxdytie1toel0hr90bjs-2-251212103250-174fdbe7-thumbnail.jpg?width=640&height=640&fit=bounds)
![[DSC Europe 25] Jon Dajci - Bridging TradFi and DeFi: Building the Future of ...](https://cdn.slidesharecdn.com/ss_thumbnails/fqmhfvlbqhkihjvqvhmu-7-251211083849-6af7e325-thumbnail.jpg?width=640&height=640&fit=bounds)
![[DSC Europe 25] Dusan Nesic - Securing Tomorrow’s Infrastructure: Why Cyber-P...](https://cdn.slidesharecdn.com/ss_thumbnails/qikbszfftyowjm2q6duw-1-251211083848-8f2ead6b-thumbnail.jpg?width=640&height=640&fit=bounds)


![[DSC Europe 25] Katherine Forrest - AI NOW: Understanding the Velocity of Cha...](https://cdn.slidesharecdn.com/ss_thumbnails/wvvbruqfrci0sfq9xwgb-4-251212104007-e5ad1987-thumbnail.jpg?width=640&height=640&fit=bounds)