Combustion and Flame145 (2006) 160–180
www.elsevier.com/locate/combustflame
Aerodynamics inside a rapid compression machine
Gaurav Mittal, Chih-Jen Sung ∗
Department of Mechanical and Aerospace Engineering, Case Western Reserve University, Cleveland, OH 44106, USA
Received 9 May 2005; received in revised form 11 October 2005; accepted 22 October 2005
Available online 15 December 2005
Abstract
The aerodynamics inside a rapid compression machine after the end of compression is investigated using planar
laser-induced fluorescence (PLIF) of acetone. To study the effect of reaction chamber configuration on the resulting
aerodynamics and temperature field, experiments are conducted and compared using a creviced piston and a flat
piston under varying conditions. Results show that the flat piston design leads to significant mixing of the cold
vortex with the hot core region, which causes alternate hot and cold regions inside the combustion chamber.
At higher pressures, the effect of the vortex is reduced. The creviced piston head configuration is demonstrated
to result in drastic reduction of the effect of the vortex. Experimental conditions are also simulated using the
Star-CD computational fluid dynamics package. Computed results closely match with experimental observation.
Numerical results indicate that with a flat piston design, gas velocity after compression is very high and the core
region shrinks quickly due to rapid entrainment of cold gases. Whereas, for a creviced piston head design, gas
velocity after compression is significantly lower and the core region remains unaffected for a long duration. As a
consequence, for the flat piston, adiabatic core assumption can significantly overpredict the maximum temperature
after the end of compression. For the creviced piston, the adiabatic core assumption is found to be valid even up
to 100 ms after compression. This work therefore experimentally and numerically substantiates the importance of
piston head design for achieving a homogeneous core region inside a rapid compression machine.
2005 The Combustion Institute. Published by Elsevier Inc. All rights reserved.
Keywords: Rapid compression machine; PLIF of acetone; Adiabatic core hypothesis; Computational fluid dynamics;
Autoignition
1. Introduction
In a rapid compression machine (RCM) study, pri-
mary experimental data consist of the pressure trace
of a given reacting mixture. A typical pressure trace
before autoignition taking place shows a rapid rise in
pressure during the compression stroke, which is of
the order of 15–40 ms, followed by a gradual decrease
in pressure due to heat loss from a constant-volume
* Corresponding author.
E-mail address: cjs15@po.cwru.edu (C.-J. Sung).
chamber at the end of compression. Although in prin-
ciple RCM simulates a single compression event,
complex aerodynamic features can affect the state of
the reacting core in the reaction chamber. Previous
studies (e.g., [1–3]) have shown that the motion of the
piston creates a roll-up vortex, which results in mix-
ing of the cold gas pockets from the boundary layer
with the hot gases in the core region. Such undesired
mixing leads to difficulties in accurately characteriz-
ing the state of the reacting mixture.
In modeling the RCM experiments, for simplicity
it is often assumed that the aerodynamic effects do
not play any significant role at the short time scales
0010-2180/$ – see front matter 2005 The Combustion Institute. Published by Elsevier Inc. All rights reserved.
doi:10.1016/j.combustflame.2005.10.019
2.
G. Mittal, C.-J.Sung / Combustion and Flame 145 (2006) 160–180 161
encountered in the RCM. It is further assumed that
the core gas, away from the thermal boundary layer,
is compressed adiabatically. Thus, temperature evolu-
tion is determined from the measured pressure pro-
file by assuming the adiabatic core hypothesis. Based
on this hypothesis, the core temperature at any in-
stant during compression, T (t), can be determined
from the experimentally measured pressure, P(t), ac-
cording to the relation
T (t)
T0
γ
γ −1
dT
T = ln[P(t)/P0],
where P0 is the initial pressure, T0 the initial tem-
perature, and γ the specific heat ratio. Furthermore,
to model the RCM data, the computed pressure vari-
ation needs to match with the experimental pressure
trace by including an empirically determined heat
transfer coefficient or volume expansion with a zero-
dimensional model [4–6]. However, substantial dis-
crepancies have been observed between data taken
from different rapid compression machines even un-
der similar conditions of temperature and pressure
[7,8]. These discrepancies are attributed partly to the
different heat loss characteristics after the end of the
compression stroke and partly to the difference in
aerodynamics between various machines.
The effect of aerodynamics is particularly more
complicated because it does not show up in the pres-
sure trace and it may lead to significant temperature
gradients and ultimately to the failure of the adiabatic
core hypothesis. If the aerodynamic effect becomes
significant and the adiabatic core hypothesis fails,
there is no easy way to determine the temperature
inside the reaction chamber. As a result, unambigu-
ous determination of the state of the reacting mixture
and systematic characterization of the resulting aero-
dynamic field inside an RCM are important for ob-
taining reliable kinetic data from RCMs and bridging
the gap between data taken from different machines.
Several studies have contributed to the understand-
ing of the aerodynamics and temperature field inside
an RCM by computational fluid dynamics (CFD) cal-
culations and experimental measurements. Griffiths et
al. [1] numerically showed that the hot core region
generated at the end of compression is virtually adia-
batic and spans approximately 70% of the volume of
the combustion chamber at the end of compression.
Griffiths et al. [1] also observed differences between
computational results using spatially uniform condi-
tions and CFD simulation. Differences between two
sets of computations were attributed to the effect of
temperature gradient that was accounted for in CFD
analysis [1]. In the recent study of Clarkson et al. [2],
the temperature field was imaged by Rayleigh scatter-
ing and laser-induced fluorescence (LIF) of acetone.
Acetone-LIF was found to nicely characterize the
temperature variations in the RCM, whereas Rayleigh
scattering was relatively less sensitive [2]. It was ex-
perimentally observed that the roll-up vortex had pen-
etrated the center of the combustion chamber at the
end of compression [2]. The temperature difference
between the hot gases and the roll-up vortex was esti-
mated to be 50 K [2]. Furthermore, LIF of acetone
generated by decomposition of di-t-butyl peroxide
unambiguously showed the temperature stratification
at the center of the reaction chamber [2].
Griffiths et al. [9] investigated temperature and
concentration fields in a rapid compression machine
by using a number of experimental techniques, in-
cluding Schlieren photography, planar laser-induced
fluorescence (PLIF) of acetone, PLIF of formalde-
hyde, and chemiluminescence imaging. In order to
illustrate the interaction of chemistry with the temper-
ature field in the RCM, Griffiths et al. [9] contrasted
the combustion behavior of di-t-butyl peroxide with
that of n-pentane. The overall reaction of the former is
characteristic of thermal ignition, while the combus-
tion of the latter was investigated in the compressed
temperature range exhibiting a negative temperature
dependence of the overall reaction rate. With imag-
ing being taken up to 10 ms after the end of com-
pression, results showed that the di-t-butyl peroxide
reaction proceeded faster in the zone of peak temper-
ature [9]. Somewhat similar behavior was observed
for n-pentane combustion when the compressed tem-
perature was at the lower end of the negative tempera-
ture dependence range [9]. By contrast, at compressed
temperatures close to the upper end of the nega-
tive temperature dependence region, the reaction in
the cooler zone developed faster and the temperature
inhomogeneity inside the reaction chamber rapidly
smoothed out [9]. However, Griffiths et al. [9] pointed
out that spatial inhomogeneity of concentrations of
intermediates can be there, which would affect the
eventual evolution of spontaneous ignition.
Griffiths et al. [10] used chemiluminescence imag-
ing along with filtered Rayleigh scattering in a rapid
compression machine to characterize the transition
from nonknocking to knocking reaction and the evo-
lution of the spatial development of the reactivity.
Results from filtered Rayleigh scattering gave evi-
dence of a cooler core region at compressed tem-
peratures below the negative temperature depen-
dence region [10]. In contrast, Rayleigh scattering
did not show a cooler core at compressed tempera-
tures within the region of negative temperature de-
pendence. Hence, the effect of the negative tempera-
ture dependence of reaction rate is to smooth out the
temperature inhomogeneity inside the reaction cham-
ber [10].
Lee and Hochgreb [3] theoretically demonstrated
that the roll-up vortex due to the piston motion can be
counteracted by deliberately machining a crevice into
the side of the piston. Creviced piston allowed more
accurate predictions of the reacting temperature from
3.
162 G. Mittal,C.-J. Sung / Combustion and Flame 145 (2006) 160–180
pressure–time records. Predictions of a simple heat
transfer model in conjunction with a creviced piston
were found to agree well with experimental pressure
history [3].
Desgroux et al. [11,12] made direct measurements
of temperature in an RCM using thermocouple and
single point Rayleigh scattering. These measurements
confirmed the existence of an adiabatic core gas at
the end of compression. Rayleigh scattering measure-
ments were made with a temperature accuracy of 3–
4%, but after the end of compression the local temper-
ature exhibited a standard deviation of 10–15% [11].
Desgroux et al. [12] conducted fine-wire thermocou-
ple measurements for nonreactive and reactive mix-
tures at different radial locations. They observed a
uniform temperature field for a few milliseconds af-
ter the end of compression and subsequent develop-
ment of temperature inhomogeneity due to heat loss
to the wall and gas recirculation [12]. For nonreactive
mixtures the temperature inhomogeneity persisted af-
ter compression, whereas for reactive iso-octane mix-
tures a temperature-leveling effect, ascribed to the
negative temperature coefficient of reaction rate, was
observed [12].
Donovan et al. [13] took direct thermocouple mea-
surement in a free-piston rapid compression facility to
assess the adiabatic core hypothesis. Measurements
were corrected for slower response of the thermocou-
ple. Donovan et al. [13] asserted that experimental
measurements at the end of the compression stroke
justified the adiabatic core gas assumption. However,
the thermocouple measurements failed to give a true
representation of temperature after the end of com-
pression because of the failure of the model used to
correct the time response of the thermocouple [13].
Recently, Würmel and Simmie [14] conducted
CFD studies of a twin-piston rapid compression ma-
chine using Star-CD. From the CFD simulations, the
piston head crevices were optimized for the twin-
piston RCM in terms of volume, location, and the di-
mension and geometry of the channel connecting the
crevice and the chamber. The channel connecting the
crevice and the chamber was optimized and the ideal
geometry was found to be rectangular [14]. An an-
gled channel design was seen to help somewhat in the
cooling of the trapped gas in the piston head crevice.
Würmel and Simmie [14] also observed strong depen-
dence of the crevice performance on the test gas used.
Specifically, although an optimal crevice was identi-
fied for test gases such as nitrogen, oxygen, and argon,
it was not possible when using helium, due to the as-
sociated high heat loss. Instead of helium, the use of
xenon as a bath gas for RCM experiments was recom-
mended [14].
The present investigation aims to extend the previ-
ous efforts by experimentally and numerically study-
ing the effect of the piston head geometry on aerody-
namics and temperature field inside an RCM. It has
implications for kinetic modeling in the sense that
how well the prediction of the adiabatic core hypoth-
esis matches with the actual temperature in the reac-
tion chamber for a long time duration after the end of
compression. Requirement of experimental data, par-
ticularly under the conditions of homogeneous charge
compression ignition (HCCI) operation, requires the
ability to sustain unambiguous reaction conditions for
longer times. This is so because the relevant HCCI
conditions are extremely lean or highly diluted, which
significantly increases the ignition delay times. There-
fore, it is particularly important to characterize the
state of the aerodynamics and the resultant tempera-
ture field for long time duration after the end of com-
pression stroke.
In the present work, temperature field inside an
RCM is studied using planar laser-induced fluores-
cence (PLIF) of acetone. Laser diagnostic technique
in an RCM offers many advantages in comparison to
the thermocouple measurements. Thermocouple mea-
surements suffers from the drawback that one cannot
readily obtain information about instantaneous spa-
tial variation of temperature. Moreover, there will be
aerodynamic disturbances if the thermocouple probe
is not sufficiently fine [12]. Additionally, correction
of the measured temperature due to the slow time re-
sponse of the thermocouple requires knowledge of the
velocity field inside the chamber. The validity of the
model used to determine the velocity field and cor-
rect for time response may be under question. By
resorting to a longer compression time, as conducted
in [12], while the effect of thermal inertia of the ther-
mocouple can be minimized, aerodynamics at long
compression times may not be a true representation
of what happens at short compression times. In con-
trast, temperature mapping using the laser techniques
is practically nonintrusive and is capable of giving in-
stantaneous spatially resolved temperature field.
Both a flat piston and a creviced piston are em-
ployed and compared in the present study. These ex-
periments will demonstrate whether the uniformity of
the temperature field is indeed improved by using a
creviced piston, as suggested by the earlier theoret-
ical study [3]. The present investigation is particu-
larly useful because experiments are conducted on the
same RCM. The mapping of the temperature field is
carried out for two different piston head configura-
tions under varying operating conditions for a long
time duration after the compression. In order to in-
vestigate the effect of the piston geometry on ignition
delay, experiments are also conducted for autoigni-
tion of iso-octane using both piston head configura-
tions. In addition, numerical simulations are carried
out using Star-CD CFD package. Computed results
4.
G. Mittal, C.-J.Sung / Combustion and Flame 145 (2006) 160–180 163
further provide insights into the nature of the aerody-
namics inside an RCM. Based on these experimental
and computational studies, conditions under which
the adiabatic core hypothesis can be satisfactorily ap-
plied are delineated.
In the following sections we will first highlight
the features of the RCM employed herein. Experi-
mental specifics for the ignition delay measurements
and PLIF of acetone are then described, followed by
experimental and numerical results on the characteri-
zation of aerodynamics inside the RCM.
2. Experimental
2.1. Rapid compression machine
Fig. 1 shows the schematic of the present RCM
system that consists of a driver piston, reactor piston,
hydraulic motion control chamber, and a driving air
tank. The driver cylinder has a bore of 5 in. (12.7 cm)
and that of the reactor cylinder is 2 in. (5.08 cm).
The machine is pneumatically driven and hydrauli-
cally stopped. Stroke can be varied between 7 and
10 in. (17.78 and 25.4 cm) by adjusting the spacers
on the hydraulic cylinder. Clearance is also adjustable
and can be varied by using split shims between the
hydraulic cylinder head and the reactor cylinder. Fur-
ther details of the present rapid compression machine
can be found in [15]. The cylindrical reaction cham-
ber is equipped with the sensing devices for pressure
and temperature, gas inlet/outlet ports for preparing
the reactant mixture, and quartz windows for optical
access. Dynamic pressure during compression is mea-
sured using Kistler 6125B transducer with a 5010B
charge amplifier.
In order to study the effect of the piston head de-
sign on aerodynamics in an RCM, experiments are
conducted for two different piston head configura-
tions: a creviced piston and a simulated flat piston.
An enlarged view of the configuration of the creviced
piston head is also shown in Fig. 1. The location of
the crevice is on the cylindrical surface of the piston
and the piston face is kept flat. On the other hand, the
term “flat piston” indicates a piston that does not have
a crevice along its cylindrical periphery and hence is
flat on the face and along the piston circumference. In
the present study, the flat piston head is simulated by
filling the crevice volume with a pack of o-rings. This
filling results in approximately 90% reduction in the
crevice volume and gives an almost flat piston.
Two sets of experiments are conducted and com-
pared using both piston head configurations. First,
ignition delays for stoichiometric iso-octane/oxygen/
inert gas mixtures are measured in the temperature
range of 684 to 878 K, from which the effect of piston
Fig. 1. Schematic of the rapid compression machine (RCM), the creviced piston head configuration, and the acetone-PLIF setup.
Dimensions of the creviced piston in mm: A = 0.50, B = 4.0, C = 0.15, D = 20.0, and E = 1.50.
5.
164 G. Mittal,C.-J. Sung / Combustion and Flame 145 (2006) 160–180
head configuration on autoignition is demonstrated.
Second, PLIF imaging of acetone for temperature
field mapping is carried out under conditions of rel-
atively low pressure (approximately 12 bar) and high
pressure (approximately 39.5 bar). These experiments
also provide insights into the effect of pressure on the
resulting temperature field inside the rapid compres-
sion machine.
2.2. PLIF of acetone
For the characterization of the temperature field,
laser-induced fluorescence of acetone tracer in nitro-
gen is studied from the end of the compression stroke.
The mixture consists of 1 to 2% (by concentration)
acetone and remaining nitrogen. The schematic of the
PLIF imaging setup is also depicted in Fig. 1. An ap-
proximately 5-mm-wide laser sheet with a waist of
50 µm is made to traverse the central plane of the
combustion chamber, which is equidistant from the
reactor piston face and the end of the chamber. The
combustion chamber is equipped with two 0.66-in.
(1.67-cm) diameter optically flat quartz windows for
the traversal of the laser sheet. The end of the cham-
ber is fitted with a 2-in. (5.08-cm) diameter and 1.7-
in. (4.318-cm) thick quartz window, which provides
full view of the combustion chamber for fluorescence
imaging. An intensified CCD camera (Princeton In-
struments, PI-MAX, 1024 × 256 pixels) with a UV
lens (Nikon, f = 105 mm) is placed perpendicular
to the laser sheet in order to record the fluorescence
images. A WG305 (Schott) filter is used to filter scat-
tered light from the fluorescence signal. A frequency-
doubled Continuum Nd:YAG system is used in con-
junction with a dye laser filled with Rhodamine 590
solution. The resulting laser energy at wavelength of
279 nm is around 8 mJ/pulse.
The synchronization of the laser firing with ma-
chine is achieved in the following manner. The laser
is continuously fired at a repetition rate of 10 Hz. The
signal generated from the start of the ICCD camera
acquisition is used to actuate a relay after a speci-
fied time delay. Actuation of the relay fires the RCM.
A subsequent laser pulse, which occurs after the end
of compression, provides the pumping source for the
induced fluorescence. The timings of laser pulses and
pressure trace of RCM are simultaneously recorded
using a data acquisition system, which allows accu-
rate determination of the timing of laser pulse relative
to the end of compression. After every experiment,
the laser optics is realigned to correct for any minor
movement of the machine as a result of firing. Since
the repetition rate of the laser system is 10 Hz, PLIF
images are single-shot measurements.
Fig. 2. Ignition delay time versus the adiabatic core tem-
perature at TDC for stoichiometric iso-octane/oxygen/inert
mixtures. Composition: iC8H18/O2/inert = 1/12.5/47. Ini-
tial conditions: P0 = 331 Torr and T0 = 297 K. The adi-
abatic core temperature at TDC is varied by changing the
composition of the inert gases.
3. Experimental results
3.1. Ignition delay
Experiments are generally conducted for a stroke
of 10 in. (25.4 cm) and clearance of 0.525 in.
(1.33 cm). Time for the compression stroke is ap-
proximately 30 ms, and the geometric compression
ratio when using a creviced piston is 15.1. Fig. 2
shows a plot of ignition delay, measured in the present
RCM, versus the adiabatic core temperature at the
top dead center (TDC), Tc, for stoichiometric iso-
octane/oxygen/inert gas mixtures. Based on the ex-
perimental pressure trace, Tc is calculated according
to
Tc
T0
γ
γ −1
dT
T = ln[Pc/P0], where Pc is the com-
pressed pressure at TDC. Experiments are conducted
using a flat piston and a creviced piston. For a given
piston head configuration, the adiabatic core temper-
ature is varied by changing the composition of the
inert gases (argon and nitrogen), while keeping a fixed
compression ratio. Results of the present work are
also compared with the experimental data of Minetti
et al. [16] under similar conditions of pressure, com-
position, and equivalence ratio. For the creviced pis-
ton, the initial pressure and the initial temperature are
kept fixed at 331 Torr and 297 K, respectively. For
the flat piston, clearance is increased to compensate
for the absence of the crevice so that the conditions
at TDC are identical to those for the creviced piston
when same initial conditions of pressure, temperature,
and composition are used. This results in adiabatic
core temperature at TDC ranging from 684 to 878 K
and pressure at TDC varying from 13.3 to 16.25 bar.
In spite of similar conditions, Fig. 2 demonstrates
substantial discrepancies among different sets of ex-
perimental data. This comparison shows that not only
the data from different RCMs under similar test con-
6.
G. Mittal, C.-J.Sung / Combustion and Flame 145 (2006) 160–180 165
ditions may be different, but also for the same RCM
there may be significant differences depending upon
the configuration of the piston head and the final re-
acting volume. Furthermore, it is seen from Fig. 2 that
when a flat piston is used, ignition delays are sig-
nificantly reduced as compared to those obtained by
using a creviced piston. It is therefore expected that
changing from a creviced piston head to a flat piston
head significantly affects the heat loss and the result-
ing aerodynamics inside the RCM, and the effect re-
flects in the form of considerable change in ignition
delay. This example is presented here to highlight the
importance of the piston head configuration effect on
ignition delay.
3.2. Acetone fluorescence
The acetone fluorescence signal can be highly sen-
sitive to temperature. At 279 nm excitation, fluores-
cence signal reduces by 42% as temperature increases
from 600 to 800 K [17,18]. Fig. 3 shows a represen-
tative single-shot PLIF image of a homogeneous ace-
tone/nitrogen mixture at room temperature of 297 K
and pressure of 44 bar, along with the associated pho-
ton count integrated along the width of the laser sheet.
For this experiment, a mixture of acetone and nitrogen
at an initial pressure of 2.91 bar is gradually com-
pressed by slowly moving the reactor piston. Such
compression is nearly isothermal because the com-
pressed gases are allowed to cool down to the room
temperature. After the desired compressed pressure
is reached, the fluorescence measurement is subse-
quently taken. Laser sheet enters from the right side
of the image. The location of cylinder wall is also
shown in the figure. Decay in the fluorescence signal
Fig. 3. A representative single-shot acetone-PLIF image and
the associated photon counts integrated along the width of
the laser sheet. Chamber conditions: pressure = 44 bar and
temperature = 297 K. Laser sheet enters from the right side
of the image.
from right to left is because of strong absorption. Ac-
cording to the Beer–Lambert law, in a homogeneous
field with uniform temperature and concentration, sig-
nal decays exponentially due to absorption of the laser
intensity. By correcting for absorption and incorporat-
ing for temperature sensitivity of fluorescence signal,
it is possible to determine the resultant temperature
field from fluorescence signal. Parameters for tem-
perature sensitivity of acetone fluorescence are taken
from Thurber et al. [17,18].
Using the fluorescence intensity shown in Fig. 3,
Fig. 4 demonstrates the procedure for deducing the
temperature distribution. In Fig. 4, radial direction
equal to 0 corresponds to the central axis of the cylin-
drical chamber, while 2.54 and −2.54 cm represent
the cylinder wall on either side. Moreover, the dot-
ted line is the actual fluorescence signal, while the
dashed line represents the exponential decay in the
fluorescence intensity, as calculated using the Beer–
Lambert law and the known temperature of 297 K.
In addition, the deduced temperature distribution is
denoted by the solid line. It is seen from Fig. 4 that
in a uniform temperature field, signal follows the ex-
ponential decay feature and the deduced temperature
nicely predicts the temperature distribution. In Fig. 4,
the deduced temperature is noted to be within ±4 K,
which is within 1.35% of the actual temperature. This
gives an estimate of the uncertainty of the deduced
temperature due to the noise in the fluorescence sig-
nal.
When there exists temperature nonuniformity in
the chamber, knowledge of the temperature at one
anchor point is required to deduce the temperature
distribution from the fluorescence signal. Relative to
this anchor point, temperature along the radial direc-
tion can subsequently be deduced by knowing the
temperature dependence of the fluorescence intensity.
Fig. 4. Temperatures deduced from the fluorescence signal.
Chamber conditions: pressure = 44 bar and temperature =
297 K. Dotted line: raw fluorescence intensity. Dashed line:
calculated fluorescence intensity using the Beer–Lambert
law. Solid line: deduced temperature distribution.
7.
166 G. Mittal,C.-J. Sung / Combustion and Flame 145 (2006) 160–180
However, such an anchor temperature is difficult to be
measured during the actual RCM experiment. In the
present work, the maximum temperature in the cham-
ber at any time instant is taken as the adiabatic core
temperature, calculated from the pressure trace based
on the expression
T (t)
T0
γ
γ −1
dT
T = ln[P(t)/P0].
The procedure to deduce the temperature distribu-
tion from the integrated fluorescence intensity profile
is as follows. An anchor point in the fluorescence in-
tensity profile is first arbitrarily chosen at some pixel
inside the chamber and given a temperature value
equal to the adiabatic core temperature derived from
the experimental pressure trace at that instant. Sub-
sequently, the temperatures at other radial locations
are determined by marching radially in both direc-
tions toward the wall from this anchor point. While
marching radially, correction for absorption is con-
ducted according to the Beer–Lambert law. Accord-
ing to this law, attenuation in the laser intensity (I)
as the laser traverses a length dx is expressed as
I/I0 = exp(−σndx), where I0 is the incident laser
intensity, σ is the absorption coefficient, and n repre-
sents the acetone number density. At each marching
step, after correcting for the absorption, the temper-
ature is calculated from the knowledge of the tem-
perature dependence of the fluorescence intensity, for
which data is taken from Thurber et al. [17,18]. By
marching radially from the first chosen anchor point,
the temperature distribution along the entire domain
of the chamber is therefore deduced. If the result-
ing maximum temperature in the chamber is higher
than the adiabatic core temperature, the temperature
of the anchor point is reduced for the next iteration.
The iteration procedure continues until the maximum
deduced temperature in the chamber equals the adia-
batic core temperature.
It has to be pointed out that the assumption of the
maximum temperature being equal to the adiabatic
core temperature does not affect the pattern of the de-
duced temperature in any way. If the actual maximum
temperature is somewhat lower than the adiabatic core
temperature, the entire temperature profile would shift
downward, without affecting the pattern of the tem-
perature distribution.
3.3. Flat piston
3.3.1. Low compressed gas pressure
Fig. 5 shows the experimental results conducted at
an initial pressure of 236 Torr and an initial temper-
ature of 297 K using the simulated flat piston. The
mixture consists of 2% acetone in nitrogen. At the
end of compression, the gas pressure and tempera-
ture are 12.5 bar and 780 K, respectively. Again, the
raw fluorescence signal is shown as the dotted line
and the deduced temperature is denoted as the solid
line. Exponential decay of the fluorescence intensity,
as may be observed in a uniform temperature field, is
shown as the dashed line. Time 0 is taken as the end
of the compression stroke. The fluorescence signal
at 1 ms after compression shows increased intensity
in the central portion of the chamber. Any deviation
of fluorescence signal from exponential decay is in-
dicative of temperature inhomogeneity. In addition,
any hump corresponds to reduced temperature, while
any depression indicates an increase in the tempera-
ture. At 1 ms, an increased fluorescence intensity in
the central portion is due to the effect of the roll-up
vortex, which brings in cold gases from the bound-
ary layer to the center of the chamber. In the tem-
perature field, this increase in fluorescence intensity
corresponds to approximately 100 K reduction in the
temperature. At 6 ms postcompression, as we go from
the wall to the centerline, there are alternating cold
and hot regions. Apart from the temperature reduction
of approximately 50 K in the central regime, there is
another zone of low temperature near the wall. The
reason for this type of temperature nonuniformity will
be discussed later on along with the discussion of
computational results.
At time steps of 8 and 18 ms, the width of the cen-
tral depression zone increases due to thermal trans-
port, whereas the temperature difference associated
with this depression decreases. In addition, the ef-
fect of the side depression becomes more pronounced.
Similar features are observed in the temperature field
at subsequent time steps. Even at a long time scale
of 129 ms, sharp temperature gradients exist in the
chamber. Furthermore, these PLIF results are consis-
tent with those of previous studies [2,9].
Since only one PLIF measurement can be im-
aged during every run of the RCM, aerodynamic fea-
tures captured at the specified time instance may vary
slightly in different runs. For instance, at 19 ms in
Fig. 5, instead of depression in the temperature dis-
tribution at the center, a peak in the center and two
adjacent zones of low temperature are observed. This
would suggest that the cold gases flowing across the
piston head did not reach the center of the chamber
from either direction. Although slightly different pat-
tern may be observed in different runs even at the
same reference time after compression, it does not al-
ter the conclusion that the use of the flat piston leads
to substantial temperature nonuniformity due to the
effect of the roll-up vortex. In general, PLIF experi-
ments are found to give fairly repeatable temperature
distribution.
3.3.2. High compressed gas pressure
Fig. 6 illustrates another set of experimental re-
sults using the simulated flat piston, with an initial
pressure of 700 Torr and an initial temperature of
8.
G. Mittal, C.-J.Sung / Combustion and Flame 145 (2006) 160–180 167
Fig. 5. PLIF intensities and the deduced temperature distributions at varying times after compression for a simulated flat piston
head. Gas composition: 2% acetone in nitrogen. Conditions at TDC: pressure = 12.5 bar and temperature = 780 K. Dotted line:
raw fluorescence intensity. Dashed line: calculated fluorescence intensity in a uniform temperature field using the Beer–Lambert
law. Solid line: deduced temperature distribution.
297 K. The molar concentration of acetone is 1% in
nitrogen. This results in the compressed gas pressure
of 39.5 bar and compressed temperature of 815 K at
TDC. The features of the temperature field are simi-
lar to those obtained at the low compressed pressure.
Specifically, there exists temperature depression in
the center at the end of compression and side depres-
sions appear at the subsequent time steps. In contrast
to the measurement at low compressed pressure, at
high compressed pressure the central depression in
the temperature distribution is smaller, being around
65 K. At the subsequent time steps, the central tem-
perature depression at higher compressed pressure is
generally less than that at lower compressed pressure.
9.
168 G. Mittal,C.-J. Sung / Combustion and Flame 145 (2006) 160–180
Fig. 6. PLIF intensities and the deduced temperature distributions at varying times after compression for a simulated flat piston
head. Gas composition: 1% acetone in nitrogen. Conditions at TDC: pressure = 39.5 bar and temperature = 815 K. Dotted
line: raw fluorescence intensity. Dashed line: calculated fluorescence intensity in a uniform temperature field by using the
Beer–Lambert law. Solid line: deduced temperature distribution.
3.4. Creviced piston
3.4.1. Low compressed gas pressure
Using a mixture consisting of 1% acetone in ni-
trogen, a series of experiments with the creviced head
piston are conducted. Initial conditions of 275 Torr
and 297 K yield compressed gas conditions at TDC
of 11.95 bar and 760 K. PLIF results and the de-
duced temperature distribution at varying time steps
are shown in Fig. 7.
At 4.1 ms postcompression, the effect of the vor-
tex has not reached the center of the chamber and the
depression in temperature is observed to be approx-
imately 35 K. At 6.2 ms, the central depression cor-
responds to approximately 30 K, as shown in Fig. 7.
However, at 12 ms the effect of the vortex has grown
10.
G. Mittal, C.-J.Sung / Combustion and Flame 145 (2006) 160–180 169
Fig. 7. PLIF intensities and the deduced temperature distributions at varying times after compression for a creviced piston head.
Gas composition: 1% acetone in nitrogen. Conditions at TDC: pressure = 11.95 bar and temperature = 760 K. Dotted line: raw
fluorescence intensity. Dashed line: calculated fluorescence intensity in a uniform temperature field by using the Beer–Lambert
law. Solid line: deduced temperature distribution.
and the central depression in temperature is approxi-
mately 80 K.
In comparison with the case of the flat piston at
low pressure, the effect of the vortex is reduced, al-
though it is not eliminated. Fig. 7 also demonstrates
that the development of temperature inhomogeneity is
relatively gradual for the case of the creviced piston.
3.4.2. High compressed gas pressure
Fig. 8 shows the experimental results for the mix-
ture consisting of 1% acetone in nitrogen, with the
initial conditions of 870 Torr and 297 K. At the end of
compression, the compressed gas conditions at TDC
are 39.5 bar and 770 K. It is seen from Fig. 8 that
there is no evidence of any temperature inhomogene-
11.
170 G. Mittal,C.-J. Sung / Combustion and Flame 145 (2006) 160–180
Fig. 8. PLIF intensities and the deduced temperature distributions at varying times after compression for a creviced piston head.
Gas composition: 1% acetone in nitrogen. Conditions at TDC: pressure = 39.5 bar and temperature = 770 K. Dotted line: raw
fluorescence intensity. Dashed line: calculated fluorescence intensity in a uniform temperature field by using the Beer–Lambert
law. Solid line: deduced temperature distribution.
ity at 2 ms postcompression. The temperature in the
chamber is quite uniform and the fluorescence sig-
nal shows exponential decay. At the subsequent time
steps, even up to 114 ms, there is no effect due to the
vortex. Eventually, the effect of the vortex becomes
noticeable. At 200 ms, the depression due to the vor-
tex is approximately 40 K, while at 390 ms the central
depression corresponds to approximately 100 K.
These results clearly show the effects of the pres-
sure and piston head design on the aerodynamics
within an RCM. In comparison to the results using
the creviced piston at low pressure (Fig. 7), at high
pressure the effect of the vortex roll-up is significantly
reduced. While at low pressure the effect of the vortex
appears from the end of compression, at high pres-
sure such an effect becomes noticeable only at time
12.
G. Mittal, C.-J.Sung / Combustion and Flame 145 (2006) 160–180 171
greater than 114 ms postcompression. Furthermore, in
comparison to the results using the flat piston at high
pressure, the creviced piston at high pressure yields
a much higher degree of homogeneity inside the test
chamber for long time duration.
4. Numerical analysis
Star-CD CFD package is used to simulate the ex-
perimental conditions and provide insights into the
detailed evolution of the aerodynamic field inside an
RCM. As with the experimental tests, simulation is
conducted for conditions of low, intermediate, and
high compressed gas pressures, and for the flat as well
as the creviced piston head configurations.
Because of the cylindrically symmetric geometry
of the combustion chamber, numerical simulation is
carried out on an axisymmetric grid distribution. In
the actual physical situation in the RCM, flow may de-
viate from axisymmetric behavior and exhibit asym-
metrical patterns. However, axisymmetric configura-
tion is nevertheless chosen because it considerably
reduces the computational time while capturing the
essentials of the underlying fluid dynamics. Compu-
tations are performed from the beginning of the com-
pression stroke with a compression time of 30 ms.
Initially, the test gas, nitrogen, at rest is specified with
uniform temperature and pressure. A constant temper-
ature of 297 K and no slip condition are specified at
the cylinder wall boundary and piston surface.
In the simulation, the piston starts from rest and
its motion is given in a manner similar to the pis-
ton motion in an engine, by specifying dimensions for
the crank radius and the connecting rod length. This
specification of velocity profile is consistent with the
operation of the present RCM, in which the piston ac-
celerates from rest initially, eventually decelerates at
a constant rate, and comes to a stop due to the hy-
draulic stopping mechanism. Furthermore, by varying
the crank radius and the length of the connecting rod
in the CFD calculations, it is observed that as long as
the compression time is kept constant, the resulting
flow field is insensitive to reasonable changes in the
velocity profile. This observation is consistent with
the finding of Würmel and Simmie [14]. At top dead
center, the piston comes to rest and remains there
for subsequent time steps. A time step of 55.55 µs
is taken, as further reduction of the time step by a
factor of two results in identical solution. During the
compression stroke, the vertex filling methodology of
Star-CD [19] is chosen for the motion of the grid. In
this method, the same number of grids is maintained
between the cylinder head and the piston head, but the
grids become compressed as the piston moves. After
the end of the compression stroke, the computational
Fig. 9. Computational grid distribution for a creviced piston
at the end of compression. All length dimensions are in mm.
grids remain the same for the post compression pe-
riod.
The computational grid distribution employed for
the creviced piston configuration at the end of com-
pression is shown in Fig. 9. The main reaction cham-
ber consists of 100 grids in the radial direction and
140 grids in the axial direction. In the radial direc-
tion, the finer grids are used near the boundary. In the
axial direction, an accordion distribution is used, with
the finer grids near the piston and cylinder head and
the coarser grids in between. In order to ascertain the
quality of the grid distribution, selective cases are cal-
culated on a finer grid distribution of 150 ×200 in the
radial and axial directions, respectively. The use of
the finer grids results in an identical flow pattern and
less than 0.25% change in predicted temperature. As
a result, all the computed results shown herein are ob-
tained on a 100 × 140 grid distribution.
In addition, calculations are performed and com-
pared for both laminar and turbulent flow conditions.
Since it cannot be easily ascertained a priori whether
the postcompression flow field inside an RCM is lam-
inar or turbulent, it is important to perform calcula-
tions using both laminar and turbulent models, and
assess their predictions by comparing with the exper-
imental results. Various turbulent models are consid-
ered. A standard version of the k–ε model is found to
yield extremely high turbulent mixing. On the other
hand, calculations using a RNG model yield relatively
less turbulent mixing and are found to be closer to the
experimental observation in comparison to the results
obtained using the k–ε model. Furthermore, computa-
tional results show that the features of aerodynamics
are better predicted by laminar calculations, while the
actual aerodynamic pattern is expected to be some-
13.
172 G. Mittal,C.-J. Sung / Combustion and Flame 145 (2006) 160–180
Fig. 10. STAR-CD simulation of temperature and velocity fields at varying times after compression for a flat piston at a pressure
of 12.8 bar at TDC under laminar condition.
where in between the laminar and turbulent calcula-
tions.
5. Computational results
Using the flat piston, Fig. 10 shows the computed
fields of velocity and temperature for various time
steps after the end of compression under laminar con-
ditions. This is the case with a relatively low com-
pressed pressure of 12.8 bar at TDC. At the end of
compression, i.e., at 0 ms, maximum velocity in the
chamber is 12.33 m/s. There is a big vortex span-
ning almost the entire chamber, which shears cold
gases from the boundary and brings them inside. As
14.
G. Mittal, C.-J.Sung / Combustion and Flame 145 (2006) 160–180 173
Fig. 11. STAR-CD simulation of temperature and velocity fields at varying times after compression for a flat piston at a pressure
of 13.14 bar at TDC under turbulent condition.
such, the regime near the centerline is greatly af-
fected by the flow of the cold gases from the bound-
ary. Along with the main vortex, the computed re-
sults show the formation of corner vortices near the
cylinder wall, the piston head, and the centerline.
At 20 ms after compression, the maximum veloc-
ity has reduced to 3.27 m/s, but the velocity pattern
is markedly different from that at the end of com-
pression. The corner vortex on the piston head also
becomes significantly large. At the subsequent time
steps, the pattern of the flow field remains almost
identical and the velocity in the chamber continues
to decay. At 60 ms, the maximum velocity is reduced
to 1.19 m/s.
As a comparison, Fig. 11 shows the computed re-
sults using the RNG turbulent model under similar
conditions of Fig. 10. The compressed pressure at
TDC is now 13.14 bar. For this turbulent simulation,
the maximum velocities at the end of compression
(0 ms) and at 10 ms postcompression are respectively
13.38 and 5.48 m/s, which are not much different
from those of the laminar simulation. However, the
turbulent calculations do not exhibit any corner vor-
tex, as seen in the laminar model. This is expected
as turbulence suppresses the onset of flow separation.
Fig. 11 also demonstrates that the nature of velocity
field remains identical for all the time steps calcu-
lated. In the temperature field, enhanced mixing and
15.
174 G. Mittal,C.-J. Sung / Combustion and Flame 145 (2006) 160–180
shallow temperature gradient are shown in Fig. 11, as
compared to the laminar results.
When comparing PLIF data with the computa-
tional results, it can be clearly seen that the simulation
using the laminar model agrees well with the fea-
tures of the aerodynamics observed in experiments,
whereas the turbulent calculations fail to do so. The
existence of sharp temperature gradients in the experi-
mentally deduced temperature profile is also shown in
the laminar flow calculations. It should be mentioned
that although the turbulent calculations may not com-
pletely capture the qualitative trend observed in the
PLIF experiments, the comparison of Figs. 10 and 11
provide insights into the effect of turbulence on the
aerodynamics inside an RCM.
As with the experimental results, the effect of the
vortex on the temperature distribution near the cen-
tral portion of the chamber at the end of compression
is also noted in the numerical simulation. However,
depression in the temperature predicted by the sim-
ulation is greater (200 K) than that obtained by the
experimental data (100 K). This quantitative differ-
ence can be attributed to a number of reasons as fol-
lows. The piston used in the experiment is a simulated
flat piston with approximately 10% of the crevice vol-
ume and not a truly flat piston as employed in the
simulation. Therefore, relatively smaller effect of the
vortex in the experiment than what would occur for
a truly flat piston for which simulation is calculated
is expected. In addition, simulation is conducted for
conditions of constant wall temperature. But in the
actual experiment, it is expected that the wall temper-
ature increases by a few kelvin, resulting in smaller
temperature nonuniformity.
Furthermore, there exist alternating hot and cold
regions in the experimental results using the flat pis-
ton (cf. Figs. 5 and 6). Moving from the wall bound-
ary toward the center, there is a zone of high tem-
perature. After this zone, there is a low temperature
regime, followed by another zone of high tempera-
ture. Finally, the center of the chamber is at low tem-
perature. Such a temperature field can be produced
only by multiple vortices, rotating in different direc-
tions. Similar features can be observed in the com-
puted temperature and velocity fields at 20 ms for the
laminar calculations, as shown in Fig. 10b. There are
alternating hot and cold regions and the velocity field
exhibits primarily two vortices.
Based on the laminar calculations, Fig. 12 shows
the computed temperature and velocity fields for the
creviced piston at a relatively low pressure of 11.9 bar
at TDC. For the ease of representation, only the
main chamber volume, apart from the crevice zone, is
shown in Fig. 12. At the end of compression (0 ms),
there is small temperature nonuniformity near the pis-
ton head. The maximum predicted gas velocity at this
time is 2.29 m/s, which is much smaller than the gas
velocity for the flat piston. The effect of the vortex is
seen to gradually grow at the subsequent time steps.
Even at 80 ms post compression, unlike the flat piston
case, significant part of the chamber is unaffected by
the vortex, as shown in Fig. 12e.
Fig. 13 shows the simulated temperature fields for
the flat piston at a higher pressure of 40.7 bar at TDC,
using the laminar model. Patterns of the velocity and
temperature fields are identical to those calculated at
low pressures. However, at higher pressures, the effect
of the vortex penetrates at a much slower rate. For
instance, the temperature distribution at 40 ms under a
higher compressed pressure (Fig. 13c) is very similar
to that at 20 ms under a lower compressed pressure
(Fig. 10b).
Compared with Fig. 13, Fig. 14 shows the laminar
simulation for the creviced piston at a similar com-
pressed pressure of 39.9 bar at TDC. At the end of
compression, apart from minor nonuniformity at the
center, the effect of the vortex is practically nonex-
istent. At the postcompression time of 100 ms, the
vortex effect eventually reaches the central plane of
the chamber. Similar features are observed in the ex-
perimental results. However, the laminar calculations
predict an earlier onset time of the temperature inho-
mogeneity, as the experimental results do not observe
any apparent vortex effect until 114 ms post compres-
sion.
In addition, the effect of pressure on the vortex for-
mation for the creviced piston is consistent in both the
experimental and computational results. Increase in
pressure reduces the effect of the vortex. For a flat pis-
ton, although such a pressure effect cannot be clearly
observed in the experimental data, it is demonstrated
in the computational results. The effect of pressure
on the vortex roll-up and the induced temperature in-
homogeneity can be attributed to the change in the
thermal diffusivity. At a higher compressed gas pres-
sure, the mixture thermal diffusivity is lower, thereby
leading to a thinner thermal boundary layer. Since
temperature inhomogeneity is induced by the shear-
ing of cold gases from the boundary to the interior of
the cylindrical chamber, a thinner boundary layer un-
der high compressed gas pressures will slow down the
development of the temperature inhomogeneity.
6. Assessment of the adiabatic core hypothesis
The adiabatic core hypothesis is based on the as-
sumption that the effect of heat loss due to the cham-
ber wall does not affect the temperature of the core re-
gion at the short time scales encountered in an RCM.
From the present experimental results using both flat
16.
G. Mittal, C.-J.Sung / Combustion and Flame 145 (2006) 160–180 175
Fig. 12. STAR-CD simulation of temperature and velocity fields at varying times after compression for a creviced piston at a
pressure of 11.9 bar at TDC under laminar condition.
and creviced piston heads, the validity of the adiabatic
core hypothesis can be clearly identified.
For the case of flat piston at a low pressure, at
the end of compression (Fig. 5a) there is large tem-
perature gradient at the center of the chamber, while
the rest of the chamber is not much affected. How-
ever, at the post compression time of 6 ms (Fig. 5b),
the temperature gradient is present across the entire
17.
176 G. Mittal,C.-J. Sung / Combustion and Flame 145 (2006) 160–180
Fig. 13. STAR-CD simulation of temperature field at varying times after compression for a flat piston at a pressure of 40.7 bar
at TDC under laminar condition.
domain of the chamber and the effect of rolled-up
cold gases has spread everywhere. Therefore, at 0 ms
there is a possibility that the adiabatic core assump-
tion may hold, but the actual temperature quickly be-
gins to deviate from the adiabatic core temperature.
From 6 ms onward, the failure of the adiabatic core
hypothesis is expected. For the flat piston at a high
compressed pressure, the temperature gradient across
the entire chamber is observed at 15.8 ms postcom-
pression (Fig. 6c).
For the case of creviced piston at a high pressure,
even at 114 ms post compression (Fig. 8f), the ef-
fect of the vortex is not observed. This suggests the
validity of the adiabatic core assumption up to this
time when using the creviced piston at high pressures.
However, at low pressures, the validity of the adia-
batic core hypothesis may not be as good.
Similar features regarding the validity of adia-
batic core hypothesis are also observed in the com-
putational results. Fig. 15 plots the time evolution
of the pressure and the maximum temperature, ob-
tained from the simulations employing different con-
ditions and piston head configurations. In addition,
the temperature profile calculated by using the adi-
abatic core hypothesis is also shown and compared.
In Fig. 15, the temperature based on the adiabatic
core hypothesis is deduced from the corresponding
simulated pressure trace. At the end of compression
(0 ms), the core temperature predicted by the hypoth-
esis exactly matches with the maximum temperature
of the CFD analysis. For the flat piston, however,
the computed maximum temperature using the lam-
inar model, shown in Figs. 15a and 15b, quickly be-
gins to significantly deviate from the temperature of
the adiabatic core assumption as the postcompres-
sion time proceeds. When the turbulent simulation
is used, Fig. 15c shows that a larger overprediction
resulting from the adiabatic core assumption is ob-
served. In contrast, for the creviced head piston the
adiabatic core hypothesis accurately predicts the max-
imum temperature for a long period of postcompres-
sion time, as shown in Figs. 15d, 15e, and 15f.
Fig. 16 compares the extent of the core region
from the end of compression simulated using two dif-
ferent piston head configurations, for both laminar
and turbulent calculations. Here the core region is de-
fined as the ratio of the volume of the chamber that
is within 5% of the maximum instantaneous temper-
18.
G. Mittal, C.-J.Sung / Combustion and Flame 145 (2006) 160–180 177
Fig. 14. STAR-CD simulation of temperature field at varying times after compression for a creviced piston at a pressure of
39.9 bar at TDC under laminar condition.
ature to the total volume of the chamber at the end
of compression. For the case of creviced piston, only
the main cylinder volume, apart from the crevice, is
considered for the core region calculation. Note that
the core region may not be the geometric center of the
chamber, but the region of the maximum temperature.
For the flat piston at low pressure of 12.8 bar at
TDC, while at the end of compression (time = 0 ms)
the core region encompasses approximately 70% of
the volume of the chamber, it rapidly reduces to
35% at 20 ms and continues to reduce as the post-
compression time proceeds. The present simulation
also demonstrates that although relatively large gas
volume is at adiabatic core temperature at the end of
compression, the heat transport rates from this core
region are not low. The failure of the adiabatic core
assumption after the end of compression results from
the high gas velocity field in a small confined cham-
ber. This can be understood from the time evolution
of the maximum gas velocity from the end of com-
pression, as shown in Fig. 17. Significantly higher
velocities with the flat head piston in comparison to
the creviced piston are seen in Fig. 17. High gas ve-
locities at the end of compression quickly bring the
effect of wall into the core region.
For the flat piston at a high pressure of 40.7 bar
at TDC, Fig. 16a shows that the extent of the core re-
gion is relatively larger than that at a low compressed
pressure of 12.8 bar. In contrast, with the creviced
piston, the extent of core is significantly increased.
Fig. 16b further demonstrates the effect of the turbu-
lence on the extent of the core region. In general, the
effect of turbulent mixing lowers the temperature of
the core region while increases its spatial extent. It
should be noted that under both laminar and turbu-
lent conditions the primary reason for the failure of
the adiabatic core hypothesis is due to the mixing of
cold gases sheared from the wall boundary with the
core region, rather than the heat loss from cold wall
itself.
Fig. 17 also illustrates that the use of a creviced
piston head substantially reduces gas velocity at the
end of compression. As a result, the temperature
predicted by the adiabatic core hypothesis matches
closely with the actual maximum temperature for long
time interval, as shown in Fig. 15. Additionally, the
19.
178 G. Mittal,C.-J. Sung / Combustion and Flame 145 (2006) 160–180
Fig. 15. Assessment of the adiabatic core hypothesis based on computational results. Pressure at TDC is indicated in the figure.
Dashed line, solid line, and line with symbols respectively represent pressure, calculated temperature using the adiabatic core
hypothesis, and actual maximum temperature in the chamber.
extent of the core region is greatly improved, as seen
in Fig. 16. Since the determination of the core tem-
perature in an RCM is typically indirect, the present
numerical experiments therefore demonstrate that it is
extremely important to have proper operating condi-
tions and geometric configuration of the test chamber
so that the adiabatic core hypothesis is valid.
Although various RCMs have different operating
conditions of clearance, stroke, etc., similar features
of aerodynamics as observed in this study are ex-
pected. Depending upon the extent of the vortex ef-
fect, various RCMs would vary in terms of the validity
of the adiabatic core hypothesis after the end of com-
pression, although such a hypothesis is expected to be
accurate at TDC. This would explain the discrepan-
cies in the reported experimental data from different
RCMs, even under similar compressed conditions.
7. Effect of the piston head configuration on
ignition delay
It has been shown in Fig. 2 that under similar
conditions the use of different piston head configu-
rations can lead to different ignition delay. In order to
address the reasons, additional simulations and exper-
iments are carried out based on the same compressed
gas temperature and pressure for a flat and a creviced
piston head configurations. To achieve the same con-
dition at the end of compression, the clearance is
increased to account for the absence of the crevice
volume in the flat piston case.
Fig. 18 shows the numerical comparison using ni-
trogen. Although pressure and temperature at TDC
are the same for both piston head configurations, the
rate of pressure drop for the creviced piston is higher
than that for the flat piston. This result is attributed to
20.
G. Mittal, C.-J.Sung / Combustion and Flame 145 (2006) 160–180 179
Fig. 16. Extent of the core region, calculated from com-
putational results, as a function of postcompression time.
(a) Effect of pressure and piston head configuration using
the laminar model. (b) Effect of turbulence. Pressure at TDC
is indicated in the figure. Solid line: laminar calculation.
Dashed line: turbulent calculation.
Fig. 17. Time variation of the maximum velocity in the cylin-
der from the end of compression for laminar calculation. The
pressure at TDC is indicated in the figure.
the larger surface area to volume ratio for the creviced
piston case. Crevice is a zone of small volume but
large surface area, which accelerates the rate of heat
loss to the wall. Due to the higher postcompression
pressure in the case of the flat piston, the core temper-
ature calculated by the adiabatic core hypothesis is
also higher. However, it is seen from Fig. 18 that the
computed maximum temperature for the flat head pis-
ton case can become lower than that for the creviced
head piston case. Consistent with the computational
Fig. 18. Computational results on the effect of piston head
configuration under the same conditions of temperature and
pressure at TDC. Cases of a flat and a creviced piston head
configurations with nitrogen as the test gas are shown.
Fig. 19. Comparison of measured pressure profiles for
iso-octane autoignition experiments using a flat and a
creviced piston head configurations. Composition: iC8H18/
O2/inert = 1/12.5/47. The adiabatic core temperature at
TDC is indicated in the figure. Solid line: flat piston. Dashed
line: creviced piston.
results shown in Figs. 15–17, for the flat piston case
the adiabatic core assumption is not valid, and the
significant effect of the roll-up vortex decreases the
core temperature, despite of higher postcompression
pressure. The resulting lower core temperature than
that determined based on the adiabatic core hypoth-
esis and the higher postcompression pressure for the
use of the flat piston will in turn affect the autoigni-
tion delay.
Fig. 19 compares the experimental pressure traces
using stoichiometric iso-octane/O2/inert gas mixtures
for both piston head configurations under similar
composition, compressed gas temperature, and TDC
pressure. Results for three different adiabatic core
temperatures, namely 684, 745, and 878 K at TDC,
are compared in Fig. 19. Both the single-stage (878 K)
and the two-stage (684 and 745 K) ignition phenom-
ena are clearly shown. Although the compressed pres-
sures at TDC match quite well for both pistons, it is
seen in Fig. 19 that the postcompression pressure for
21.
180 G. Mittal,C.-J. Sung / Combustion and Flame 145 (2006) 160–180
the flat piston is higher, as demonstrated by the com-
putational results. The combined effect of the lower
core temperature than that calculated using the adia-
batic core hypothesis and the higher postcompression
pressure for the flat piston case alters the ignition de-
lay as depicted in Fig. 19.
8. Conclusions
The purpose of this work is to investigate the ef-
fects of aerodynamics on the measured properties
within a rapid compression machine. Such an un-
derstanding is important in order to unambiguously
characterize the state of the reacting mixture and to
explain the reasons for the mismatch of ignition delay
data obtained from various RCMs. Experimental and
computational studies are conducted for a flat and a
creviced piston head configurations. Experimental re-
sults using PLIF of acetone demonstrate the suitabil-
ity of a creviced piston to provide a homogeneous re-
acting core. Computational results under laminar con-
ditions closely reproduce the features of the aerody-
namics that are observed in the experiment. For a flat
piston, although the adiabatic core assumption accu-
rately predicts the temperature at the end of compres-
sion, it significantly overpredicts the postcompression
temperature as the effect of fast-moving cold gases
quickly spreads all over the chamber. A creviced pis-
ton head is found to significantly increase the extent
of the core region. Therefore, when using a properly
designed creviced piston, the postcompression tem-
perature can be accurately predicted based on the adi-
abatic core hypothesis. It is also observed that the ef-
fect of the roll-up vortex is reduced as the compressed
pressure is increased.
The present results demonstrate that using a
creviced piston design, the actual temperature in an
RCM can be deduced from the pressure trace. From
the kinetic modeling point of view, unambiguous de-
termination of the temperature is the prime require-
ment, as the heat loss associated with an RCM can
be easily accounted for by using an empirical rela-
tion. This work suggests that when a properly de-
signed creviced piston is used, a zero-dimensional
model should satisfactorily model the experimental
results using an RCM. However, when a flat piston
is employed, the use of a zero-dimensional model
to simulate the experimental data is deemed inade-
quate.
Acknowledgment
This work was supported by the National Science
Foundation under Grant No. 0133161.
References
[1] J.F. Griffiths, Q. Jiao, A. Schreiber, J. Meyer, K.F.
Knoche, W. Kardylewski, Combust. Flame 93 (1993)
303–315.
[2] J. Clarkson, J.F. Griffiths, J.P. Macnamara, B.J.
Whitaker, Combust. Flame 125 (2001) 1162–1175.
[3] D. Lee, S. Hochgreb, Combust. Flame 114 (1998) 531–
545.
[4] C.K. Westbrook, W.J. Pitz, J.E. Boercker, H.J. Curran,
J.F. Griffiths, C. Mohamed, M. Ribaucour, Proc. Com-
bust. Inst. 29 (2002) 1311–1318.
[5] S. Tanaka, F. Ayala, J.C. Keck, Combust. Flame 133
(2003) 467–481.
[6] M. Ribaucour, R. Minetti, L.R. Sochet, H.J. Curran,
W.J. Pitz, C.K. Westbrook, Proc. Combust. Inst. 28
(2000) 1671–1678.
[7] R. Minetti, M. Carlier, M. Ribaucour, E. Therssen, L.R.
Sochet, Proc. Combust. Inst. 26 (1996) 747–753.
[8] E.J. Silke, H.J. Curran, J.M. Simmie, Proc. Combust.
Inst. 30 (2005) 2639–2647.
[9] J.F. Griffiths, J.P. MacNamara, C. Mohamed, B.J.
Whitaker, J. Pan, C.G.W. Sheppard, Faraday Dis-
cuss. 119 (2001) 287–303.
[10] J.F. Griffiths, J.P. MacNamara, C.G.W. Sheppard, D.A.
Turton, B.J. Whitaker, Fuel 81 (2002) 2219–2225.
[11] P. Desgroux, L. Gasnot, L.R. Sochet, Appl. Phys. B 61
(1995) 69–72.
[12] P. Desgroux, R. Minetti, L.R. Sochet, Combust. Sci.
Technol. 113 (1996) 193–203.
[13] M.T. Donovan, X. He, B.T. Zigler, T.R. Palmer, M.S.
Wooldridge, A. Atreya, Combust. Flame 137 (2004)
351–365.
[14] J. Würmel, J.M. Simmie, Combust. Flame 141 (2005)
417–430.
[15] G. Mittal, C.J. Sung, Combust. Sci. Technol., in press.
[16] R. Minetti, M. Ribaucour, M. Carlier, L.R. Sochet,
Combust. Sci. Technol. 113–114 (1996) 179–191.
[17] M.C. Thurber, F. Grisch, R.K. Hanson, Opt. Lett. 22
(1997) 251–253.
[18] M.C. Thurber, F. Grisch, B.J. Kirby, M. Votmeier, R.K.
Hanson, Appl. Opt. 37 (1998) 4963–4978.
[19] Star-CD, Version 3.20 User Guide.
![Combustion and Flame 145 (2006) 160–180
www.elsevier.com/locate/combustflame
Aerodynamics inside a rapid compression machine
Gaurav Mittal, Chih-Jen Sung ∗
Department of Mechanical and Aerospace Engineering, Case Western Reserve University, Cleveland, OH 44106, USA
Received 9 May 2005; received in revised form 11 October 2005; accepted 22 October 2005
Available online 15 December 2005
Abstract
The aerodynamics inside a rapid compression machine after the end of compression is investigated using planar
laser-induced fluorescence (PLIF) of acetone. To study the effect of reaction chamber configuration on the resulting
aerodynamics and temperature field, experiments are conducted and compared using a creviced piston and a flat
piston under varying conditions. Results show that the flat piston design leads to significant mixing of the cold
vortex with the hot core region, which causes alternate hot and cold regions inside the combustion chamber.
At higher pressures, the effect of the vortex is reduced. The creviced piston head configuration is demonstrated
to result in drastic reduction of the effect of the vortex. Experimental conditions are also simulated using the
Star-CD computational fluid dynamics package. Computed results closely match with experimental observation.
Numerical results indicate that with a flat piston design, gas velocity after compression is very high and the core
region shrinks quickly due to rapid entrainment of cold gases. Whereas, for a creviced piston head design, gas
velocity after compression is significantly lower and the core region remains unaffected for a long duration. As a
consequence, for the flat piston, adiabatic core assumption can significantly overpredict the maximum temperature
after the end of compression. For the creviced piston, the adiabatic core assumption is found to be valid even up
to 100 ms after compression. This work therefore experimentally and numerically substantiates the importance of
piston head design for achieving a homogeneous core region inside a rapid compression machine.
2005 The Combustion Institute. Published by Elsevier Inc. All rights reserved.
Keywords: Rapid compression machine; PLIF of acetone; Adiabatic core hypothesis; Computational fluid dynamics;
Autoignition
1. Introduction
In a rapid compression machine (RCM) study, pri-
mary experimental data consist of the pressure trace
of a given reacting mixture. A typical pressure trace
before autoignition taking place shows a rapid rise in
pressure during the compression stroke, which is of
the order of 15–40 ms, followed by a gradual decrease
in pressure due to heat loss from a constant-volume
* Corresponding author.
E-mail address: cjs15@po.cwru.edu (C.-J. Sung).
chamber at the end of compression. Although in prin-
ciple RCM simulates a single compression event,
complex aerodynamic features can affect the state of
the reacting core in the reaction chamber. Previous
studies (e.g., [1–3]) have shown that the motion of the
piston creates a roll-up vortex, which results in mix-
ing of the cold gas pockets from the boundary layer
with the hot gases in the core region. Such undesired
mixing leads to difficulties in accurately characteriz-
ing the state of the reacting mixture.
In modeling the RCM experiments, for simplicity
it is often assumed that the aerodynamic effects do
not play any significant role at the short time scales
0010-2180/$ – see front matter 2005 The Combustion Institute. Published by Elsevier Inc. All rights reserved.
doi:10.1016/j.combustflame.2005.10.019](https://image.slidesharecdn.com/doi10-250922072821-65d73e2a/85/doi_10-1016_j-combustflame-2005-10-019-pdf-1-320.jpg)
![Combustion and Flame 145 (2006) 160–180
www.elsevier.com/locate/combustflame
Aerodynamics inside a rapid compression machine
Gaurav Mittal, Chih-Jen Sung ∗
Department of Mechanical and Aerospace Engineering, Case Western Reserve University, Cleveland, OH 44106, USA
Received 9 May 2005; received in revised form 11 October 2005; accepted 22 October 2005
Available online 15 December 2005
Abstract
The aerodynamics inside a rapid compression machine after the end of compression is investigated using planar
laser-induced fluorescence (PLIF) of acetone. To study the effect of reaction chamber configuration on the resulting
aerodynamics and temperature field, experiments are conducted and compared using a creviced piston and a flat
piston under varying conditions. Results show that the flat piston design leads to significant mixing of the cold
vortex with the hot core region, which causes alternate hot and cold regions inside the combustion chamber.
At higher pressures, the effect of the vortex is reduced. The creviced piston head configuration is demonstrated
to result in drastic reduction of the effect of the vortex. Experimental conditions are also simulated using the
Star-CD computational fluid dynamics package. Computed results closely match with experimental observation.
Numerical results indicate that with a flat piston design, gas velocity after compression is very high and the core
region shrinks quickly due to rapid entrainment of cold gases. Whereas, for a creviced piston head design, gas
velocity after compression is significantly lower and the core region remains unaffected for a long duration. As a
consequence, for the flat piston, adiabatic core assumption can significantly overpredict the maximum temperature
after the end of compression. For the creviced piston, the adiabatic core assumption is found to be valid even up
to 100 ms after compression. This work therefore experimentally and numerically substantiates the importance of
piston head design for achieving a homogeneous core region inside a rapid compression machine.
2005 The Combustion Institute. Published by Elsevier Inc. All rights reserved.
Keywords: Rapid compression machine; PLIF of acetone; Adiabatic core hypothesis; Computational fluid dynamics;
Autoignition
1. Introduction
In a rapid compression machine (RCM) study, pri-
mary experimental data consist of the pressure trace
of a given reacting mixture. A typical pressure trace
before autoignition taking place shows a rapid rise in
pressure during the compression stroke, which is of
the order of 15–40 ms, followed by a gradual decrease
in pressure due to heat loss from a constant-volume
* Corresponding author.
E-mail address: cjs15@po.cwru.edu (C.-J. Sung).
chamber at the end of compression. Although in prin-
ciple RCM simulates a single compression event,
complex aerodynamic features can affect the state of
the reacting core in the reaction chamber. Previous
studies (e.g., [1–3]) have shown that the motion of the
piston creates a roll-up vortex, which results in mix-
ing of the cold gas pockets from the boundary layer
with the hot gases in the core region. Such undesired
mixing leads to difficulties in accurately characteriz-
ing the state of the reacting mixture.
In modeling the RCM experiments, for simplicity
it is often assumed that the aerodynamic effects do
not play any significant role at the short time scales
0010-2180/$ – see front matter 2005 The Combustion Institute. Published by Elsevier Inc. All rights reserved.
doi:10.1016/j.combustflame.2005.10.019](https://image.slidesharecdn.com/doi10-250922072821-65d73e2a/75/doi_10-1016_j-combustflame-2005-10-019-pdf-1-2048.jpg)
![G. Mittal, C.-J. Sung / Combustion and Flame 145 (2006) 160–180 161
encountered in the RCM. It is further assumed that
the core gas, away from the thermal boundary layer,
is compressed adiabatically. Thus, temperature evolu-
tion is determined from the measured pressure pro-
file by assuming the adiabatic core hypothesis. Based
on this hypothesis, the core temperature at any in-
stant during compression, T (t), can be determined
from the experimentally measured pressure, P(t), ac-
cording to the relation
T (t)
T0
γ
γ −1
dT
T = ln[P(t)/P0],
where P0 is the initial pressure, T0 the initial tem-
perature, and γ the specific heat ratio. Furthermore,
to model the RCM data, the computed pressure vari-
ation needs to match with the experimental pressure
trace by including an empirically determined heat
transfer coefficient or volume expansion with a zero-
dimensional model [4–6]. However, substantial dis-
crepancies have been observed between data taken
from different rapid compression machines even un-
der similar conditions of temperature and pressure
[7,8]. These discrepancies are attributed partly to the
different heat loss characteristics after the end of the
compression stroke and partly to the difference in
aerodynamics between various machines.
The effect of aerodynamics is particularly more
complicated because it does not show up in the pres-
sure trace and it may lead to significant temperature
gradients and ultimately to the failure of the adiabatic
core hypothesis. If the aerodynamic effect becomes
significant and the adiabatic core hypothesis fails,
there is no easy way to determine the temperature
inside the reaction chamber. As a result, unambigu-
ous determination of the state of the reacting mixture
and systematic characterization of the resulting aero-
dynamic field inside an RCM are important for ob-
taining reliable kinetic data from RCMs and bridging
the gap between data taken from different machines.
Several studies have contributed to the understand-
ing of the aerodynamics and temperature field inside
an RCM by computational fluid dynamics (CFD) cal-
culations and experimental measurements. Griffiths et
al. [1] numerically showed that the hot core region
generated at the end of compression is virtually adia-
batic and spans approximately 70% of the volume of
the combustion chamber at the end of compression.
Griffiths et al. [1] also observed differences between
computational results using spatially uniform condi-
tions and CFD simulation. Differences between two
sets of computations were attributed to the effect of
temperature gradient that was accounted for in CFD
analysis [1]. In the recent study of Clarkson et al. [2],
the temperature field was imaged by Rayleigh scatter-
ing and laser-induced fluorescence (LIF) of acetone.
Acetone-LIF was found to nicely characterize the
temperature variations in the RCM, whereas Rayleigh
scattering was relatively less sensitive [2]. It was ex-
perimentally observed that the roll-up vortex had pen-
etrated the center of the combustion chamber at the
end of compression [2]. The temperature difference
between the hot gases and the roll-up vortex was esti-
mated to be 50 K [2]. Furthermore, LIF of acetone
generated by decomposition of di-t-butyl peroxide
unambiguously showed the temperature stratification
at the center of the reaction chamber [2].
Griffiths et al. [9] investigated temperature and
concentration fields in a rapid compression machine
by using a number of experimental techniques, in-
cluding Schlieren photography, planar laser-induced
fluorescence (PLIF) of acetone, PLIF of formalde-
hyde, and chemiluminescence imaging. In order to
illustrate the interaction of chemistry with the temper-
ature field in the RCM, Griffiths et al. [9] contrasted
the combustion behavior of di-t-butyl peroxide with
that of n-pentane. The overall reaction of the former is
characteristic of thermal ignition, while the combus-
tion of the latter was investigated in the compressed
temperature range exhibiting a negative temperature
dependence of the overall reaction rate. With imag-
ing being taken up to 10 ms after the end of com-
pression, results showed that the di-t-butyl peroxide
reaction proceeded faster in the zone of peak temper-
ature [9]. Somewhat similar behavior was observed
for n-pentane combustion when the compressed tem-
perature was at the lower end of the negative tempera-
ture dependence range [9]. By contrast, at compressed
temperatures close to the upper end of the nega-
tive temperature dependence region, the reaction in
the cooler zone developed faster and the temperature
inhomogeneity inside the reaction chamber rapidly
smoothed out [9]. However, Griffiths et al. [9] pointed
out that spatial inhomogeneity of concentrations of
intermediates can be there, which would affect the
eventual evolution of spontaneous ignition.
Griffiths et al. [10] used chemiluminescence imag-
ing along with filtered Rayleigh scattering in a rapid
compression machine to characterize the transition
from nonknocking to knocking reaction and the evo-
lution of the spatial development of the reactivity.
Results from filtered Rayleigh scattering gave evi-
dence of a cooler core region at compressed tem-
peratures below the negative temperature depen-
dence region [10]. In contrast, Rayleigh scattering
did not show a cooler core at compressed tempera-
tures within the region of negative temperature de-
pendence. Hence, the effect of the negative tempera-
ture dependence of reaction rate is to smooth out the
temperature inhomogeneity inside the reaction cham-
ber [10].
Lee and Hochgreb [3] theoretically demonstrated
that the roll-up vortex due to the piston motion can be
counteracted by deliberately machining a crevice into
the side of the piston. Creviced piston allowed more
accurate predictions of the reacting temperature from](https://image.slidesharecdn.com/doi10-250922072821-65d73e2a/85/doi_10-1016_j-combustflame-2005-10-019-pdf-2-320.jpg)
![162 G. Mittal, C.-J. Sung / Combustion and Flame 145 (2006) 160–180
pressure–time records. Predictions of a simple heat
transfer model in conjunction with a creviced piston
were found to agree well with experimental pressure
history [3].
Desgroux et al. [11,12] made direct measurements
of temperature in an RCM using thermocouple and
single point Rayleigh scattering. These measurements
confirmed the existence of an adiabatic core gas at
the end of compression. Rayleigh scattering measure-
ments were made with a temperature accuracy of 3–
4%, but after the end of compression the local temper-
ature exhibited a standard deviation of 10–15% [11].
Desgroux et al. [12] conducted fine-wire thermocou-
ple measurements for nonreactive and reactive mix-
tures at different radial locations. They observed a
uniform temperature field for a few milliseconds af-
ter the end of compression and subsequent develop-
ment of temperature inhomogeneity due to heat loss
to the wall and gas recirculation [12]. For nonreactive
mixtures the temperature inhomogeneity persisted af-
ter compression, whereas for reactive iso-octane mix-
tures a temperature-leveling effect, ascribed to the
negative temperature coefficient of reaction rate, was
observed [12].
Donovan et al. [13] took direct thermocouple mea-
surement in a free-piston rapid compression facility to
assess the adiabatic core hypothesis. Measurements
were corrected for slower response of the thermocou-
ple. Donovan et al. [13] asserted that experimental
measurements at the end of the compression stroke
justified the adiabatic core gas assumption. However,
the thermocouple measurements failed to give a true
representation of temperature after the end of com-
pression because of the failure of the model used to
correct the time response of the thermocouple [13].
Recently, Würmel and Simmie [14] conducted
CFD studies of a twin-piston rapid compression ma-
chine using Star-CD. From the CFD simulations, the
piston head crevices were optimized for the twin-
piston RCM in terms of volume, location, and the di-
mension and geometry of the channel connecting the
crevice and the chamber. The channel connecting the
crevice and the chamber was optimized and the ideal
geometry was found to be rectangular [14]. An an-
gled channel design was seen to help somewhat in the
cooling of the trapped gas in the piston head crevice.
Würmel and Simmie [14] also observed strong depen-
dence of the crevice performance on the test gas used.
Specifically, although an optimal crevice was identi-
fied for test gases such as nitrogen, oxygen, and argon,
it was not possible when using helium, due to the as-
sociated high heat loss. Instead of helium, the use of
xenon as a bath gas for RCM experiments was recom-
mended [14].
The present investigation aims to extend the previ-
ous efforts by experimentally and numerically study-
ing the effect of the piston head geometry on aerody-
namics and temperature field inside an RCM. It has
implications for kinetic modeling in the sense that
how well the prediction of the adiabatic core hypoth-
esis matches with the actual temperature in the reac-
tion chamber for a long time duration after the end of
compression. Requirement of experimental data, par-
ticularly under the conditions of homogeneous charge
compression ignition (HCCI) operation, requires the
ability to sustain unambiguous reaction conditions for
longer times. This is so because the relevant HCCI
conditions are extremely lean or highly diluted, which
significantly increases the ignition delay times. There-
fore, it is particularly important to characterize the
state of the aerodynamics and the resultant tempera-
ture field for long time duration after the end of com-
pression stroke.
In the present work, temperature field inside an
RCM is studied using planar laser-induced fluores-
cence (PLIF) of acetone. Laser diagnostic technique
in an RCM offers many advantages in comparison to
the thermocouple measurements. Thermocouple mea-
surements suffers from the drawback that one cannot
readily obtain information about instantaneous spa-
tial variation of temperature. Moreover, there will be
aerodynamic disturbances if the thermocouple probe
is not sufficiently fine [12]. Additionally, correction
of the measured temperature due to the slow time re-
sponse of the thermocouple requires knowledge of the
velocity field inside the chamber. The validity of the
model used to determine the velocity field and cor-
rect for time response may be under question. By
resorting to a longer compression time, as conducted
in [12], while the effect of thermal inertia of the ther-
mocouple can be minimized, aerodynamics at long
compression times may not be a true representation
of what happens at short compression times. In con-
trast, temperature mapping using the laser techniques
is practically nonintrusive and is capable of giving in-
stantaneous spatially resolved temperature field.
Both a flat piston and a creviced piston are em-
ployed and compared in the present study. These ex-
periments will demonstrate whether the uniformity of
the temperature field is indeed improved by using a
creviced piston, as suggested by the earlier theoret-
ical study [3]. The present investigation is particu-
larly useful because experiments are conducted on the
same RCM. The mapping of the temperature field is
carried out for two different piston head configura-
tions under varying operating conditions for a long
time duration after the compression. In order to in-
vestigate the effect of the piston geometry on ignition
delay, experiments are also conducted for autoigni-
tion of iso-octane using both piston head configura-
tions. In addition, numerical simulations are carried
out using Star-CD CFD package. Computed results](https://image.slidesharecdn.com/doi10-250922072821-65d73e2a/85/doi_10-1016_j-combustflame-2005-10-019-pdf-3-320.jpg)
![G. Mittal, C.-J. Sung / Combustion and Flame 145 (2006) 160–180 163
further provide insights into the nature of the aerody-
namics inside an RCM. Based on these experimental
and computational studies, conditions under which
the adiabatic core hypothesis can be satisfactorily ap-
plied are delineated.
In the following sections we will first highlight
the features of the RCM employed herein. Experi-
mental specifics for the ignition delay measurements
and PLIF of acetone are then described, followed by
experimental and numerical results on the characteri-
zation of aerodynamics inside the RCM.
2. Experimental
2.1. Rapid compression machine
Fig. 1 shows the schematic of the present RCM
system that consists of a driver piston, reactor piston,
hydraulic motion control chamber, and a driving air
tank. The driver cylinder has a bore of 5 in. (12.7 cm)
and that of the reactor cylinder is 2 in. (5.08 cm).
The machine is pneumatically driven and hydrauli-
cally stopped. Stroke can be varied between 7 and
10 in. (17.78 and 25.4 cm) by adjusting the spacers
on the hydraulic cylinder. Clearance is also adjustable
and can be varied by using split shims between the
hydraulic cylinder head and the reactor cylinder. Fur-
ther details of the present rapid compression machine
can be found in [15]. The cylindrical reaction cham-
ber is equipped with the sensing devices for pressure
and temperature, gas inlet/outlet ports for preparing
the reactant mixture, and quartz windows for optical
access. Dynamic pressure during compression is mea-
sured using Kistler 6125B transducer with a 5010B
charge amplifier.
In order to study the effect of the piston head de-
sign on aerodynamics in an RCM, experiments are
conducted for two different piston head configura-
tions: a creviced piston and a simulated flat piston.
An enlarged view of the configuration of the creviced
piston head is also shown in Fig. 1. The location of
the crevice is on the cylindrical surface of the piston
and the piston face is kept flat. On the other hand, the
term “flat piston” indicates a piston that does not have
a crevice along its cylindrical periphery and hence is
flat on the face and along the piston circumference. In
the present study, the flat piston head is simulated by
filling the crevice volume with a pack of o-rings. This
filling results in approximately 90% reduction in the
crevice volume and gives an almost flat piston.
Two sets of experiments are conducted and com-
pared using both piston head configurations. First,
ignition delays for stoichiometric iso-octane/oxygen/
inert gas mixtures are measured in the temperature
range of 684 to 878 K, from which the effect of piston
Fig. 1. Schematic of the rapid compression machine (RCM), the creviced piston head configuration, and the acetone-PLIF setup.
Dimensions of the creviced piston in mm: A = 0.50, B = 4.0, C = 0.15, D = 20.0, and E = 1.50.](https://image.slidesharecdn.com/doi10-250922072821-65d73e2a/85/doi_10-1016_j-combustflame-2005-10-019-pdf-4-320.jpg)
![164 G. Mittal, C.-J. Sung / Combustion and Flame 145 (2006) 160–180
head configuration on autoignition is demonstrated.
Second, PLIF imaging of acetone for temperature
field mapping is carried out under conditions of rel-
atively low pressure (approximately 12 bar) and high
pressure (approximately 39.5 bar). These experiments
also provide insights into the effect of pressure on the
resulting temperature field inside the rapid compres-
sion machine.
2.2. PLIF of acetone
For the characterization of the temperature field,
laser-induced fluorescence of acetone tracer in nitro-
gen is studied from the end of the compression stroke.
The mixture consists of 1 to 2% (by concentration)
acetone and remaining nitrogen. The schematic of the
PLIF imaging setup is also depicted in Fig. 1. An ap-
proximately 5-mm-wide laser sheet with a waist of
50 µm is made to traverse the central plane of the
combustion chamber, which is equidistant from the
reactor piston face and the end of the chamber. The
combustion chamber is equipped with two 0.66-in.
(1.67-cm) diameter optically flat quartz windows for
the traversal of the laser sheet. The end of the cham-
ber is fitted with a 2-in. (5.08-cm) diameter and 1.7-
in. (4.318-cm) thick quartz window, which provides
full view of the combustion chamber for fluorescence
imaging. An intensified CCD camera (Princeton In-
struments, PI-MAX, 1024 × 256 pixels) with a UV
lens (Nikon, f = 105 mm) is placed perpendicular
to the laser sheet in order to record the fluorescence
images. A WG305 (Schott) filter is used to filter scat-
tered light from the fluorescence signal. A frequency-
doubled Continuum Nd:YAG system is used in con-
junction with a dye laser filled with Rhodamine 590
solution. The resulting laser energy at wavelength of
279 nm is around 8 mJ/pulse.
The synchronization of the laser firing with ma-
chine is achieved in the following manner. The laser
is continuously fired at a repetition rate of 10 Hz. The
signal generated from the start of the ICCD camera
acquisition is used to actuate a relay after a speci-
fied time delay. Actuation of the relay fires the RCM.
A subsequent laser pulse, which occurs after the end
of compression, provides the pumping source for the
induced fluorescence. The timings of laser pulses and
pressure trace of RCM are simultaneously recorded
using a data acquisition system, which allows accu-
rate determination of the timing of laser pulse relative
to the end of compression. After every experiment,
the laser optics is realigned to correct for any minor
movement of the machine as a result of firing. Since
the repetition rate of the laser system is 10 Hz, PLIF
images are single-shot measurements.
Fig. 2. Ignition delay time versus the adiabatic core tem-
perature at TDC for stoichiometric iso-octane/oxygen/inert
mixtures. Composition: iC8H18/O2/inert = 1/12.5/47. Ini-
tial conditions: P0 = 331 Torr and T0 = 297 K. The adi-
abatic core temperature at TDC is varied by changing the
composition of the inert gases.
3. Experimental results
3.1. Ignition delay
Experiments are generally conducted for a stroke
of 10 in. (25.4 cm) and clearance of 0.525 in.
(1.33 cm). Time for the compression stroke is ap-
proximately 30 ms, and the geometric compression
ratio when using a creviced piston is 15.1. Fig. 2
shows a plot of ignition delay, measured in the present
RCM, versus the adiabatic core temperature at the
top dead center (TDC), Tc, for stoichiometric iso-
octane/oxygen/inert gas mixtures. Based on the ex-
perimental pressure trace, Tc is calculated according
to
Tc
T0
γ
γ −1
dT
T = ln[Pc/P0], where Pc is the com-
pressed pressure at TDC. Experiments are conducted
using a flat piston and a creviced piston. For a given
piston head configuration, the adiabatic core temper-
ature is varied by changing the composition of the
inert gases (argon and nitrogen), while keeping a fixed
compression ratio. Results of the present work are
also compared with the experimental data of Minetti
et al. [16] under similar conditions of pressure, com-
position, and equivalence ratio. For the creviced pis-
ton, the initial pressure and the initial temperature are
kept fixed at 331 Torr and 297 K, respectively. For
the flat piston, clearance is increased to compensate
for the absence of the crevice so that the conditions
at TDC are identical to those for the creviced piston
when same initial conditions of pressure, temperature,
and composition are used. This results in adiabatic
core temperature at TDC ranging from 684 to 878 K
and pressure at TDC varying from 13.3 to 16.25 bar.
In spite of similar conditions, Fig. 2 demonstrates
substantial discrepancies among different sets of ex-
perimental data. This comparison shows that not only
the data from different RCMs under similar test con-](https://image.slidesharecdn.com/doi10-250922072821-65d73e2a/85/doi_10-1016_j-combustflame-2005-10-019-pdf-5-320.jpg)
![G. Mittal, C.-J. Sung / Combustion and Flame 145 (2006) 160–180 165
ditions may be different, but also for the same RCM
there may be significant differences depending upon
the configuration of the piston head and the final re-
acting volume. Furthermore, it is seen from Fig. 2 that
when a flat piston is used, ignition delays are sig-
nificantly reduced as compared to those obtained by
using a creviced piston. It is therefore expected that
changing from a creviced piston head to a flat piston
head significantly affects the heat loss and the result-
ing aerodynamics inside the RCM, and the effect re-
flects in the form of considerable change in ignition
delay. This example is presented here to highlight the
importance of the piston head configuration effect on
ignition delay.
3.2. Acetone fluorescence
The acetone fluorescence signal can be highly sen-
sitive to temperature. At 279 nm excitation, fluores-
cence signal reduces by 42% as temperature increases
from 600 to 800 K [17,18]. Fig. 3 shows a represen-
tative single-shot PLIF image of a homogeneous ace-
tone/nitrogen mixture at room temperature of 297 K
and pressure of 44 bar, along with the associated pho-
ton count integrated along the width of the laser sheet.
For this experiment, a mixture of acetone and nitrogen
at an initial pressure of 2.91 bar is gradually com-
pressed by slowly moving the reactor piston. Such
compression is nearly isothermal because the com-
pressed gases are allowed to cool down to the room
temperature. After the desired compressed pressure
is reached, the fluorescence measurement is subse-
quently taken. Laser sheet enters from the right side
of the image. The location of cylinder wall is also
shown in the figure. Decay in the fluorescence signal
Fig. 3. A representative single-shot acetone-PLIF image and
the associated photon counts integrated along the width of
the laser sheet. Chamber conditions: pressure = 44 bar and
temperature = 297 K. Laser sheet enters from the right side
of the image.
from right to left is because of strong absorption. Ac-
cording to the Beer–Lambert law, in a homogeneous
field with uniform temperature and concentration, sig-
nal decays exponentially due to absorption of the laser
intensity. By correcting for absorption and incorporat-
ing for temperature sensitivity of fluorescence signal,
it is possible to determine the resultant temperature
field from fluorescence signal. Parameters for tem-
perature sensitivity of acetone fluorescence are taken
from Thurber et al. [17,18].
Using the fluorescence intensity shown in Fig. 3,
Fig. 4 demonstrates the procedure for deducing the
temperature distribution. In Fig. 4, radial direction
equal to 0 corresponds to the central axis of the cylin-
drical chamber, while 2.54 and −2.54 cm represent
the cylinder wall on either side. Moreover, the dot-
ted line is the actual fluorescence signal, while the
dashed line represents the exponential decay in the
fluorescence intensity, as calculated using the Beer–
Lambert law and the known temperature of 297 K.
In addition, the deduced temperature distribution is
denoted by the solid line. It is seen from Fig. 4 that
in a uniform temperature field, signal follows the ex-
ponential decay feature and the deduced temperature
nicely predicts the temperature distribution. In Fig. 4,
the deduced temperature is noted to be within ±4 K,
which is within 1.35% of the actual temperature. This
gives an estimate of the uncertainty of the deduced
temperature due to the noise in the fluorescence sig-
nal.
When there exists temperature nonuniformity in
the chamber, knowledge of the temperature at one
anchor point is required to deduce the temperature
distribution from the fluorescence signal. Relative to
this anchor point, temperature along the radial direc-
tion can subsequently be deduced by knowing the
temperature dependence of the fluorescence intensity.
Fig. 4. Temperatures deduced from the fluorescence signal.
Chamber conditions: pressure = 44 bar and temperature =
297 K. Dotted line: raw fluorescence intensity. Dashed line:
calculated fluorescence intensity using the Beer–Lambert
law. Solid line: deduced temperature distribution.](https://image.slidesharecdn.com/doi10-250922072821-65d73e2a/85/doi_10-1016_j-combustflame-2005-10-019-pdf-6-320.jpg)
![166 G. Mittal, C.-J. Sung / Combustion and Flame 145 (2006) 160–180
However, such an anchor temperature is difficult to be
measured during the actual RCM experiment. In the
present work, the maximum temperature in the cham-
ber at any time instant is taken as the adiabatic core
temperature, calculated from the pressure trace based
on the expression
T (t)
T0
γ
γ −1
dT
T = ln[P(t)/P0].
The procedure to deduce the temperature distribu-
tion from the integrated fluorescence intensity profile
is as follows. An anchor point in the fluorescence in-
tensity profile is first arbitrarily chosen at some pixel
inside the chamber and given a temperature value
equal to the adiabatic core temperature derived from
the experimental pressure trace at that instant. Sub-
sequently, the temperatures at other radial locations
are determined by marching radially in both direc-
tions toward the wall from this anchor point. While
marching radially, correction for absorption is con-
ducted according to the Beer–Lambert law. Accord-
ing to this law, attenuation in the laser intensity (I)
as the laser traverses a length dx is expressed as
I/I0 = exp(−σndx), where I0 is the incident laser
intensity, σ is the absorption coefficient, and n repre-
sents the acetone number density. At each marching
step, after correcting for the absorption, the temper-
ature is calculated from the knowledge of the tem-
perature dependence of the fluorescence intensity, for
which data is taken from Thurber et al. [17,18]. By
marching radially from the first chosen anchor point,
the temperature distribution along the entire domain
of the chamber is therefore deduced. If the result-
ing maximum temperature in the chamber is higher
than the adiabatic core temperature, the temperature
of the anchor point is reduced for the next iteration.
The iteration procedure continues until the maximum
deduced temperature in the chamber equals the adia-
batic core temperature.
It has to be pointed out that the assumption of the
maximum temperature being equal to the adiabatic
core temperature does not affect the pattern of the de-
duced temperature in any way. If the actual maximum
temperature is somewhat lower than the adiabatic core
temperature, the entire temperature profile would shift
downward, without affecting the pattern of the tem-
perature distribution.
3.3. Flat piston
3.3.1. Low compressed gas pressure
Fig. 5 shows the experimental results conducted at
an initial pressure of 236 Torr and an initial temper-
ature of 297 K using the simulated flat piston. The
mixture consists of 2% acetone in nitrogen. At the
end of compression, the gas pressure and tempera-
ture are 12.5 bar and 780 K, respectively. Again, the
raw fluorescence signal is shown as the dotted line
and the deduced temperature is denoted as the solid
line. Exponential decay of the fluorescence intensity,
as may be observed in a uniform temperature field, is
shown as the dashed line. Time 0 is taken as the end
of the compression stroke. The fluorescence signal
at 1 ms after compression shows increased intensity
in the central portion of the chamber. Any deviation
of fluorescence signal from exponential decay is in-
dicative of temperature inhomogeneity. In addition,
any hump corresponds to reduced temperature, while
any depression indicates an increase in the tempera-
ture. At 1 ms, an increased fluorescence intensity in
the central portion is due to the effect of the roll-up
vortex, which brings in cold gases from the bound-
ary layer to the center of the chamber. In the tem-
perature field, this increase in fluorescence intensity
corresponds to approximately 100 K reduction in the
temperature. At 6 ms postcompression, as we go from
the wall to the centerline, there are alternating cold
and hot regions. Apart from the temperature reduction
of approximately 50 K in the central regime, there is
another zone of low temperature near the wall. The
reason for this type of temperature nonuniformity will
be discussed later on along with the discussion of
computational results.
At time steps of 8 and 18 ms, the width of the cen-
tral depression zone increases due to thermal trans-
port, whereas the temperature difference associated
with this depression decreases. In addition, the ef-
fect of the side depression becomes more pronounced.
Similar features are observed in the temperature field
at subsequent time steps. Even at a long time scale
of 129 ms, sharp temperature gradients exist in the
chamber. Furthermore, these PLIF results are consis-
tent with those of previous studies [2,9].
Since only one PLIF measurement can be im-
aged during every run of the RCM, aerodynamic fea-
tures captured at the specified time instance may vary
slightly in different runs. For instance, at 19 ms in
Fig. 5, instead of depression in the temperature dis-
tribution at the center, a peak in the center and two
adjacent zones of low temperature are observed. This
would suggest that the cold gases flowing across the
piston head did not reach the center of the chamber
from either direction. Although slightly different pat-
tern may be observed in different runs even at the
same reference time after compression, it does not al-
ter the conclusion that the use of the flat piston leads
to substantial temperature nonuniformity due to the
effect of the roll-up vortex. In general, PLIF experi-
ments are found to give fairly repeatable temperature
distribution.
3.3.2. High compressed gas pressure
Fig. 6 illustrates another set of experimental re-
sults using the simulated flat piston, with an initial
pressure of 700 Torr and an initial temperature of](https://image.slidesharecdn.com/doi10-250922072821-65d73e2a/85/doi_10-1016_j-combustflame-2005-10-019-pdf-7-320.jpg)
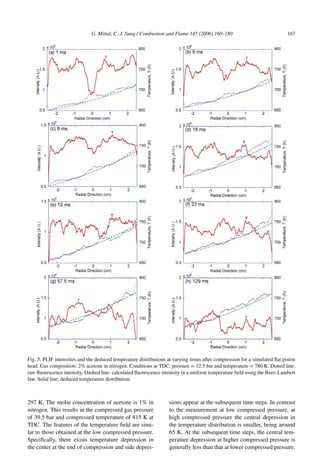
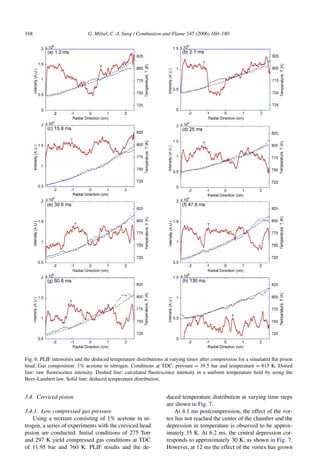
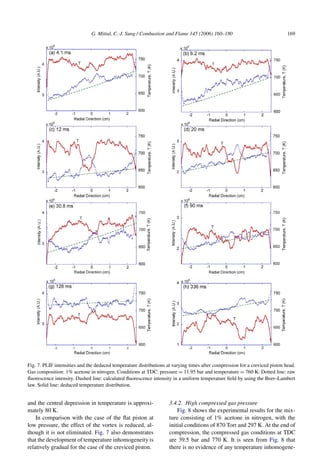
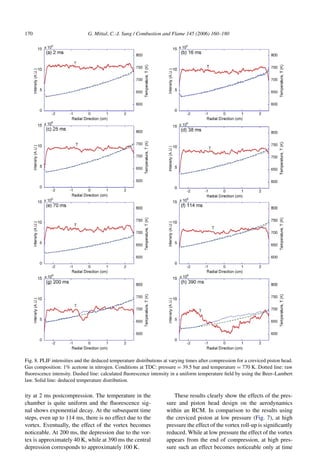
![G. Mittal, C.-J. Sung / Combustion and Flame 145 (2006) 160–180 171
greater than 114 ms postcompression. Furthermore, in
comparison to the results using the flat piston at high
pressure, the creviced piston at high pressure yields
a much higher degree of homogeneity inside the test
chamber for long time duration.
4. Numerical analysis
Star-CD CFD package is used to simulate the ex-
perimental conditions and provide insights into the
detailed evolution of the aerodynamic field inside an
RCM. As with the experimental tests, simulation is
conducted for conditions of low, intermediate, and
high compressed gas pressures, and for the flat as well
as the creviced piston head configurations.
Because of the cylindrically symmetric geometry
of the combustion chamber, numerical simulation is
carried out on an axisymmetric grid distribution. In
the actual physical situation in the RCM, flow may de-
viate from axisymmetric behavior and exhibit asym-
metrical patterns. However, axisymmetric configura-
tion is nevertheless chosen because it considerably
reduces the computational time while capturing the
essentials of the underlying fluid dynamics. Compu-
tations are performed from the beginning of the com-
pression stroke with a compression time of 30 ms.
Initially, the test gas, nitrogen, at rest is specified with
uniform temperature and pressure. A constant temper-
ature of 297 K and no slip condition are specified at
the cylinder wall boundary and piston surface.
In the simulation, the piston starts from rest and
its motion is given in a manner similar to the pis-
ton motion in an engine, by specifying dimensions for
the crank radius and the connecting rod length. This
specification of velocity profile is consistent with the
operation of the present RCM, in which the piston ac-
celerates from rest initially, eventually decelerates at
a constant rate, and comes to a stop due to the hy-
draulic stopping mechanism. Furthermore, by varying
the crank radius and the length of the connecting rod
in the CFD calculations, it is observed that as long as
the compression time is kept constant, the resulting
flow field is insensitive to reasonable changes in the
velocity profile. This observation is consistent with
the finding of Würmel and Simmie [14]. At top dead
center, the piston comes to rest and remains there
for subsequent time steps. A time step of 55.55 µs
is taken, as further reduction of the time step by a
factor of two results in identical solution. During the
compression stroke, the vertex filling methodology of
Star-CD [19] is chosen for the motion of the grid. In
this method, the same number of grids is maintained
between the cylinder head and the piston head, but the
grids become compressed as the piston moves. After
the end of the compression stroke, the computational
Fig. 9. Computational grid distribution for a creviced piston
at the end of compression. All length dimensions are in mm.
grids remain the same for the post compression pe-
riod.
The computational grid distribution employed for
the creviced piston configuration at the end of com-
pression is shown in Fig. 9. The main reaction cham-
ber consists of 100 grids in the radial direction and
140 grids in the axial direction. In the radial direc-
tion, the finer grids are used near the boundary. In the
axial direction, an accordion distribution is used, with
the finer grids near the piston and cylinder head and
the coarser grids in between. In order to ascertain the
quality of the grid distribution, selective cases are cal-
culated on a finer grid distribution of 150 ×200 in the
radial and axial directions, respectively. The use of
the finer grids results in an identical flow pattern and
less than 0.25% change in predicted temperature. As
a result, all the computed results shown herein are ob-
tained on a 100 × 140 grid distribution.
In addition, calculations are performed and com-
pared for both laminar and turbulent flow conditions.
Since it cannot be easily ascertained a priori whether
the postcompression flow field inside an RCM is lam-
inar or turbulent, it is important to perform calcula-
tions using both laminar and turbulent models, and
assess their predictions by comparing with the exper-
imental results. Various turbulent models are consid-
ered. A standard version of the k–ε model is found to
yield extremely high turbulent mixing. On the other
hand, calculations using a RNG model yield relatively
less turbulent mixing and are found to be closer to the
experimental observation in comparison to the results
obtained using the k–ε model. Furthermore, computa-
tional results show that the features of aerodynamics
are better predicted by laminar calculations, while the
actual aerodynamic pattern is expected to be some-](https://image.slidesharecdn.com/doi10-250922072821-65d73e2a/85/doi_10-1016_j-combustflame-2005-10-019-pdf-12-320.jpg)
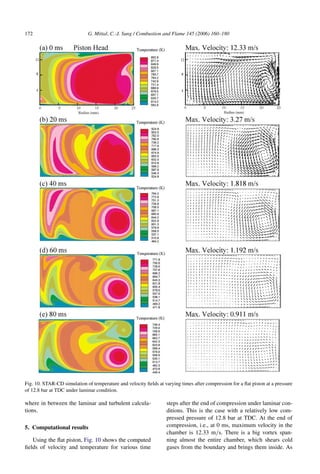
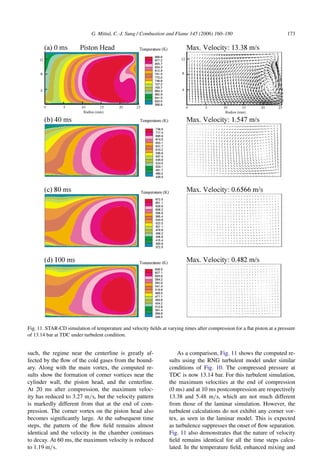
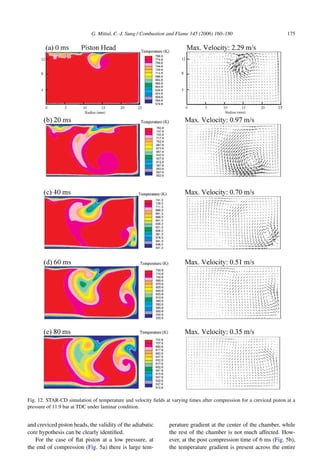
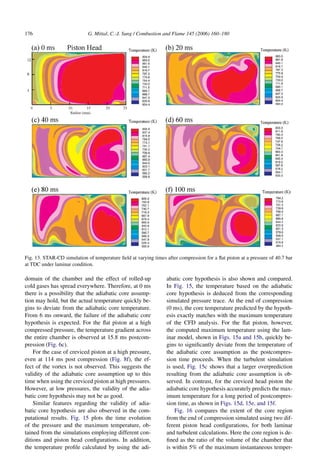
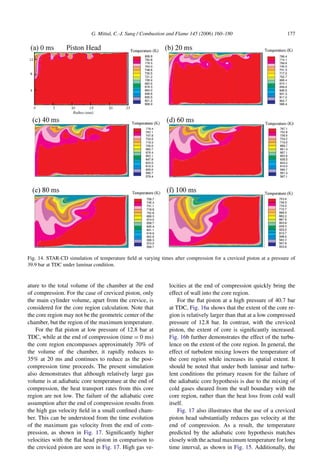
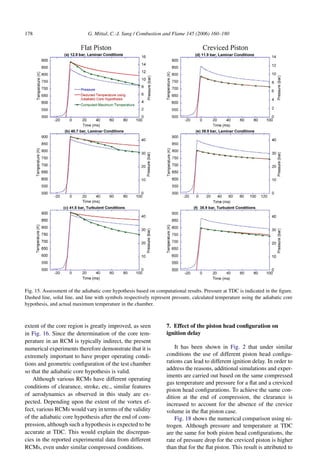
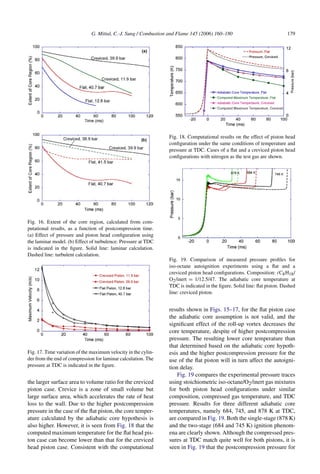
![180 G. Mittal, C.-J. Sung / Combustion and Flame 145 (2006) 160–180
the flat piston is higher, as demonstrated by the com-
putational results. The combined effect of the lower
core temperature than that calculated using the adia-
batic core hypothesis and the higher postcompression
pressure for the flat piston case alters the ignition de-
lay as depicted in Fig. 19.
8. Conclusions
The purpose of this work is to investigate the ef-
fects of aerodynamics on the measured properties
within a rapid compression machine. Such an un-
derstanding is important in order to unambiguously
characterize the state of the reacting mixture and to
explain the reasons for the mismatch of ignition delay
data obtained from various RCMs. Experimental and
computational studies are conducted for a flat and a
creviced piston head configurations. Experimental re-
sults using PLIF of acetone demonstrate the suitabil-
ity of a creviced piston to provide a homogeneous re-
acting core. Computational results under laminar con-
ditions closely reproduce the features of the aerody-
namics that are observed in the experiment. For a flat
piston, although the adiabatic core assumption accu-
rately predicts the temperature at the end of compres-
sion, it significantly overpredicts the postcompression
temperature as the effect of fast-moving cold gases
quickly spreads all over the chamber. A creviced pis-
ton head is found to significantly increase the extent
of the core region. Therefore, when using a properly
designed creviced piston, the postcompression tem-
perature can be accurately predicted based on the adi-
abatic core hypothesis. It is also observed that the ef-
fect of the roll-up vortex is reduced as the compressed
pressure is increased.
The present results demonstrate that using a
creviced piston design, the actual temperature in an
RCM can be deduced from the pressure trace. From
the kinetic modeling point of view, unambiguous de-
termination of the temperature is the prime require-
ment, as the heat loss associated with an RCM can
be easily accounted for by using an empirical rela-
tion. This work suggests that when a properly de-
signed creviced piston is used, a zero-dimensional
model should satisfactorily model the experimental
results using an RCM. However, when a flat piston
is employed, the use of a zero-dimensional model
to simulate the experimental data is deemed inade-
quate.
Acknowledgment
This work was supported by the National Science
Foundation under Grant No. 0133161.
References
[1] J.F. Griffiths, Q. Jiao, A. Schreiber, J. Meyer, K.F.
Knoche, W. Kardylewski, Combust. Flame 93 (1993)
303–315.
[2] J. Clarkson, J.F. Griffiths, J.P. Macnamara, B.J.
Whitaker, Combust. Flame 125 (2001) 1162–1175.
[3] D. Lee, S. Hochgreb, Combust. Flame 114 (1998) 531–
545.
[4] C.K. Westbrook, W.J. Pitz, J.E. Boercker, H.J. Curran,
J.F. Griffiths, C. Mohamed, M. Ribaucour, Proc. Com-
bust. Inst. 29 (2002) 1311–1318.
[5] S. Tanaka, F. Ayala, J.C. Keck, Combust. Flame 133
(2003) 467–481.
[6] M. Ribaucour, R. Minetti, L.R. Sochet, H.J. Curran,
W.J. Pitz, C.K. Westbrook, Proc. Combust. Inst. 28
(2000) 1671–1678.
[7] R. Minetti, M. Carlier, M. Ribaucour, E. Therssen, L.R.
Sochet, Proc. Combust. Inst. 26 (1996) 747–753.
[8] E.J. Silke, H.J. Curran, J.M. Simmie, Proc. Combust.
Inst. 30 (2005) 2639–2647.
[9] J.F. Griffiths, J.P. MacNamara, C. Mohamed, B.J.
Whitaker, J. Pan, C.G.W. Sheppard, Faraday Dis-
cuss. 119 (2001) 287–303.
[10] J.F. Griffiths, J.P. MacNamara, C.G.W. Sheppard, D.A.
Turton, B.J. Whitaker, Fuel 81 (2002) 2219–2225.
[11] P. Desgroux, L. Gasnot, L.R. Sochet, Appl. Phys. B 61
(1995) 69–72.
[12] P. Desgroux, R. Minetti, L.R. Sochet, Combust. Sci.
Technol. 113 (1996) 193–203.
[13] M.T. Donovan, X. He, B.T. Zigler, T.R. Palmer, M.S.
Wooldridge, A. Atreya, Combust. Flame 137 (2004)
351–365.
[14] J. Würmel, J.M. Simmie, Combust. Flame 141 (2005)
417–430.
[15] G. Mittal, C.J. Sung, Combust. Sci. Technol., in press.
[16] R. Minetti, M. Ribaucour, M. Carlier, L.R. Sochet,
Combust. Sci. Technol. 113–114 (1996) 179–191.
[17] M.C. Thurber, F. Grisch, R.K. Hanson, Opt. Lett. 22
(1997) 251–253.
[18] M.C. Thurber, F. Grisch, B.J. Kirby, M. Votmeier, R.K.
Hanson, Appl. Opt. 37 (1998) 4963–4978.
[19] Star-CD, Version 3.20 User Guide.](https://image.slidesharecdn.com/doi10-250922072821-65d73e2a/85/doi_10-1016_j-combustflame-2005-10-019-pdf-21-320.jpg)


