Download to read offline
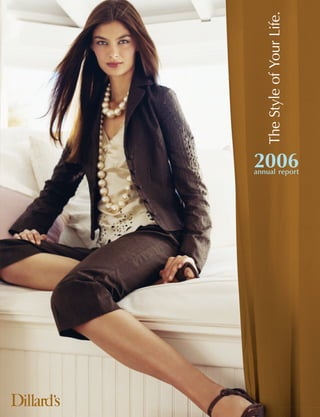


The document is Dillard's, Inc.'s 2006 annual report. It discusses Dillard's strong financial results in 2006, including record earnings per share. It attributes this success to changes made to improve its merchandise mix and appeal to customers seeking upscale, contemporary fashion. These changes included launching a new branding campaign called "Dillard's - The Style of Your Life" and focusing on presenting fashionable merchandise from recognized national brands. Going forward, Dillard's plans to open nine new stores in 2007 and continue strengthening customer relationships through an emphasis on fashion, quality, and value.