1. Digital
Media
Report
October
2016
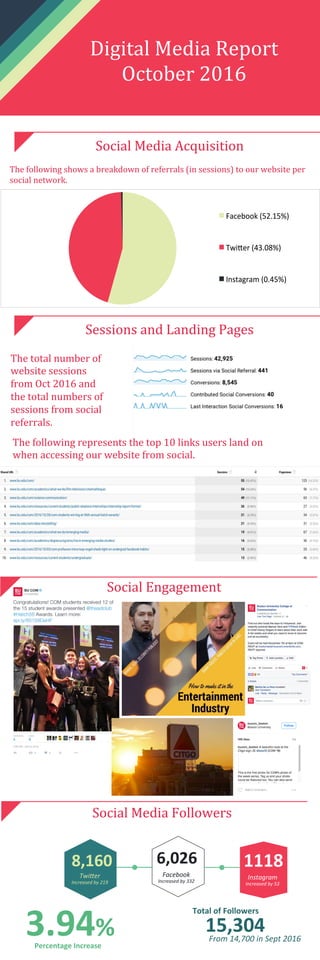
Social
Media
Acquisition
Sessions
and
Landing
Pages
Social
Media
Followers
Facebook((52.15%)(
Twi3er((43.08%)(
Instagram((0.45%)(
8,160
Twi$er
Increased
by
219
6,026
Facebook
Increased
by
332
1118
Instagram
Increased
by
53
3.94%
Percentage
Increase
Total
of
Followers
15,304
From
14,700
in
Sept
2016
The
following
shows
a
breakdown
of
referrals
(in
sessions)
to
our
website
per
social
network.
The
following
represents
the
top
10
links
users
land
on
when
accessing
our
website
from
social.
The
total
number
of
website
sessions
from
Oct
2016
and
the
total
numbers
of
sessions
from
social
referrals.
Social
Engagement
2. Analysis
On
Instagram,
we
started
a
COM
Photo
of
the
Week
series.
The
photo
with
the
highest
amount
of
likes
this
month,
was
the
first
photo
in
that
series.
The
post
messaging
also
encouraged
students
to
send
in
their
own
photos.
We
have
received
at
least
20
submissions
of
photos
from
COM
students.
These
photos
have
consistently
been
the
most
engaged
photos
on
our
Instagram
account.
We
started
designing
and
creaDng
Facebook
and
TwiFer
ads.
This
has
boosted
our
social
following
in
a
significant
way.
We
had
a
1.76%
increase
in
social
following
in
September
2016
and
this
past
month
we
had
a
3.49%
increase.
This
is
about
twice
as
much
in
follower
growth
than
last
month.
I
created
a
social
media
ad
strategy
that
outlines
our
ad
strategy.
So
far
we’ve
had
a
7.8%
increase
in
followers
across
our
channels,
I
hope
to
get
this
to
over
10%.