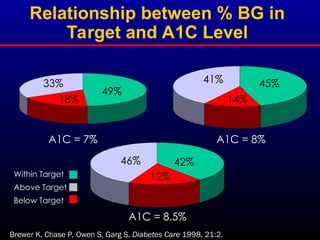
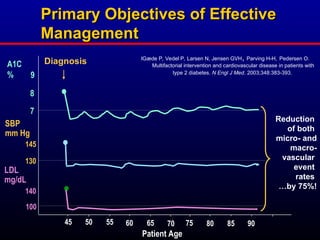
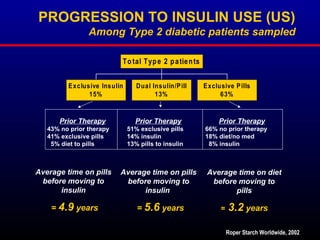
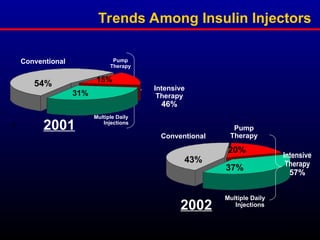
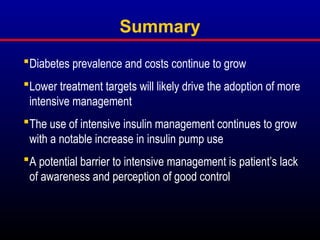
Diabetes Update
Facts, Trends and Observations
Bruce Bode, MD, FACE
Atlanta Diabetes Associates
Ultimate Goals Of Diabetes
Treatment
Sustained Normal Blood
Glucose Control
Lowest Incidence of
Hypoglycemia
No Long Term Diabetes
Complications
No Acute Diabetes
Complications
=
=
Best Quality of Life with a
Chronic Disease
Relative Risk of Progression of
Diabetic Complications
DCCT Research Group, N Engl J Med 1993, 329:977-986.
1
3
5
7
9
11
13
15
6 7 8 9 10 11 12
Retinop
Neph
Neurop
RELATIVE
RISK
Mean A1C
• Gain of 15.3 years of complication free
living compared to conventional
therapy
• Gain of 5.1 years of life compared to
conventional therapy
Lifetime Benefits of
Intensive Therapy (DCCT)
DCCT Study Group, JAMA 1996, 276:1409-1415.
DCCT
DCCT
• 10% reduction in HbA1c
• 43% reduced risk of retinopathy
progression
• 18% increased risk of severe
hypoglycemia with coma and/or
seizure
DCCT Research Group, N Engl J Med 1993, 329:977-986.
*Percent risk reduction per 0.9% decrease in HbA1C; UKPDS. Lancet. 1998;352:837-853.
Lowering A1C Reduces Risk
of Complications
of Complications
Reduction
in
risk
(%)*
p=0.029
p=0.0099
p=0.052
p=0.015
p=0.000054
0
-10
-20
-30
-40
-50
-12
-25
-16
-34
-21
Any diabetes-related
endpoint
Microvascular
endpoint
MI
Retinopathy
Albuminuria at 12
years
United Kingdom Prospective Diabetes Study
(UKPDS)
(UKPDS)
New Targets of
Intensive Diabetes Management
Near-normal glycemia
• A1C less than 6.5%
• Post-prandial: <140 mg/dl
Avoid short-term crisis
• Hypoglycemia
• Hyperglycemia
• DKA
Minimize long-term complications
Improve QOL
ADA: Clinical Practice Recommendations, 2001.
AACE and EASD
DCCT Research Group, N Engl J Med 1993, 329:977-986.
How Are We Doing?
U.S. Diabetes Prevalence
— Diabetes kills 1 American
every 3 minutes
— New case diagnosed every
40 seconds
— More deaths than AIDS
and breast cancer
combined
— Average life expectancy:
15 years less than non-
diabetes population
— Afflicts over 177 million
people worldwide
— 300 million afflicted by
2025
18 Million
World View
• 177 million worldwide
• 4th leading cause of death by disease
• India 33 million people with diabetes
• China 23 million people with diabetes
• Population of diabetes will double to triple
by 2025
• One out of every three Americans born
today will develop diabetes
Time magazine December 2003; CDC
$92
$109
$138
$40
$47
$54
$132
$156
$192
$0
$40
$80
$120
$160
$200
$240
Direct Indirect Total
2002
2010
2020
Diabetes Care 26:917-932, 2003
Costs Continue to Increase (U.S.)
Percentage of Patients With Diabetes
Having A1C <7%
Harris MI, et al. Diabetes Care. 1999;22:403-408.
0
20
40
60
80
100
Diet alone Oral agents Insulin
US Adults With Diagnosed Diabetes in 1988-94
NHANES III
73
38
26
Whole
population
45
Percent
at goal
Therapy used
Lessons from the DCCT and UKPDS:
Sustained Intensification of Therapy is Difficult
DCCT EDIC
(Type 1)
UKPDS (Type 2),
Insulin Group
DCCT/EDIC Research Group. New Engl J Med 2000; 342:381-389
Steffes M et al. Diabetes 2001; 50 (suppl 2):A63
UK Prospective Diabetes Study Group (UKPDS) 33
Lancet 1998; 352:837-853
4
6
8
10
9.0
8.1
7.3
7.9
0 6.5 + 4 + 6 yrs
DCCT EDIC
0
6
7
8
0 2 4 6 8 10 yrs
A1C (%)
Normal
Baseline
A1C (%)
Relationship between % BG in
Target and A1C Level
Brewer K, Chase P, Owen S, Garg S, Diabetes Care 1998, 21:2.
Within Target
Above Target
Below Target
33%
18%
49%
A1C = 7%
A1C = 8.5%
46%
12%
42%
A1C = 8%
41%
14%
45%
Primary Objectives of Effective
Management
Management
A1C
%
SBP
mm Hg
LDL
mg/dL
45 50 55 60 65 70 75 80 85 90
9
Diagnosis
8
7
130
100
145
140
Patient Age
Reduction
of both
micro- and
macro-
vascular
event
rates
…by 75%!
lGæde P, Vedel P, Larsen N, Jensen GVH, Parving H-H, Pedersen O.
Multifactorial intervention and cardiovascular disease in patients with
type 2 diabetes. N Engl J Med. 2003;348:383-393.
How is diabetes currently
being treated?
Roper Starch Worldwide
• “Gold Standard” market research study of
diabetes patients 18 years and older
• Self reported information
• Conducted annually in the U.S.
• N= 6,000
Roper Starch Worldwide, 2002
PROGRESSION TO INSULIN USE (US)
Among Type 2 diabetic patients sampled
Prior Therapy Prior Therapy Prior Therapy
43% no prior therapy 51% exclusive pills 66% no prior therapy
41% exclusive pills 14% insulin 18% diet/no med
5% diet to pills 13% pills to insulin 8% insulin
Average time on pills
before moving to
insulin
= 4.9 years
Average time on diet
before moving to
pills
= 3.2 years
Average time on pills
before moving to
insulin
= 5.6 years
Exclusive Insulin
15%
Dual Insulin/Pill
13%
Exclusive Pills
63%
To tal Type 2 patients
Roper Starch Worldwide, 2002
Trends Among Insulin Injectors
Intensive
Therapy
46%
Pump
Therapy
Multiple Daily
Injections
2001
Conventional
54%
Intensive
Therapy
57%
Pump
Therapy
Multiple Daily
Injections
2002
Conventional
%
Roper Starch Worldwide, 2002
20%
37%
43%
31%
15%
ADA Physician Reported Treatment Choices
Based on aggregate responses (N=213)
23% Conventional (1-2 shots/day)
57% Intensive(3 or more shots/day)
20% Insulin Pump Therapy
Insulin Treated Patients
ADA 2003, Physician Survey, Medtronic MiniMed
26,500
43,000
81,000
162,000
200,000
0
50,000
100,000
150,000
200,000
'95 '97 '99 2001 2003
Total Patients Using Insulin Pumps
Estimated figures for 2003
Other Possible Contributions to
Intensive Management
PATIENT ATTITUDES AND
BEHAVIORS
DEMOGRAPHICS (US)
By education and income
%
EDUCATION
High School or less College
Roper Starch Worldwide, 2002
%
INCOME LEVEL
< $35K $35K - $75K > $100K
HCPs Frequently Visited By Patients
TYPE 1
%
TYPE 2
%
Roper Starch Worldwide, 2002
“What type of healthcare professional do you normally
visit for your diabetes care?”
Most Feel That They Are In Good Control
Needs improvement
Good control
Roper Starch Worldwide, 2002
“Are you satisfied with your diabetes control?”
81
19
US
% incidence
within total
sample
Most Patients Are Satisfied With Their Health
86
71
72
0
20
40
60
80
100
US
Satisfied with overall health T1 T2
Roper Starch Worldwide, 2002
Self-Reported A1C Results
0%
5%
10%
15%
20%
25%
30%
35%
40%
45%
50%
4.1-5.0 5.1-6.0 6.1-7.0 7.1-8.0 8.1-9.0 9.1-10.0 10.1-
11.0
Over
11.0
Don't
Know
T1
T2
Roper Starch Worldwide, 2002
Summary
Diabetes prevalence and costs continue to grow
Lower treatment targets will likely drive the adoption of more
intensive management
The use of intensive insulin management continues to grow
with a notable increase in insulin pump use
A potential barrier to intensive management is patient’s lack
of awareness and perception of good control

Diabetes Update(Bode - Atlanta).pptDiabetes Update(Bode

  • 1.
    Diabetes Update Facts, Trendsand Observations Bruce Bode, MD, FACE Atlanta Diabetes Associates
  • 2.
    Ultimate Goals OfDiabetes Treatment Sustained Normal Blood Glucose Control Lowest Incidence of Hypoglycemia No Long Term Diabetes Complications No Acute Diabetes Complications = = Best Quality of Life with a Chronic Disease
  • 3.
    Relative Risk ofProgression of Relative Risk of Progression of Diabetic Complications Diabetic Complications DCCT Research Group, N Engl J Med 1993, 329:977-986. 1 3 5 7 9 11 13 15 6 7 8 9 10 11 12 Retinop Neph Neurop RELATIVE RISK Mean A1C
  • 4.
    • Gain of15.3 years of complication free living compared to conventional therapy • Gain of 5.1 years of life compared to conventional therapy Lifetime Benefits of Lifetime Benefits of Intensive Therapy (DCCT) Intensive Therapy (DCCT) DCCT Study Group, JAMA 1996, 276:1409-1415.
  • 5.
    DCCT DCCT • 10% reductionin HbA1c • 43% reduced risk of retinopathy progression • 18% increased risk of severe hypoglycemia with coma and/or seizure DCCT Research Group, N Engl J Med 1993, 329:977-986.
  • 6.
    *Percent risk reductionper 0.9% decrease in HbA1C; UKPDS. Lancet. 1998;352:837-853. Lowering A1C Reduces Risk Lowering A1C Reduces Risk of Complications of Complications Reduction in risk (%)* p=0.029 p=0.0099 p=0.052 p=0.015 p=0.000054 0 -10 -20 -30 -40 -50 -12 -25 -16 -34 -21 Any diabetes-related endpoint Microvascular endpoint MI Retinopathy Albuminuria at 12 years United Kingdom Prospective Diabetes Study United Kingdom Prospective Diabetes Study (UKPDS) (UKPDS)
  • 7.
    New Targets of IntensiveDiabetes Management Near-normal glycemia • A1C less than 6.5% • Post-prandial: <140 mg/dl Avoid short-term crisis • Hypoglycemia • Hyperglycemia • DKA Minimize long-term complications Improve QOL ADA: Clinical Practice Recommendations, 2001. AACE and EASD DCCT Research Group, N Engl J Med 1993, 329:977-986.
  • 8.
    How Are WeDoing?
  • 9.
    U.S. Diabetes Prevalence U.S.Diabetes Prevalence — Diabetes kills 1 American every 3 minutes — New case diagnosed every 40 seconds — More deaths than AIDS and breast cancer combined — Average life expectancy: 15 years less than non- diabetes population — Afflicts over 177 million people worldwide — 300 million afflicted by 2025 18 Million
  • 10.
    World View • 177million worldwide • 4th leading cause of death by disease • India 33 million people with diabetes • China 23 million people with diabetes • Population of diabetes will double to triple by 2025 • One out of every three Americans born today will develop diabetes Time magazine December 2003; CDC
  • 11.
  • 12.
    Percentage of PatientsWith Diabetes Having A1C <7% Harris MI, et al. Diabetes Care. 1999;22:403-408. 0 20 40 60 80 100 Diet alone Oral agents Insulin US Adults With Diagnosed Diabetes in 1988-94 NHANES III 73 38 26 Whole population 45 Percent at goal Therapy used
  • 13.
    Lessons from theDCCT and UKPDS: Lessons from the DCCT and UKPDS: Sustained Intensification of Therapy is Difficult Sustained Intensification of Therapy is Difficult DCCT EDIC (Type 1) UKPDS (Type 2), Insulin Group DCCT/EDIC Research Group. New Engl J Med 2000; 342:381-389 Steffes M et al. Diabetes 2001; 50 (suppl 2):A63 UK Prospective Diabetes Study Group (UKPDS) 33 Lancet 1998; 352:837-853 4 6 8 10 9.0 8.1 7.3 7.9 0 6.5 + 4 + 6 yrs DCCT EDIC 0 6 7 8 0 2 4 6 8 10 yrs A1C (%) Normal Baseline A1C (%)
  • 14.
    Relationship between %BG in Target and A1C Level Brewer K, Chase P, Owen S, Garg S, Diabetes Care 1998, 21:2. Within Target Above Target Below Target 33% 18% 49% A1C = 7% A1C = 8.5% 46% 12% 42% A1C = 8% 41% 14% 45%
  • 15.
    Primary Objectives ofEffective Primary Objectives of Effective Management Management A1C % SBP mm Hg LDL mg/dL 45 50 55 60 65 70 75 80 85 90 9 Diagnosis 8 7 130 100 145 140 Patient Age Reduction of both micro- and macro- vascular event rates …by 75%! lGæde P, Vedel P, Larsen N, Jensen GVH, Parving H-H, Pedersen O. Multifactorial intervention and cardiovascular disease in patients with type 2 diabetes. N Engl J Med. 2003;348:383-393.
  • 16.
    How is diabetescurrently being treated?
  • 17.
    Roper Starch Worldwide •“Gold Standard” market research study of diabetes patients 18 years and older • Self reported information • Conducted annually in the U.S. • N= 6,000 Roper Starch Worldwide, 2002
  • 18.
    PROGRESSION TO INSULINUSE (US) Among Type 2 diabetic patients sampled Prior Therapy Prior Therapy Prior Therapy 43% no prior therapy 51% exclusive pills 66% no prior therapy 41% exclusive pills 14% insulin 18% diet/no med 5% diet to pills 13% pills to insulin 8% insulin Average time on pills before moving to insulin = 4.9 years Average time on diet before moving to pills = 3.2 years Average time on pills before moving to insulin = 5.6 years Exclusive Insulin 15% Dual Insulin/Pill 13% Exclusive Pills 63% To tal Type 2 patients Roper Starch Worldwide, 2002
  • 19.
    Trends Among InsulinInjectors Intensive Therapy 46% Pump Therapy Multiple Daily Injections 2001 Conventional 54% Intensive Therapy 57% Pump Therapy Multiple Daily Injections 2002 Conventional % Roper Starch Worldwide, 2002 20% 37% 43% 31% 15%
  • 20.
    ADA Physician ReportedTreatment Choices Based on aggregate responses (N=213) 23% Conventional (1-2 shots/day) 57% Intensive(3 or more shots/day) 20% Insulin Pump Therapy Insulin Treated Patients ADA 2003, Physician Survey, Medtronic MiniMed
  • 21.
    26,500 43,000 81,000 162,000 200,000 0 50,000 100,000 150,000 200,000 '95 '97 '992001 2003 Total Patients Using Insulin Pumps Estimated figures for 2003
  • 22.
    Other Possible Contributionsto Intensive Management PATIENT ATTITUDES AND BEHAVIORS
  • 23.
    DEMOGRAPHICS (US) By educationand income % EDUCATION High School or less College Roper Starch Worldwide, 2002 % INCOME LEVEL < $35K $35K - $75K > $100K
  • 24.
    HCPs Frequently VisitedBy Patients TYPE 1 % TYPE 2 % Roper Starch Worldwide, 2002 “What type of healthcare professional do you normally visit for your diabetes care?”
  • 25.
    Most Feel ThatThey Are In Good Control Needs improvement Good control Roper Starch Worldwide, 2002 “Are you satisfied with your diabetes control?” 81 19 US % incidence within total sample
  • 26.
    Most Patients AreSatisfied With Their Health 86 71 72 0 20 40 60 80 100 US Satisfied with overall health T1 T2 Roper Starch Worldwide, 2002
  • 27.
    Self-Reported A1C Results 0% 5% 10% 15% 20% 25% 30% 35% 40% 45% 50% 4.1-5.05.1-6.0 6.1-7.0 7.1-8.0 8.1-9.0 9.1-10.0 10.1- 11.0 Over 11.0 Don't Know T1 T2 Roper Starch Worldwide, 2002
  • 28.
    Summary Diabetes prevalence andcosts continue to grow Lower treatment targets will likely drive the adoption of more intensive management The use of intensive insulin management continues to grow with a notable increase in insulin pump use A potential barrier to intensive management is patient’s lack of awareness and perception of good control

Editor's Notes

  • #6 Lowering HbA1C Reduces Risk of Complications United Kingdom Prospective Diabetes Study (UKPDS) UKPDS, the largest and longest study of the benefits of tight glycemic control in patients with type 2 diabetes, has demonstrated that improved glucose control in patients with type 2 diabetes reduces the risk of developing retinopathy, nephropathy, and possibly neuropathy. In the UKPDS, newly diagnosed patients with type 2 diabetes were assigned either to conventional or intensive therapy. Conventional therapy began with dietary intervention, with the goal of therapy to maintain fasting plasma glucose below 270 mg/dL. If marked hyperglycemia or symptoms occurred, patients were secondarily randomized to treatment with sulfonylurea or insulin therapy, with the additional option of metformin in overweight patients. For those assigned to intensive therapy, the goal was to maintain a FPG <108 mg/dL. Non-overweight patients were randomly assigned to treatment with a sulfonylurea or insulin. Overweight patients were randomly assigned to one of the above options or metformin. Overall, the risk of any diabetes-related endpoint was reduced by 12% and the microvascular complications rate decreased by 25% in patients receiving intensive therapy. UKPDS. Lancet. 1998;352:837-853. Epidemiologic analysis showed a continuous relationship between the risk of microvascular complications and glycemia, suggesting that for every percentage point decrease in HbA1c there was a 35% reduction in the risk of microvascular complications. Matthews DR, et al. ADA. 1999, Abstract 0669.
  • #7 Goals of Intensive Diabetes Management glucose hypothesis: people without diabetes do not get diabetic complications achieving euglycemia is a means to and end: The end point of therapy is by normalization of glucose to prevent the occurrence of complications universally accepted due to irrefutable prospective studies studies demonstrated that glycemic control is both attainable and beneficial factors preventing this from being actualized hypoglycemia hyperglycemia DKA quality of life of the individual must be maintained throughout the therapy REF: ADA: Clinical Practice Recommendations, 2001.  
  • #13 Slide Index 00030 DISCUSSION POINTS: Click 1: DCCT and EDIC data in left panel: Left panel shows data from a sub-group of patients who had been in the intensive group during the DCCT and continued in EDIC, a long-term follow-up of the DCCT This sub-group began the DCCT with an average HbA1c of 9.0% [first bar], and ended the study with a mean of 7.3% [second bar]. After the DCCT ended, patients returned to community-based diabetes management and were followed for an additional 4 [third bar, blue] and 6 [last bar, blue] years. As can be seen by the increasing HbA1c in the last 2 blue bars, these patients had difficulty sustaining HbA1c improvements achieved during the DCCT. Click 2: UKPDS data appears in right panel The right panel shows data from the insulin-treated group of the UKPDS. Initial decreases in HbA1c were not sustained during the 10-year study period. SLIDE BACKGROUND: EDIC: Epidemiology of Diabetes Interventions and Complications 1375 of the 1441 DCCT participants (95%) volunteered to participate in EDIC. 1208 patients were evaluated after 4 years of follow-up in EDIC (605 of these were previously in the DCCT intensive group; N for Year 6 not yet available). Data for DCCT/EDIC on slide are for previous participants in DCCT intensive group. The gap between this group and their counterparts in the conventional group has diminished over time. Data for previous participants in DCCT conventional group are: DCCT time 0 = 9.0% DCCT time 6.5 yrs = 9.0% EDIC + 4 years = 8.2% EDIC + 6 years = 8.1% Data for DCCT/EDIC are means.
  • #14 Relationship Between %BG in Target and HbA1c Level Brewer at the Barbara Davis Center in Denver, Colorado effort to determine the percentage of SMBGs within, above or below target range that result in HbA1c levels within target range = 70 to 180 mg/dl above target range = greater than 180 mg/dl below target range = below 70 mg/dl a slight difference needs to be achieved of BG within target range to achieve a reduction of HbA1c 8.5% to 7%. slight improvements yield large results! Note: at all HbA1c levels the occurrence of hypoglycemic values is in excess of 10%. REF: Brewer K, Chase P, Owen S, Garg S, Diabetes Care 1998, 21:2.
  • #15 Key Points The primary objectives of effective diabetes management are to reduce A1C to as near-normal levels (ie, 4%–6%) as is possible and safe, to lower systolic blood pressure to <130 mm Hg, and to decrease LDL cholesterol to <100 mg/dL Achieving target levels of A1C, systolic blood pressure, and LDL cholesterol may reduce the risk of the micro- and macrovascular complications of diabetes by up to 75% As illustrated in this slide, the objectives of effective diabetes management are to reduce A1C to as near-normal levels as is possible and safe (ie, 4%–6%), lower systolic blood pressure to <130 mm Hg, and to decrease LDL cholesterol to <100 mg/dL. Evidence suggests that achieving these target levels can reduce the risk of both microvascular and macrovascular complications of diabetes by >75%.1 Most recently, the Steno-2 Study followed 160 patients with type 2 diabetes and microalbuminuria over 7.8 years to determine the effect of intensive treatment on long-term CV and microvascular outcomes. Researchers found that target-driven, intensive treatment consisting of stepwise diet, exercise, and pharmacotherapy for glycemia, microalbuminuria, lipids, and blood pressure resulted in a decreased risk of CV and microvascular events of about 50%. Control group members received conventional treatment in accordance with national guidelines. However, factors leading to diminished degrees of separation between the intensive treatment and control groups (eg, more than 50% of control group members were referred for specialist treatment during the course of the study) led the authors to estimate that the actual risk reduction associated with intensive versus conventional therapy may be even greater than that observed.2 References American Diabetes Association. Clinical Practice Recommendations. Implications of the United Kingdom Prospective Diabetes Study. Diabetes Care. 2003;26(suppl 1):S28-S32. Gæde P, Vedel P, Larsen N, Jensen GVH, Parving H-H, Pedersen O. Multifactorial intervention and cardiovascular disease in patients with type 2 diabetes. N Engl J Med. 2003;348:383-393.
  • #19 This is the trend among all insulin injectors based on self reported data.
  • #20 It appears the numbers might be the same when sampling MDs at the ADA.
  • #23 FARAH- FIX INCOME DATA LEGEND Shows patient profiles captured in sample (classification, gender, education) Education – US far more educated than other countries, highly industrialized, serious consequences of the rich lifestyle – obesity & sedentary lifestyles 3 in 10 diabetes patients are overweight and half are obese or morbidly obese (US) – relatively unhealthy compared to all other sampled nations Higher incidence of cardiovascular problems, high cholesterol, numbness/tingling and pain in hands or feet among patients with weight problems Average weight is 200 lbs, average height 5-6