By: Muzayen Sh.
CHAPTERONE
1. An introduction in to the course
Concepts of Development Economics
About 1/4th
(the majority of people found in North America and Western
Europe) live in comfort table situation. For example
Houses with many rooms
More than enough to eat
Well clothed
Adequate medical treatment
Reasonable degree of medical treatment
About 3/4th
(most people in Africa, Asia, and Latin America) live in
uncomfortable situations. For example
No shelter
No adequate food
Poor health
Can’t read and writeTheir future is uncertain
3.
By: Muzayen Sh.
1.1.The current interest in development economics
• The subject is of recent origin, in the post 1950s (about five
decades ago). The public and political concern for the poor
nations is only recently increasing.
Factors which were not encouraging for the development of
the subject in the pre 1950 period.
• In the 1930s advanced countries were caught up in and fully
engaged in ‘the great economic depression’
• In the 1940s countries were fighting world war two
• The developing countries (Africa, Latin America and Asia) were
caught up with serfdom, stagnation and colonialism.
4.
By: Muzayen Sh.
The favorable factors that helped the rise of the subject include
• The recent renewed interest from academicians in the growth and
development process of developing countries
• Recently poor countries became aware of their backwardness and developed
the desire to become strong through economic growth. The quest for (NEO)
New Economic Order by these nations is a case in point.
• NEO is based on equity, sovereignty, equality and common interest among
all nations and thus calls for
• Terms of trade improvement
• Access to markets of developed nations
• Greater financial assistance and canceling of past depts.
• Reform on multinational financial institutions such as IMF (International
Monetary Fund) and WB (World Bank).
• Increasing mutual interdependence of the world economy through trade
and finance
5.
1.2. Definition andnature of development economics
• Development economics is a branch of economics that systematically studies the
economic development of the third world nations of Africa, Asia (except Japan) and
Latin America (including Caribbean nations).
• Development economics is one of the newest and most challenging branches of the
broadest disciplines of economics and political economy and became a separate field
of study in economics after the pioneering studies of two economists.
• Arthur Lewis and Theodore Schultz 1979 Nobel prize winners
• Development economics draws on relevant principles and concepts from other
branches of economics such as
• Macroeconomics
• Labor economics
• Public finance
• Microeconomics .etc
• The nature of development economics is different from that of traditional
economics and political economy. By: Muzayen Sh.
6.
By: Muzayen Sh.
Conti…
•Traditional economics
• It is concerned with the least cost allocation of resources and the growth of
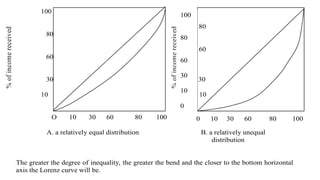
these resources overtime. It also deals with the advanced capitalist world of
perfect market, consumer sovereignty, marginal and individualistic based
decision making, market equilibrium etc.
• Political economy
• Goes beyond traditional economics and studies the social and institutional
process through which certain groups of economic and political elites
dominate the allocation of resources.
• Development economics
• It Deals with economic, social, political and institutional mechanisms
necessary to bring rapid and large scale improvement in living standards of
the poverty stricken peoples of Africa, Asia and Latin America.
7.
Cont.…
• Terminologies usedin development economics
• Various terminologies are used in development economics to identify the rich nations
from the poor nations. Some of them are;
• Modern Vs backward countries; this terminology is not however commonly used
because of its negative connotation
• Developed Vs underdeveloped( developing) ; this way of classification is most popular
• Most developed Vs least developed countries; this terminology or way of classification
is also commonly used to differentiate rich nations from poor nations
• High, middle and low income countries; this classification is based on the level of
income of countries. It has been later redefined by the World Bank as follows based on
specific per capita income (PCI) ranges,
• Low income countries = are economies with PCI less than $ 755 in the year 2000’s
constant prices
• Middle income economies= are countries with PCI $ 755 to $9265 in the year 2000’s
constant price
By: Muzayen Sh.
8.
Cont.…
• The meaningof economic growth and development
• The term economic development is used interchangeably with such terms as economic
growth, economic welfare, economic progress and secular change.
• Economic development refers to the problems of underdeveloped countries and
economic growth to those of advanced countries.
• According to Schumpeter,” Development is a discontinuous and spontaneous change in
the stationary state, which forever alters and displaces the equilibrium state previously
existing; while
• Growth is a gradual and steady change in the long run which comes about by a general
increase in the rate of saving and population.”
• Economic growth is a mere expansion of the economy without structural changes.
There can be economic growth without economic development. There are several
countries that have achieved higher rates of economic growth without improvement in
the income distribution and standards of living.
By: Muzayen Sh.
9.
By: Muzayen Sh.
Conti..
•Economic development implies growth plus structural transformation.
• Economic growth can be attained in several ways but to have
development there are limited ways.
• Before the 1970 economic growth was considered to be equal to
development because it was assumed that a gain in overall GDP would
trickle down to the poor.
• In 1970 development was redefined in terms of
• Reduction and elimination of poverty
• Reduction and elimination of inequality and underemployment
i.e. redistribution from growth became a common slogan.
• According to world development report (1991)“the challenges of
development is to improve the quality of life in the world’s poor countries.
10.
Contin………………..
A better qualitylife of requires
Higher income
Better education
Higher standards of health and nutrition
Less poverty
Cleaner environment
More equality and opportunity
Greater individual freedom
Richer cultural life
By: Muzayen Sh.
11.
Conti…
• Professor Goulet(1971) states that development has three core values
I.Life sustenance
• It refers to the ability to meet the basic needs such as food, shelter, health
minimal education and protection. In a condition where the basic needs
are not met, we cannot say the country ifs fully developed despite its high
GDP or income level.
• Efforts to meet these basic needs are known as the basic need approaches
to development, which was initiated by World Bank
II. Self esteem
• It is concerned with the feeling of self-respect and independence or not
being used as a tool by others. No country could be regarded as fully
developed if others exploit it and does not have the power and influence
to conduct relation on equal terms.
By: Muzayen Sh.
12.
Cont………
III .Freedom fromservitude (to be able to choose)
• It refers to the freedom from ignorance and poverty. No body is free if he /she
cannot choose and is imprisoned by living at the margin of subsistence with no
education and skill.
• Freedom also refers to political freedom including personal security, the rule of
laws, freedom of expression and political participation on equal footing.
• Hence, according to Professor Goulet, the objective of development must be:-
• To increase the availability and widen the distribution of basic life sustaining goods
• To raise the level of living including more jobs better education, greater attention to
cultural and humanistic values all of which serve to generate individual and
national self esteem.
• To expand the range of economic and social choice available to individuals and
nations bay freeing them from servitude.
By: Muzayen Sh.
13.
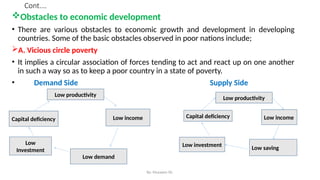
Cont.…
Obstacles to economicdevelopment
• There are various obstacles to economic growth and development in developing
countries. Some of the basic obstacles observed in poor nations include;
A. Vicious circle poverty
• It implies a circular association of forces tending to act and react up on one another
in such a way so as to keep a poor country in a state of poverty.
• Demand Side Supply Side
Low productivity
Capital deficiency Low income
Low
Investment
Low demand
Low productivity
Capital deficiency
Low investment
Low income
Low saving
By: Muzayen Sh.
14.
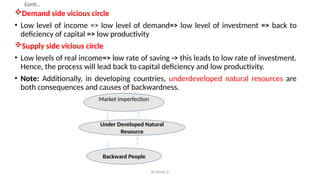
Conti…
Demand side viciouscircle
• Low level of income => low level of demand=> low level of investment => back to
deficiency of capital => low productivity
Supply side vicious circle
• Low levels of real income=> low rate of saving -> this leads to low rate of investment.
Hence, the process will lead back to capital deficiency and low productivity.
• Note: Additionally, in developing countries, underdeveloped natural resources are
both consequences and causes of backwardness.
By:Barke D
Market imperfection
Under Developed Natural
Resource
Backward People
15.
Conti…
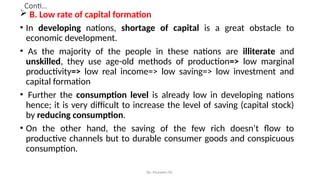
B. Lowrate of capital formation
• In developing nations, shortage of capital is a great obstacle to
economic development.
• As the majority of the people in these nations are illiterate and
unskilled, they use age-old methods of production=> low marginal
productivity=> low real income=> low saving=> low investment and
capital formation
• Further the consumption level is already low in developing nations
hence; it is very difficult to increase the level of saving (capital stock)
by reducing consumption.
• On the other hand, the saving of the few rich doesn’t flow to
productive channels but to durable consumer goods and conspicuous
consumption.
By: Muzayen Sh.
16.
Cont….
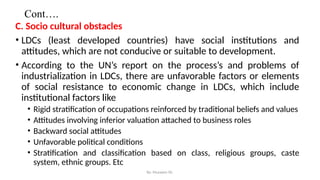
C. Socio culturalobstacles
• LDCs (least developed countries) have social institutions and
attitudes, which are not conducive or suitable to development.
• According to the UN’s report on the process’s and problems of
industrialization in LDCs, there are unfavorable factors or elements
of social resistance to economic change in LDCs, which include
institutional factors like
• Rigid stratification of occupations reinforced by traditional beliefs and values
• Attitudes involving inferior valuation attached to business roles
• Backward social attitudes
• Unfavorable political conditions
• Stratification and classification based on class, religious groups, caste
system, ethnic groups. Etc
By: Muzayen Sh.
17.
Cont.…
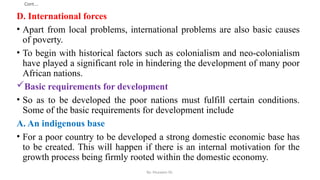
D. International forces
•Apart from local problems, international problems are also basic causes
of poverty.
• To begin with historical factors such as colonialism and neo-colonialism
have played a significant role in hindering the development of many poor
African nations.
Basic requirements for development
• So as to be developed the poor nations must fulfill certain conditions.
Some of the basic requirements for development include
A. An indigenous base
• For a poor country to be developed a strong domestic economic base has
to be created. This will happen if there is an internal motivation for the
growth process being firmly rooted within the domestic economy.
By: Muzayen Sh.
18.
Cont…
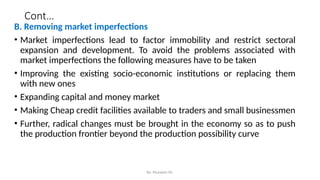
B. Removing marketimperfections
• Market imperfections lead to factor immobility and restrict sectoral
expansion and development. To avoid the problems associated with
market imperfections the following measures have to be taken
• Improving the existing socio-economic institutions or replacing them
with new ones
• Expanding capital and money market
• Making Cheap credit facilities available to traders and small businessmen
• Further, radical changes must be brought in the economy so as to push
the production frontier beyond the production possibility curve
By: Muzayen Sh.
19.
Conti…
C.Structural changes
• Itimplies the transformation from a traditional agricultural society to a modern society or industrial
economy involving a radical transformation of existing institutions, social attitudes and motivations.
• It transfers population from primary to secondary and territory sectors. It is also the development
of new social systems, which would replace the old social systems, which are simply based on class,
caste and religious differentials.
D.Capital formation
• It related to the process of developing investible funds and directing them to investment areas. It
involves three interdependent stages
• An increase in the volume of real saving
• The existence of credit and financial institutions to mobilize these savings for converting them in to
investible funds.
• The use of these savings for the purpose of investment in capital goods
E.Following suitable investment criterion
• In the process of bringing growth and development, any developing economy is supposed to follow
suitable policies of investment but there is no well-defined single criterion, rather a set of suitable
criterion.
By: Muzayen Sh.
20.
Chapter Two
Diverse Structureand Common Characteristics of Developing Countries
The diverse structure of developing economies
Any representation of structural diversity of developing countries requires an
examination of:-
The size of the country(geographic area, population, and income)
Its historical and colonial background
The endowment of physical and human resources
Its ethnic ad religious composition
The relative importance of its public and private sectors
The nature of industrial structure
The degree of dependence on external economic and political forces
The distribution of power and
The institutional and political structure within the nation
21.
1. The sizeof the country
The sheer physical size of a country, size of its population, and level of
its per capita income are:
• Important determinants of its economic potential, and
• Major factors differentiating one developing country from another
Large size (both in terms of population and physical area)
usually presents advantages of
• Diverse resource endowments
• Large potential markets, and
• A lesser dependence on foreign resources of materials and products
But, it also creates problems of
• administration control
• National cohesion, and
• Regional imbalances
22.
2. Historical andcolonial background
As most LDCs were once colonies of western European countries, their
economic structure as well as their educational and social
institutions have typically been modeled on their colonial rulers.
The colonial powers of the west had a dramatic and long lasting
impact on the economies and political and institutional structures of
their colonies by their introduction of new and tradition-shattering
ideas like;
• Private property
• Personal taxation, and
• The requirement that taxes be paid in money rather than in kind
23.
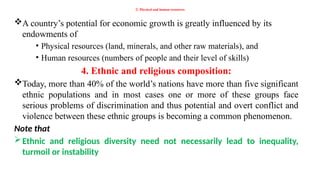
3. Physical andhuman resources
A country’s potential for economic growth is greatly influenced by its
endowments of
• Physical resources (land, minerals, and other raw materials), and
• Human resources (numbers of people and their level of skills)
4. Ethnic and religious composition:
Today, more than 40% of the world’s nations have more than five significant
ethnic populations and in most cases one or more of these groups face
serious problems of discrimination and thus potential and overt conflict and
violence between these ethnic groups is becoming a common phenomenon.
Note that
Ethnic and religious diversity need not necessarily lead to inequality,
turmoil or instability
24.
5. Relative importanceof the public and private sectors
Most developing countries have mixed economic system,
featuring both public and private ownership and use of resource.
This division between the two and their relative importance are
mostly a function of historical and political circumstances.
6. Industrial structure
The majority of developing countries are agrarian in economic,
social, and cultural outlook.
Agriculture, of both subsistence and commercial, is a principal
economic activity in terms of the occupational distribution of
the labor force, if not in terms of proportionate contributions to
the gross national product.
25.
7. External Dependence:Economic, Political, And Cultural
The degree to which a country is dependent on foreign
economic, social, and political forces is related to its size,
resource endowment, and political history.
For most developing countries this dependence is substantial.
Most small nations are highly dependent on foreign investment
and trade with the developed world.
Even beyond economic dependence, developing countries are
dependent on developed countries through transmission of
institutions (e.g., systems of education and governance), values,
patterns of consumption, and attitudes toward life, work and self.
26.
8. Political structure,power, and interest group
It is often not the correctness of economic policies alone that
determines the outcome of national approaches to critical
development problems.
The political structure and the vested interests and allegiances
of ruling elites (e.g., large landowners, urban industrialists,
bankers, foreign manufacturers, the military, trade unionists)
will typically determine what strategies are possible and where
the main roadblocks to effective economic and social change
may lie.
27.
Common characteristics
I. Demographiccharacteristics
Very poor countries are characterized by high birth rate and
high death rate.
As economic development proceeds, death rate declines
because of improvement in health conditions & access to health
services. But, for birth rate to decline it requires substantial
economic development .
The difference between the developed & the LDCs is nowadays
mainly in the birth rate.
As a result the gap between birth rate & death rate in LDCs is
widening.
As population growth rate = Birth rate - death rate
28.
High populationgrowth has two effects:
It means that overall income must grow faster than population to keep per
capita growth at reasonable levels. Since growth in population
a) increases the number of people who divide the national income, and
b) helps income to grow as a result of greater supply of productive labor
Per capita income to grow 'b' should dominate 'a'. In countries not endowed
with large quantities of capital (physical or human), 'a' is dominant.
The overall population will be young because high birth rate means larger
proportion of children is entering into the population and hence population
is weighted heavily in favor of children.
This leads to greater economic dependency burden in developed countries.
29.
II. Occupational &production structure
Substantial amount of labor is living in rural areas:-
(72%) in LDC (in low income countries),
60% in middle income countries and
20% (and most of which are engaged in non- agricultural
activates) in DCs
Agriculture accounts for the significant portion of production in
LDCs the average proportion of output from agriculture is close to
30% in low income countries,
20% in middle income countries and
1-7% in DCs.
30.
III. Rapid Rural-Urban Migration
The migration of rural labor force to the urban areas could be due to push
and pull reasons.
– The Push(Drive) from agriculture is due to the extreme poverty and
landlessness.
– The perceived Pull(Attract) of the urban sector is reinforced by a
variety of factors such as
• High wage
• Workers protection by labor union and their government.
• Availability of infrastructures
Rural urban migration is higher in LDCs than MDCs.
31.
IV. International Trade
Bothpoor & rich countries are engaged in international trade.
The intensity of trade is measured by:
There is no significant difference in this ratio between the LDCs and MDCs.
But there is a difference between LDCs & DCs in the composition of export trade
in that;
LDCS are often exports of primary products such as raw materials; cash crop
(coffee, tea, cacaos) and sometimes food.
The bulk of export from the MDCs is manufactured foods (refrigerator, house
appliances, etc). Some of the disadvantages of being involved in export of
primary products include
Primary products are particularly subject to large fluctuation in the world market
price. This creates instability in export earning.
Over the long-run primary products become less important in the consumption
basket of people in the world.
GNP
Export
Import
32.
V. High andRising Levels of Unemployment and Underemployment
Inefficient use of labor is one of the reasons for low level of living in
LDCs.
There are two kinds of labor underutilization:
• Open unemployment
• Underemployment
Open unemployment is very high in urban areas than rural
areas- Open unemployment is higher in urban areas because of
rural urban migration other features
Underemployment is higher in rural areas than urban areas
.
.
33.
Chapter Three:
Theories ofEconomic Growth and the State of Development Theory
There are four major and often competing classic development
theories. These are:
3.1.The linear-stages-of-growth model
3.2.Theories and patterns of structural change
3.3.The international dependence revolution, and
3.4.The neoclassical, free-market counterrevolution
By: Muzayen Sh.
34.
3.1.The linear-stages-of-growth models:
•Theories of the 1950s and early 1960s viewed the process of
development as a series of successive stages of economic
growth through which all countries must pass.
• It was primarily an economic theory of development in which
the right quantity and mixture of saving, investment, and
foreign aid were all that was necessary to enable developing
nations to proceed along an economic growth path that
historically had been followed by the more developed
countries.
35.
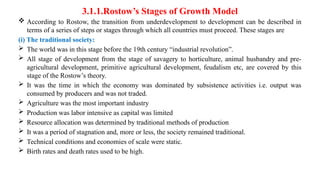
3.1.1.Rostow’s Stages ofGrowth Model
According to Rostow, the transition from underdevelopment to development can be described in
terms of a series of steps or stages through which all countries must proceed. These stages are
(i) The traditional society:
The world was in this stage before the 19th century “industrial revolution”.
All stage of development from the stage of savagery to horticulture, animal husbandry and pre-
agricultural development, primitive agricultural development, feudalism etc, are covered by this
stage of the Rostow’s theory.
It was the time in which the economy was dominated by subsistence activities i.e. output was
consumed by producers and was not traded.
Agriculture was the most important industry
Production was labor intensive as capital was limited
Resource allocation was determined by traditional methods of production
It was a period of stagnation and, more or less, the society remained traditional.
Technical conditions and economies of scale were static.
Birth rates and death rates used to be high.
36.
Cont…
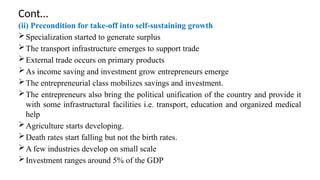
(ii) Precondition fortake-off into self-sustaining growth
Specialization started to generate surplus
The transport infrastructure emerges to support trade
External trade occurs on primary products
As income saving and investment grow entrepreneurs emerge
The entrepreneurial class mobilizes savings and investment.
The entrepreneurs also bring the political unification of the country and provide it
with some infrastructural facilities i.e. transport, education and organized medical
help
Agriculture starts developing.
Death rates start falling but not the birth rates.
A few industries develop on small scale
Investment ranges around 5% of the GDP
37.
Cont…
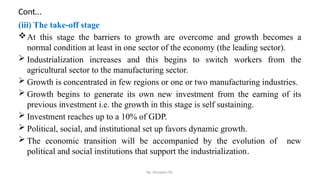
(iii) The take-offstage
At this stage the barriers to growth are overcome and growth becomes a
normal condition at least in one sector of the economy (the leading sector).
Industrialization increases and this begins to switch workers from the
agricultural sector to the manufacturing sector.
Growth is concentrated in few regions or one or two manufacturing industries.
Growth begins to generate its own new investment from the earning of its
previous investment i.e. the growth in this stage is self sustaining.
Investment reaches up to a 10% of GDP.
Political, social, and institutional set up favors dynamic growth.
The economic transition will be accompanied by the evolution of new
political and social institutions that support the industrialization.
By: Muzayen Sh.
38.
Cont…
• (iv)The stageof “Drive to Maturity”
The economy diversifies in to new areas (sectors), and also it produces wide range
of goods and services
Technological innovation provides a range of investment opportunities
There will be less reliance on imports
The rate of investment increases from 10% of the GDP to higher limits up to 20 %
Important industries come up and technical knowledge spreads to other sectors
Real income per head starts rising as GDP growth rate becomes substantially
higher than population growth rate
Real Per Capita Income increases as the growth rate of GDP exceeds the
population growth rate
Specialization and division of labor become complex and compound
39.
Cont…
• (v) Stagesof self-sustained growth of and mass consumption
The economy moves to mass consumption
Consumer durable industries flourish
The service sector gets dominance
Per capita real income becomes so high that consumptions
transcends beyond food, clothes and shelter to goods of
comforts and luxuries on a mass scale.
Urbanization and industrialization change the values of society
and development consciousness increases
People don’t feel any pinch of shortages
By: Muzayen Sh.
40.
3.1.2 The Harrod-DomarGrowth Model
HDM of economic growth is based on the assertion that every
economy must save a certain proportion to its national income
to
Replace worn-out or impaired capital goods (buildings,
equipments, and materials)
Finance new investments representing net additions to the
capital stock that is required to bring about growth in GDP
According to this model, if we assume that there is some direct
economic relationship between the size of total capital stock
(K) and total GNP (Y)
41.
Cont…
The HDM ofeconomic growth is outlined as follows. Suppose:
t = time variable
Yt = total output at time t
Ct = consumption at time t
St = saving at time t
It = investment at time t
Assuming a closed economy,
On the income side, total output is defined as the sum of consumption and saving
Yt = Ct + St …………………………….(1)
On the output side, total output is defined as the sum of consumption and investment
Yt = Ct + It …………………………….(2)
From (1) and (2) above
St = It ………………………………….. (3)
42.
Cont..
The accumulation ofcapital stock
• Kt + 1 = Kt – δKt + It
• Kt + 1 = (1 – δ) Kt + It ………………….. (4)
• Where
• δ = the rate of depreciation
• Kt = capital stock at time t (current period)
• Kt + 1 = capital stock at time next period
• Let
• s = St / Yt => St = sYt ………………..(5)
• θ = Kt /Yt => Kt = θYt ………………..(6)
where s is saving rate and θ is ICOR
• From (3), (4), (5), and (6) above, we get
• (Yt + 1 – Yt) / Yt = (s - δ θ)/ θ
• g = (s/ θ) - δ ...……………………….. (7)
• s/ θ = g + δ ………………………….. (8)
• Equation (8) is known as Harrod-Domar growth equation
43.
Cont…
The policy implicationof the model is that growth of GDP can be raised by
pushing up saving rate.
Note that for an open economy, policy options related to overseas borrowing
and foreign investment can be considered in case it faces financial gap i.e.
difference between required saving and actual saving.
Criticisms of HDM
•Though necessary conditions, investment and saving are not sufficient conditions
for economic growth. We need some kind of skills and managerial capacity to
transform the potentials of capital investment (saving) into growth in GDP.
•There is no consideration for population and demographic explosion.
•In reality, saving rate and ICOR are not as exogenous as treated in HDM.
Specifically, since in the real world we are likely to encounter diminishing returns
to scale, ICOR cannot be a fixed parameter as assumed in the model
44.
3.1.3 The RobertSolow growth model
The model:
Expanded on Harrod-Domar formulation by adding a second factor, labor,
and introducing a third independent variable, technology, to the growth
equation.
Unlike the fixed-coefficient, constant-returns-to-scale assumption of the
HDM, it exhibited diminishing returns to labor and capital separately
and constant returns to both factors jointly.
This implies that in this model θ is not fixed, rather it depends on the
economy-wide relative endowment of capital and labor whereby it is
small when labor is plenty relative to capital and vice versa.
Assumes technology as a variable whose level is determined
exogenously, that is, independently of all other factors, and technological
progress is absent
45.
Cont..
Next, let uslook at mathematical formulation of Solow model.
Let production function of the economy is given by
1
0
such that
is
α
:
where
P
AK
P)
f(K,
Y α
-
1
α
K is capital and P is working population
A is a measure of efficiency of both K and P i.e. it shows total factor
productivity. A simply represents level of technology.
A doesn’t grow i.e., there is no technological progress and P grows at a rate
of n.
Dividing the whole by P we get
produce.
can
t worker
output tha
more
wo
to
has
r
each worke
h
with whic
capital
more
The
.
per worker
capital
of
amount
on the
de
hat
function t
a
is
per worker
output
that
states
f(k)
Ak
y
equation
The
0.
(k)
f
(k)
f
and
ly
respective
per worker
capital
and
income
capita
per
represent
k
and
y
where
9)
.........(
..........
..........
..........
..........
..........
..........
..........
..........
α
'
'
'
f(k)
Ak
y
P
K
A
P
P
AK
P
Y
α
α
1-α
α
46.
Cont…
•Recall From equation(3), (4), and (5) of HDM that
• Kt + 1 = (1 – δ)Kt + sYt
• Kt + 1 - Kt = sYt - δKt
• ΔKt=sYt - δKt………………………………………(10)
• Equation (10) states that the total capital stock grows when savings are greater than
depreciation.
• As the labor force (P) grows at the rate n per year, the change in capital per worker (k)
is given by:
• Δkt = syt – (δ + n)k
• Δkt = sAkαt – (δ + n)kt …………………………………………...(11)
• Equation (11) states that capital per worker grows when savings are greater than what
is needed to equip new workers with the same amount of capital as existing workers
have.
47.
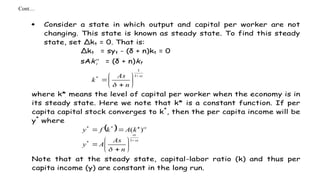
Cont…
Consider astate in which output and capital per worker are not
changing. This state is known as steady state. To find this steady
state, set Δkt = 0. That is:
Δkt = syt - (δ + n)kt = 0
sAk
t = (δ + n)kt
1
1
*
n
As
k
where k* means the level of capital per worker when the economy is in
its steady state. Here we note that k* is a constant function. If per
capita capital stock converges to k*
, then the per capita income will be
y*
where
1
*
*
*
)
(
n
As
A
y
k
A
k
f
y
Note that at the steady state, capital-labor ratio (k) and thus per
capita income (y) are constant in the long run.
48.
Cont…
Conclusion on HDMand Solow Model
• In HDM the ratio of capital to output is constant and in the
Solow model it increases as per capita capital increases
because of the diminishing marginal returns to capital.
• Theoretical predictions of HDM and Solow model
• Parameters such s do have rate effect in HDM but only level
effect in Solow model
• Unlike HDM, Solow model predicts convergence between per
capita income of countries given that they the same s, n, etc.
49.
Reading Assignment
• 3.2LEWIS THEORY OF DEVELOPMENT
• 3.3 BALANCED Vs UNBALANCED GROWTH THEORIES
• 3.4 THE INTERNATIONAL DEPENDENCE MODEL
• 3.5THE NEO-CLASSICAL COUNTERREVOLUTION(MARKET
FUNDAME NTALISM)
50.
CHAPTER 4
HISTORIC GROWTHAND LESSON LEARNED, AND THE STATE
OF DEVELOPMENT THEORY
4.1 . History, growth and contemporary development lessons and
controversies
The source of economic progress can be attributed to a variety of
factors but generally investments that improve the quality,
quantity and productivity of resources through innovation and
technological progress have been the primary factors in bringing
growth.
51.
The Economics OfGrowth Through Capital, Labor And Technology
There are three major components of economic growth;
(A) Capital accumulation
• It occurs when some proportion of current income is saved and
invested.
• New machineries and equipments increase the physical capital stock
and help to expand output.
• These directly productive investments are mostly supplemented by
socio economic infrastructures like roads, electricity, water etc.
• Investment in human resources through formal schooling, vocational
training and other sorts of training increases human skills, thereby
improving the quality of the labor force.
52.
(B) .Population andthe labor force
• Theoretically, population growth and the consequential increase in
the labor force are stimulants of economic growth.
• In reality, however, this depends on the ability of the economy to
absorb (employ) the additional workers.
(C) Technological progress
• It results from improved ways of accomplishing a given task. There
are three basic types of technological progress;
53.
1. Neutral technologicalprogress
-It is when the technological progress results in more productive
use of both existing capital and labor.
2. Labor augmenting (capital saving) technological progress
-It occurs when the quality and skills of the labor force is upgraded
i.e. the technological progress is such that it comes up with more
productive use of existing labor.
3. Capital augmenting technological progress
-It is when the technological progress results in the more
productive use of existing capital goods.
54.
THE HISTORICAL RECORD
Kuznet’sSix Characteristics Of Modern Economic Growth
• Kuznet isolated six characteristic features manifested in the
growth process of almost every developed nation.
(1) High rate of per capita out put and population growth
• For the capitalist developed countries, annual growth rates over the past
200 years averaged 2% for per capita output, 1% for population and 3% for
total output (real GNP). These rates, which imply a doubling time of
roughly 35 years for per capita output, 70 years for population and 24 years
for real GNP, were far greater than what was experienced in the pre –
industrial revolution period.
• * In short, these countries experienced large multiples of their previous
historical rates in recent times.
55.
Cont…
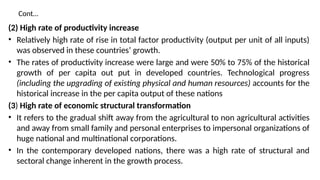
(2) High rateof productivity increase
• Relatively high rate of rise in total factor productivity (output per unit of all inputs)
was observed in these countries’ growth.
• The rates of productivity increase were large and were 50% to 75% of the historical
growth of per capita out put in developed countries. Technological progress
(including the upgrading of existing physical and human resources) accounts for the
historical increase in the per capita output of these nations
(3) High rate of economic structural transformation
• It refers to the gradual shift away from the agricultural to non agricultural activities
and away from small family and personal enterprises to impersonal organizations of
huge national and multinational corporations.
• In the contemporary developed nations, there was a high rate of structural and
sectoral change inherent in the growth process.
56.
Cont..
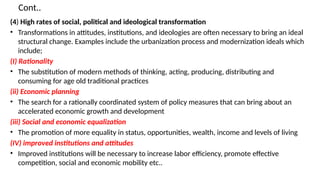
(4) High ratesof social, political and ideological transformation
• Transformations in attitudes, institutions, and ideologies are often necessary to bring an ideal
structural change. Examples include the urbanization process and modernization ideals which
include;
(I) Rationality
• The substitution of modern methods of thinking, acting, producing, distributing and
consuming for age old traditional practices
(ii) Economic planning
• The search for a rationally coordinated system of policy measures that can bring about an
accelerated economic growth and development
(iii) Social and economic equalization
• The promotion of more equality in status, opportunities, wealth, income and levels of living
(IV) improved institutions and attitudes
• Improved institutions will be necessary to increase labor efficiency, promote effective
competition, social and economic mobility etc..
57.
Cont…
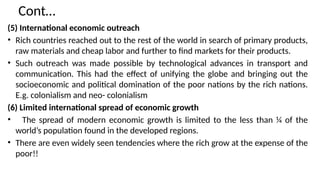
(5) International economicoutreach
• Rich countries reached out to the rest of the world in search of primary products,
raw materials and cheap labor and further to find markets for their products.
• Such outreach was made possible by technological advances in transport and
communication. This had the effect of unifying the globe and bringing out the
socioeconomic and political domination of the poor nations by the rich nations.
E.g. colonialism and neo- colonialism
(6) Limited international spread of economic growth
• The spread of modern economic growth is limited to the less than ¼ of the
world’s population found in the developed regions.
• There are even widely seen tendencies where the rich grow at the expense of the
poor!!
58.
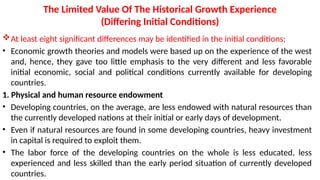
The Limited ValueOf The Historical Growth Experience
(Differing Initial Conditions)
At least eight significant differences may be identified in the initial conditions;
• Economic growth theories and models were based up on the experience of the west
and, hence, they gave too little emphasis to the very different and less favorable
initial economic, social and political conditions currently available for developing
countries.
1. Physical and human resource endowment
• Developing countries, on the average, are less endowed with natural resources than
the currently developed nations at their initial or early days of development.
• Even if natural resources are found in some developing countries, heavy investment
in capital is required to exploit them.
• The labor force of the developing countries on the whole is less educated, less
experienced and less skilled than the early period situation of currently developed
countries.
59.
2) Relative levelsof per capita income and GNP
• The population living in developing countries have, on the average, a
much lower level of per capita income than what the current developed
countries used to have many years ago while they were developing.
• Further, the modern developed nations were economically far better
than the rest of the world at the early days of their economic growth.
• Hence, they could take advantage of their relatively strong financial and
economic position to widen the income gaps between themselves and
other less fortunate countries.
• However developing countries begin their growth starting from very low
per capita income.
• Such a situation creates economic and psychological frustration in
growth.
60.
3) Climatic differences
•The extreme heat and humidity in many developing countries
contributes to the deteriorating soil quality and the rapid depreciation
of many natural goods.
• Climatic unfavorability also causes crops to have low productivity,
weakens regenerative growth of forests and leads to poor health of
animals.
• It also causes discomfort to workers, weakens their health and lowers
their levels of productivity and efficiency.
61.
4) Population size,distribution and growth
• During their early growth years, western nations experienced a
very slow rise in population growth. The population in most
developing countries, however, is growing and multiplying at
very high rates.
5) The historical role of international migration
As to the current developing countries, there is little chance of
reducing population pressure through massive international
emigration because of factors such a great geographical distance
and very restrictive immigration laws in developed countries.
62.
6) The growthstimulus of international trade
• Developing countries face declining terms of trade and, further,
developed countries substitute the traditional commodities of the
poor nations with synthetic products using their technological
advance.
7) Basic scientific and technological research and development
capabilities
• The contemporary developed nations utilized the outcomes of scientific
research and technology in their growth experience. These countries also spent
large sums of money to run and finance different researches and they actively
utilize their outcomes.
• The current poor countries are not engaged in a production process that invited
technological advancement. They produce simple materials by saving capital
(making less use of capital) and using more labor.
63.
8) Stability andflexibility of political and social institutions
• The current developed countries were independent consolidate
states able to undertake national policies on the quest to
modernization.
• They were culturally homogeneous and politically unified.
• However, most of the current poor nations have only recently got
their independence and have not yet become fully consolidated
nations states with effective ability to formulate and follow
national policies.
64.
HISTORY, EXPECTATIONS ANDDEVELOPMENT
Historical experience of Economic Growth (1960-1985)
• The richest 5% of the world’s nations have a PCI twenty nine times that of the poorest 5% of the nations.
Over the 25 years given above, the gap remained constant. The income distribution also remained constant.
• Though the gap and income distribution remained constant, over the said period countries climbed and
descended the ladder of relative economic position.
• For example, the entire world grew by 1.7%. But, the seven East Asia countries: Japan Korea, Taiwan
Singapore, Hong Kong, Thailand, Malaysia & Indonesia (& recently China) have a growth of PCI 5.5% per
annum. (China 8.2%).
• In contrast the Latin American & sub Saharan countries PCI growth was negative.
• The Latin American growth declined by 11% except for Chile & Colombia which showed a modest growth.
SSA Economy was stagnant in 1989s. in Nigeria, Tanzania & Ethiopia, PCI growth was negative whereas Kenya
& Uganda showed a modest growth.
65.
• In LatinAmerica the reason for negative growth is due to
– debt-crisis
– Huge (double digit) inflation.
• For SSA the reasons are due to
– war and consequence destruction of infrastructure and
– Population growth.
• The reason for the success of East Asia is not fully understood. But
it may be due to:
– far sighted government policies & government interventions
– Relatively equal domestic distribution of income & access to education &
health.
– Vigorous entry in to the international market.
66.
• Despite Solow'sConvergence Hypothesis (to be discussed later) that
states that poor countries grow faster than the rich & the poor
countries will catch up the rich nation, it is quite possible for the world
distribution of income to stay fairly constant in relative terms while
there is plenty of action within the distribution as countries climb and
descend the ladder of relative economic development.
• The above observation is a cause for hope and trepidation(fear) where
– The hope is that no traps to ultimate economic success
– The trepidation is that it seems easy to slip and fall in the process of
development
• But be cautious on the hope because, although there is no evidence
that very poor countries are doomed to eternal poverty, there is some
indication that low incomes are very sticky
67.
CHAPTER 5
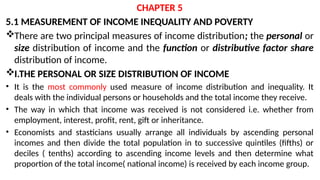
5.1 MEASUREMENTOF INCOME INEQUALITY AND POVERTY
There are two principal measures of income distribution; the personal or
size distribution of income and the function or distributive factor share
distribution of income.
I.THE PERSONAL OR SIZE DISTRIBUTION OF INCOME
• It is the most commonly used measure of income distribution and inequality. It
deals with the individual persons or households and the total income they receive.
• The way in which that income was received is not considered i.e. whether from
employment, interest, profit, rent, gift or inheritance.
• Economists and stasticians usually arrange all individuals by ascending personal
incomes and then divide the total population in to successive quintiles (fifths) or
deciles ( tenths) according to ascending income levels and then determine what
proportion of the total income( national income) is received by each income group.
68.
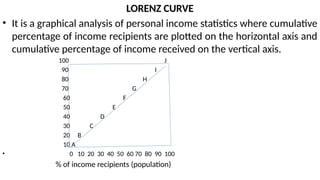
LORENZ CURVE
• Itis a graphical analysis of personal income statistics where cumulative
percentage of income recipients are plotted on the horizontal axis and
cumulative percentage of income received on the vertical axis.
100 J
90 I
80 H
70 G
60 F
50 E
40 D
30 C
20 B
10 A
• 0 10 20 30 40 50 60 70 80 90 100
% of income recipients (population)
69.
The diagonal linedrawn from lower left corner to the upper right
corner is the line of equality where the percentage of income
received is exactly equal; to the percentage of income recipients.
For instance, at the half way (mid point on the line), 50% of the
income is exactly distributed to 50% of the population.
The Lorenz curve shows the actual quantitative relationship
between the percentage of income recipients and the percentage
of the total income that they did receive.
Point A shows that the bottom 10% of the population receives
1.8% of the total income.
Point B shows that the bottom 20% of the population receives 54%
of the total income.
70.
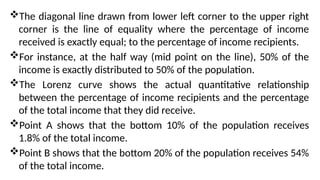
The more theLorenz curve is away from the diagonal, the greater the
degree of inequality.
The extreme case of perfect inequality i.e. a situation in which one
person receives all of the national income while everybody else
receives nothing would be represented by the congruence
(overlapping) of the Lorenz curve with the bottom horizontal and right
hand vertical axis.
No country shows either perfect equality or perfect inequality in
income distribution, hence, the Lorenz curve lies somewhere to the
right of the diagonal.
71.
100
80
80
60
60
30 30
10 10
O10 30 60 80 100
A. a relatively equal distribution B. a relatively unequal
distribution
The greater the degree of inequality, the greater the bend and the closer to the bottom horizontal
axis the Lorenz curve will be.
0 10 30 60 80 100
%
of
income
received
%
of
income
received
100
80
60
30
10
0
72.
SHIFTING LORENZ CURVE
Inhis book poverty, inequality and development, Gary S. Fields
demonstrates how Lorenz curves can be used to analyze three limiting
cases of dualistic development along the lines suggested by the Lewis
model. He distinguished three stylized development typologies;
(A). The modern sector growth typology, in which a two sector economy
(agriculture and industry) develops by enlarging the size of its modern
sector while maintaining constant wages in both sectors. This is the case
as shown by the Lewis model.
It roughly corresponds to the historical growth pattern of western
developed nations and, to a lesser extent, on the experience of
countries like Japan, South Korea and Taiwan.
73.
B. The modernsector enrichment growth typology, in which the
economy grows but such growth is limited to a fixed number of people
in the modern sector, with both the number of workers and their
wages held constant in the traditional sector. This has been the
experience of many Latin American and African countries.
C. The traditional sector enrichment growth typology, in which all of
growth is equally, divided among traditional sector workers, with little
or no growth occurring in the modern sector. This was the case in
China and few other revolutionary socialist economies.
Using these three special cases and Lorenz curve, G.S. Fields was able to
demonstrate the validity of the following propositions. Reversing the
above order i.e. moving from C to B and then to A,
74.
Cont..
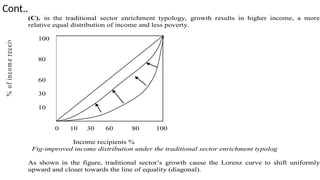
(C). in thetraditional sector enrichment typology, growth results in higher income, a more
relative equal distribution of income and less poverty.
Income recipients %
Fig-improved income distribution under the traditional sector enrichment typolog
As shown in the figure, traditional sector’s growth cause the Lorenz curve to shift uniformly
upward and closer towards the line of equality (diagonal).
100
80
60
30
10
0 10 30 60 80 100
%
of
incom
e
receiv
ed
75.
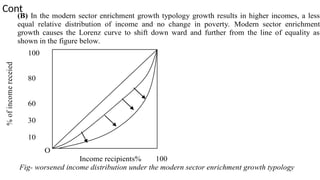
Cont
(B) In themodern sector enrichment growth typology growth results in higher incomes, a less
equal relative distribution of income and no change in poverty. Modern sector enrichment
growth causes the Lorenz curve to shift down ward and further from the line of equality as
shown in the figure below.
O
Income recipients% 100
Fig- worsened income distribution under the modern sector enrichment growth typology
%
of
income
receied
100
80
60
30
10
0
76.
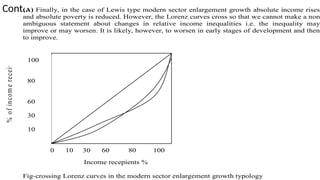
Cont..
(A) Finally, inthe case of Lewis type modern sector enlargement growth absolute income rises
and absolute poverty is reduced. However, the Lorenz curves cross so that we cannot make a non
ambiguous statement about changes in relative income inequalities i.e. the inequality may
improve or may worsen. It is likely, however, to worsen in early stages of development and then
to improve.
Income recepients %
Fig-crossing Lorenz curves in the modern sector enlargement growth typology
%
o
f
in
co
m
e
receiv
ed
100
80
60
30
10
0
0 10 30 60 80 100
100
80
60
30
10
0
77.
The Gini indexor Gini coefficient is a statistical measure of distribution which
was developed by the Italian statistician Corrado Gini in 1912.
It is used as a gauge of economic inequality, measuring income distribution
among a population.
The coefficient ranges from 0 (or 0%) to 1 (or 100%), with 0 representing perfect
equality and 1 representing perfect inequality.
Values over 1 are not practically possible as we don’t take into account the
negative incomes. (Income can be 0 at its lowest but not negative)
Thus, a country in which every resident has the same income would have an
income Gini coefficient of 0. A country in which one resident earned all the
income, while everyone else earned nothing, would have an income Gini
coefficient of 1.
78.
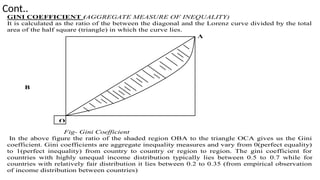
Cont..
GINI COEFFICIENT (AGGREGATEMEASURE OF INEQUALITY)
It is calculated as the ratio of the between the diagonal and the Lorenz curve divided by the total
area of the half square (triangle) in which the curve lies.
A
B
Fig- Gini Coefficient
In the above figure the ratio of the shaded region OBA to the triangle OCA gives us the Gini
coefficient. Gini coefficients are aggregate inequality measures and vary from 0(perfect equality)
to 1(perfect inequality) from country to country or region to region. The gini coefficient for
countries with highly unequal income distribution typically lies between 0.5 to 0.7 while for
countries with relatively fair distribution it lies between 0.2 to 0.35 (from empirical observation
of income distribution between countries)
O


![CLIMATE CHANGE ready .pptx [Autosaved].pptx](https://cdn.slidesharecdn.com/ss_thumbnails/climatechangeready-250328202202-a1b6acf9-thumbnail.jpg?width=640&height=640&fit=bounds)


