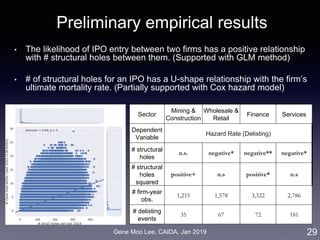
Download to read offline


![Gene Moo Lee, CAIDA, Jan 2019
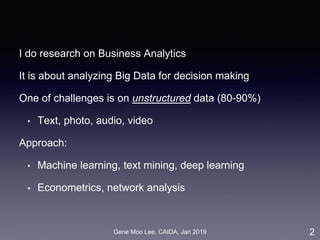
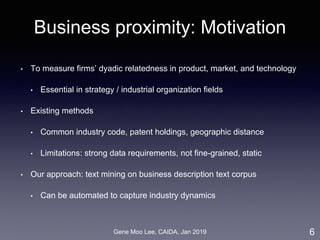
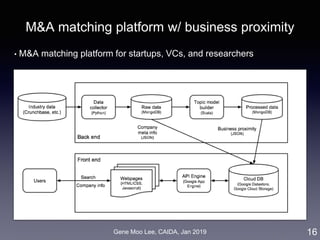
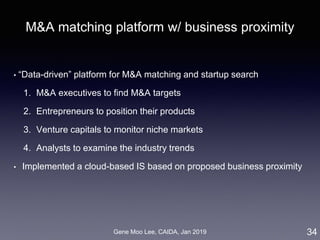
Our approach on business proximity
• Approach: LDA topic modeling [Blei et al. 2003]
• Unsupervised learning to discover latent “topics” from a large
collection of documents
• Business proximity = cosine similarity of topic distributions
7
LDA
Industry-wide topics
Company’s topics
Company
descriptions](https://image.slidesharecdn.com/20190121caidagene-190122174454/85/Developing-A-Big-Data-Analytics-Framework-for-Industry-Intelligence-7-320.jpg)
![Gene Moo Lee, CAIDA, Jan 2019
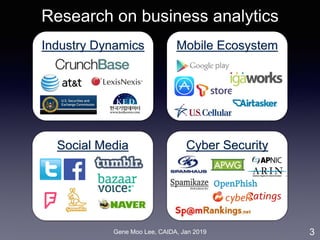
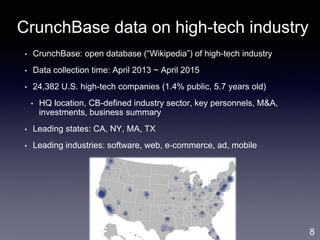
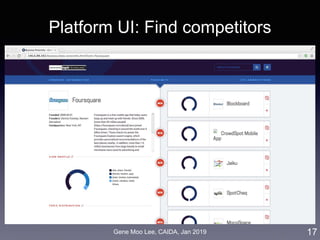
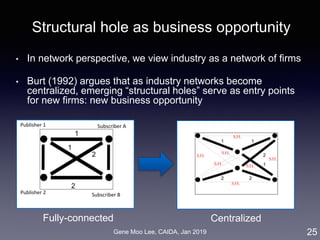
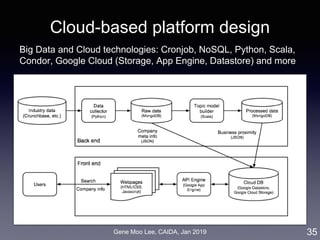
ERGM for M&A network
ERGM (Exponential Random Graph Model):
• Based on random graph [Erdos and Renyi 1959]
• Probability of realizing a graph = a function of the graph’s
statistics [Robins et al. 2007]
• Inter-firm proximity: business, geographic, social, co-invest
• Selective mixing: 50 states, 30 industry sectors
• Degree distribution: node degree, M&A experiences
11
degree selective mixing proximity](https://image.slidesharecdn.com/20190121caidagene-190122174454/85/Developing-A-Big-Data-Analytics-Framework-for-Industry-Intelligence-11-320.jpg)
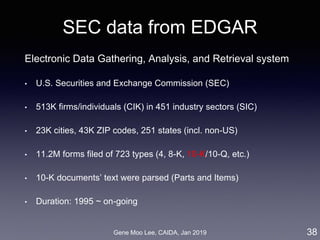
![Gene Moo Lee, CAIDA, Jan 2019
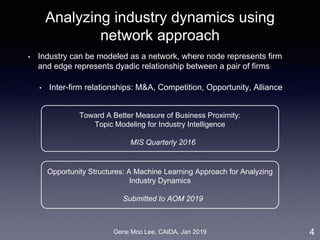
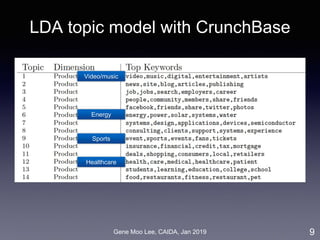
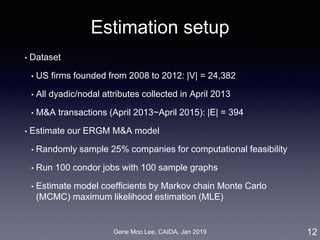
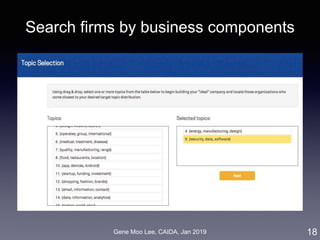
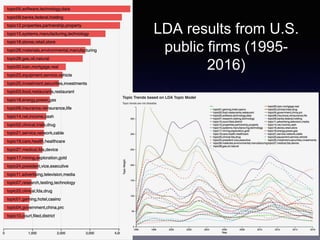
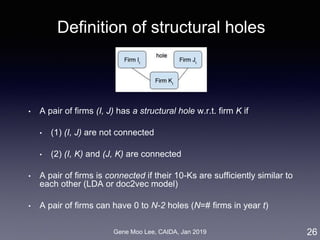
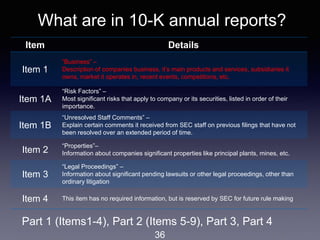
Data: Annual reports of U.S. public firms
• Form 10-K filings from SEC EDGAR: 165K reports (1995-2016)
• Use doc2vec [Le & Mikolov 2014] to get semantic vectors of 10-Ks
• Data: IPO/delisting events, financial and accounting metrics
27](https://image.slidesharecdn.com/20190121caidagene-190122174454/85/Developing-A-Big-Data-Analytics-Framework-for-Industry-Intelligence-27-320.jpg)

![Gene Moo Lee, CAIDA, Jan 2019
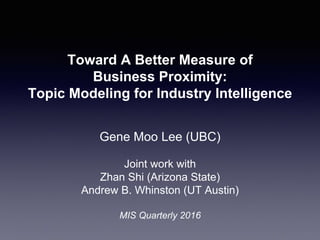
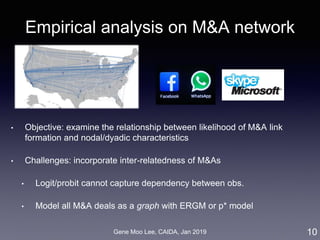
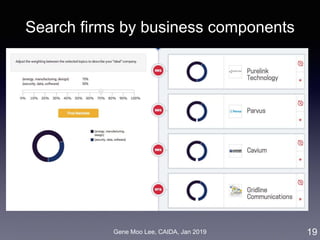
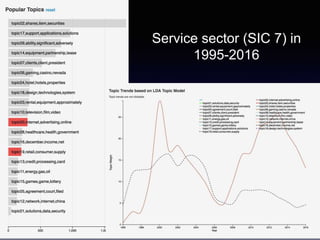
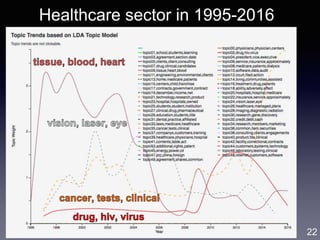
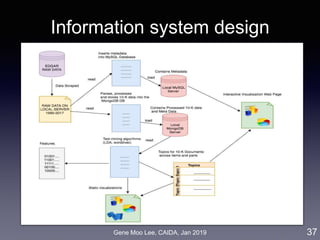
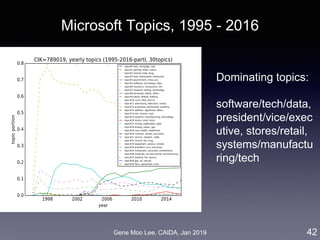
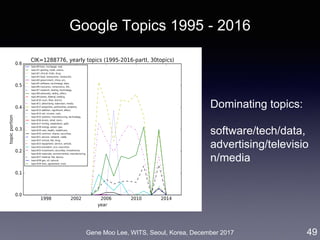
Analysis I: Trend analysis with LDA
• Approach: LDA topic modeling [Blei et al. 2003]
• Unsupervised learning to discover latent “topics” from a large
collection of documents
• Each document is represented as a distribution over the topics
41
LDA
Industry-wide topics
Company’s topics
Business
descriptions
(10-K)](https://image.slidesharecdn.com/20190121caidagene-190122174454/85/Developing-A-Big-Data-Analytics-Framework-for-Industry-Intelligence-41-320.jpg)
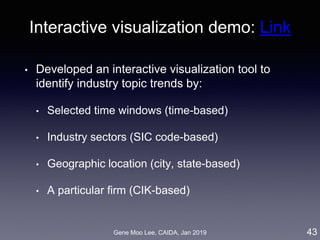
![Gene Moo Lee, CAIDA, Jan 2019
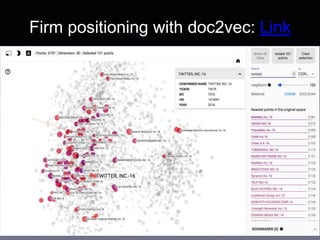
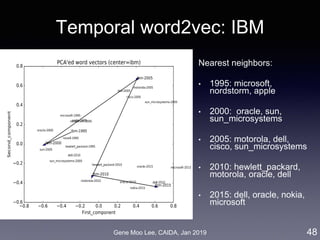
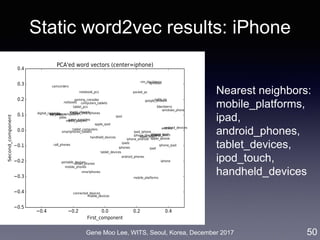
Analysis II: Competitive analysis with word2vec
• Approach: word embedding called word2vec [Mikolov et al. 2013]
• Represent words in a high-dimensional vector space where
semantically similar words are nearby
• Train a model that maximizes prediction of words co-occurrence
(K words before/after the focal word)
• Competition level = distance between word vectors
44
Word2Vec
Business
descriptions
(10-K)](https://image.slidesharecdn.com/20190121caidagene-190122174454/85/Developing-A-Big-Data-Analytics-Framework-for-Industry-Intelligence-44-320.jpg)

The document discusses the development of a big data analytics framework for industry intelligence, focusing on business analytics and the challenges of unstructured data. It details an approach using machine learning, particularly topic modeling and network analysis, to analyze industry dynamics and improve measures of business proximity among firms. Additionally, it outlines a matching platform for mergers and acquisitions (M&A) leveraging business proximity insights to enhance decision-making for startups and investors.


![제 23회 보아즈(BOAZ) 빅데이터 컨퍼런스 - [MBOAX] : ABSA를 활용한 소비자 반응 분석 기반 운영 효율화 대시보드 설계](https://cdn.slidesharecdn.com/ss_thumbnails/3-1boaz23rdconferencemboax-260203102709-9d519923-thumbnail.jpg?width=640&height=640&fit=bounds)


