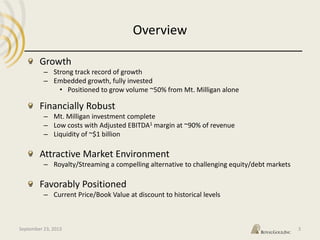
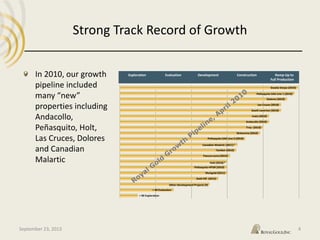
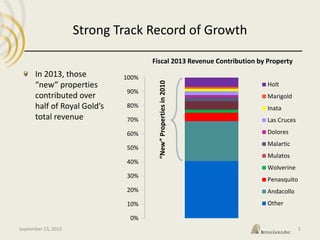
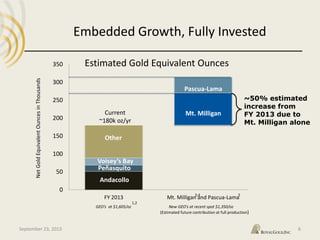
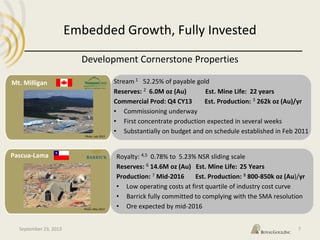
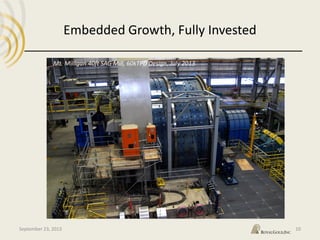
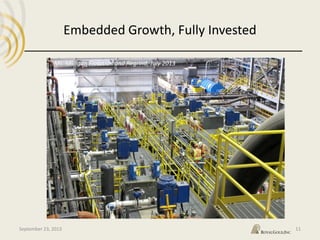
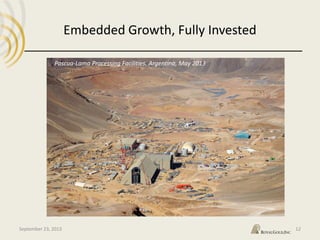
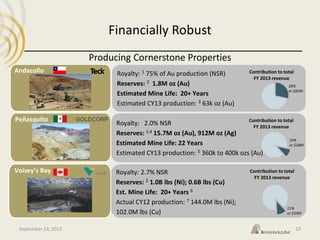
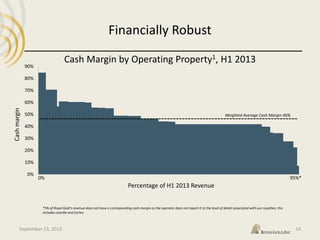
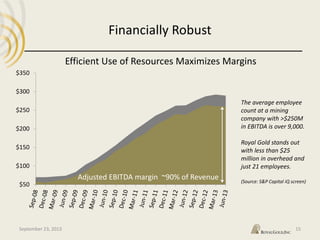
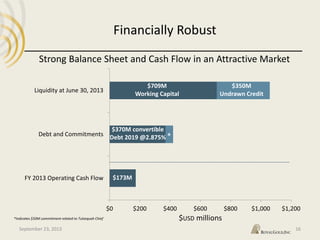
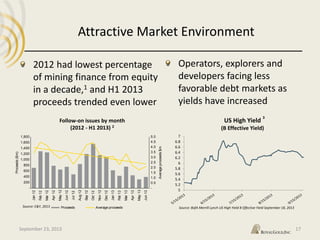
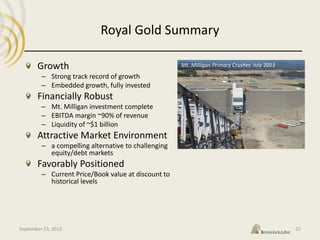
Denver Gold Forum 2013
Tony Jensen, President and CEO
September 23, 2013
Cautionary Statement
40
This presentation contains certain forward‐looking statements within the meaning of the Private Securities Litigation Reform Act of 1995. Such forward-
looking statements involve known and unknown risks, uncertainties, and other factors that could cause actual results to differ materially from the
projections and estimates contained herein and include, but are not limited to, the statements that Royal Gold is a high margin, low cost business; that
the Company holds a portfolio of long lived, high quality core assets; that full production at Mt. Milligan would comprise 50% of our 2013 net gold
equivalent ounces production; that the Company expects to see future production of net gold equivalent ounces due to both Mt. Milligan and
Pascua‐Lama; that commercial production is expected during the fourth quarter of calendar 2013 at Mt. Milligan; that Mt. Milligan has many attractive
qualities including a favorable geographic location, strong local and regional infrastructure, long mine life, decreased construction risk and permitting, a
low strip ratio, exploration upside and attractive operating economics; that Royal Gold has maintained cost and capital allocation discipline; and that
the Company is confident in the long term value of Pascua-Lama. Factors that could cause actual results to differ materially from these forward‐looking
statements include, among others: the risks inherent in construction, development and operation of mining properties, including those specific to a new
mine being developed and operated by a base metals company, such as Mt. Milligan, and those specific to the development and operation of a major
new mine, such as Pascua-Lama; changes in gold and other metals prices; decisions and activities of the Company’s management; unexpected operating
costs; environmental and permit problems; litigation and other government regulation or action on Pascua-Lama; decisions and activities of the
operators of the Company’s royalty and stream properties; unanticipated grade, geological, metallurgical, processing or other problems at the
properties; inaccuracies in technical reports and reserve estimates; revisions by operators of reserves, mineralization or production estimates; changes
in project parameters as plans of the operators are refined; the results of current or planned exploration activities; discontinuance of exploration
activities by operators; economic and market conditions; operations in land subject to First Nations jurisdiction in Canada; the ability of operators to
bring non‐producing and not yet in development projects into production and operate in accordance with feasibility studies; erroneous royalty payment
calculations; title defects to royalty properties; future financial needs of the Company; the impact of future acquisitions and royalty and stream financing
transactions; adverse changes in applicable laws and regulations; litigation; and risks associated with conducting business in foreign countries, including
application of foreign laws to contract and other disputes, environmental laws, enforcement and uncertain political and economic environments. These
risks and other factors are discussed in more detail in the Company’s public filings with the Securities and Exchange Commission. Statements made
herein are as of the date hereof and should not be relied upon as of any subsequent date. The Company’s past performance is not necessarily indicative
of its future performance. The Company disclaims any obligation to update any forward‐looking statements.
The Company and its affiliates, agents, directors and employees accept no liability whatsoever for any loss or damage of any kind arising out of the use
of all or any part of this material.
Endnotes located on page 23.
September 23, 2013 2
Overview
September 23, 2013 3
Growth
– Strong track record of growth
– Embedded growth, fully invested
• Positioned to grow volume ~50% from Mt. Milligan alone
Financially Robust
– Mt. Milligan investment complete
– Low costs with Adjusted EBITDA1 margin at ~90% of revenue
– Liquidity of ~$1 billion
Attractive Market Environment
– Royalty/Streaming a compelling alternative to challenging equity/debt markets
Favorably Positioned
– Current Price/Book Value at discount to historical levels
> 90 Exploration
> 40 Evaluation
Gold Hill (2012)
Marigold (2011)
Pascua-Lama (2013)
Tambor (2010)
Wolverine (2010)
Troy (2010)
Andacollo (2010)
Inata (2010)
South Laverton (2010)
Las Cruces (2010)
Dolores (2010)
Gwalia Deeps (2010)
Exploration Evaluation Development Construction Ramp-Up to
Full Production
Other Development Projects (9)
Peñasquito HPGR (2010)
Canadian Malartic (2011) 2
Peñasquito SAG Line 2 (2010)
Peñasquito SAG Line 1 (2010)
Holt (2010) 3
Strong Track Record of Growth
September 23, 2013
In 2010, our growth
pipeline included
many “new”
properties including
Andacollo,
Peñasquito, Holt,
Las Cruces, Dolores
and Canadian
Malartic
4
Fiscal 2013 Revenue Contribution by Property
Strong Track Record of Growth
September 23, 2013
In 2013, those
“new” properties
contributed over
half of Royal Gold’s
total revenue
5
0%
10%
20%
30%
40%
50%
60%
70%
80%
90%
100%
Holt
Marigold
Inata
Las Cruces
Dolores
Malartic
Mulatos
Wolverine
Penasquito
Andacollo
Other
“New”Propertiesin2010
GEO’s at $1,605/oz New GEO’s at recent spot $1,350/oz
0
50
100
150
200
250
300
350
FY 2013 Mt. Milligan and Pascua-Lama
NetGoldEquivalentOuncesinThousands
Estimated Gold Equivalent Ounces
1,2
3,4 5
~50% estimated
increase from
FY 2013 due to
Mt. Milligan alone
(Estimated future contribution at full production)
Current
~180k oz/yr
Mt. Milligan
Pascua-Lama
Peñasquito
Voisey’s Bay
Other
Andacollo
Embedded Growth, Fully Invested
September 23, 2013 6
Embedded Growth, Fully Invested
Development Cornerstone Properties
7
Mt. Milligan
Pascua-Lama
Photo: May 2013
Stream: 1 52.25% of payable gold
Reserves: 2 6.0M oz (Au) Est. Mine Life: 22 years
Commercial Prod: Q4 CY13 Est. Production: 3 262k oz (Au)/yr
• Commissioning underway
• First concentrate production expected in several weeks
• Substantially on budget and on schedule established in Feb 2011
Royalty: 4,5 0.78% to 5.23% NSR sliding scale
Reserves: 6 14.6M oz (Au) Est. Mine Life: 25 Years
Production: 7 Mid-2016 Est. Production: 8 800-850k oz (Au)/yr
• Low operating costs at first quartile of industry cost curve
• Barrick fully committed to complying with the SMA resolution
• Ore expected by mid-2016
September 23, 2013
Photo: July 2013
Embedded Growth, Fully Invested
8
Mt. Milligan Facilities, July 2013
September 23, 2013
Embedded Growth, Fully Invested
9
Mt. Milligan Primary Crusher, July 2013
September 23, 2013
10
Mt. Milligan 40ft SAG Mill, 60kTPD Design, July 2013
Embedded Growth, Fully Invested
September 23, 2013
40
Mt. Milligan Flotation and Regrind, July 2013
Embedded Growth, Fully Invested
September 23, 2013 11
40
Embedded Growth, Fully Invested
September 23, 2013 12
Pascua-Lama Processing Facilities, Argentina, May 2013
Financially Robust
Andacollo
Peñasquito
Voisey’s Bay
Producing Cornerstone Properties
September 23, 2013
Royalty: 2.0% NSR
Reserves: 2,4 15.7M oz (Au), 912M oz (Ag)
Estimated Mine Life: 22 Years
Estimated CY13 production: 5 360k to 400k ozs (Au)
Royalty: 1 75% of Au production (NSR)
Reserves: 2 1.8M oz (Au)
Estimated Mine Life: 20+ Years
Estimated CY13 production: 3 63k oz (Au)
Royalty: 2.7% NSR
Reserves: 2 1.0B lbs (Ni); 0.6B lbs (Cu)
Est. Mine Life: 20+ Years 6
Actual CY12 production: 7 144.0M lbs (Ni);
102.0M lbs (Cu)
13
Contribution to total
FY 2013 revenue
28%
or $82M
Contribution to total
FY 2013 revenue
Contribution to total
FY 2013 revenue
10%
or $28M
11%
or $33M
0%
10%
20%
30%
40%
50%
60%
70%
80%
90%
Financially Robust
14
Cash Margin by Operating Property1, H1 2013
Weighted Average Cash Margin 46%
Cashmargin
Percentage of H1 2013 Revenue
0% 95%*
*5% of Royal Gold’s revenue does not have a corresponding cash margin as the operator does not report it to the level of detail associated with our royalties; this
includes Leeville and Cortez.
September 23, 2013
The average employee
count at a mining
company with >$250M
in EBITDA is over 9,000.
Royal Gold stands out
with less than $25
million in overhead and
just 21 employees.
(Source: S&P Capital iQ screen)
Financially Robust
$50
$100
$150
$200
$250
$300
$350
Adjusted EBITDA margin ~90% of Revenue
Efficient Use of Resources Maximizes Margins
September 23, 2013 15
$0 $200 $400 $600 $800 $1,000 $1,200
FY 2013 Operating Cash Flow
Debt and Commitments
Liquidity at June 30, 2013
Financially Robust
16
$709M
Working Capital
$350M
Undrawn Credit
$370M convertible
Debt 2019 @2.875%
$USD millions
Strong Balance Sheet and Cash Flow in an Attractive Market
September 23, 2013
$173M
*
*Indicates $50M commitment related to Tulsequah Chief
Attractive Market Environment
September 23, 2013 17
Source: E&Y, 2013
2012 had lowest percentage
of mining finance from equity
in a decade,1 and H1 2013
proceeds trended even lower
Operators, explorers and
developers facing less
favorable debt markets as
yields have increased
5
5.2
5.4
5.6
5.8
6
6.2
6.4
6.6
6.8
7
US High Yield
(B Effective Yield)
3
Source: BofA Merrill Lynch US High Yield B Effective Yield September 18, 2013
-
0.5
1.0
1.5
2.0
2.5
3.0
3.5
4.0
4.5
5.0
-
200
400
600
800
1,000
1,200
1,400
1,600
1,800
Jan12
Feb12
Mar12
Apr12
May12
Jun12
Jul12
Aug12
Sep12
Oct12
Nov12
Dec12
Jan13
Feb13
Mar13
Apr13
May13
Jun13
Averageproceeds$m
Proceeds($m)
Proceeds Average proceeds
Follow-on issues by month
(2012 - H1 2013) 2
Attractive Market Environment
September 23, 2013 18
Capital Consuming 1
Average 10 - 15 years
Capital Generating 2
10 - 30+ years
Average mine development cycle capital intensive but delivers
long term cash flow optionality
Attractive Market Environment
September 23, 2013 19
Peñasquito Case Study
Development Cycle and Optionality
1950’s
First drill
holes
1994
Formal
exploration
program
2006
Royal Gold
acquires
royalty;
gold
reserves at
10M oz
2009
First sales
begin, 15
years after
formal
exploration
commenced
2012
Gold
reserves
are greater
than 15M
oz with a
23 year
mine life
During this period the mine’s ownership
changed hands six times, royalty unaffected
Royal Gold
carrying cost =
$102/EqOz Au
54% 36% 36% 37%
31% 44% 48% 48%
14% 20% 16% 15%
0%
10%
20%
30%
40%
50%
60%
70%
80%
90%
100%
2010A 2011A 2012A 2013A
Primary Gold Mines Polymetallic Mines Base Metal Mines
Attractive Market Environment
Multiple Sources for New Business Opportunities
The largest
source of our
gold revenue
in fiscal 2013
was non-
precious
metals mines
September 23, 2013 20
0
0.5
1
1.5
2
2.5
3
3.5
4
4.5
RGLD Price / Book Value
September 23, 2013 21
Favorably Positioned
Share Price Remains at Discount to Historical Multiples 1
5 year average: 2.5x
Current: 1.5x
Source: Ycharts. Book value is the company's total tangible assets less its total liabilities and shareholders’ equity.
Royal Gold Summary
September 23, 2013 22
Growth
– Strong track record of growth
– Embedded growth, fully invested
Financially Robust
– Mt. Milligan investment complete
– EBITDA margin ~90% of revenue
– Liquidity of ~$1 billion
Attractive Market Environment
– a compelling alternative to challenging
equity/debt markets
Favorably Positioned
– Current Price/Book value at discount to
historical levels
Mt. Milligan Primary Crusher, July 2013
Endnotes
PAGE 3 OVERVIEW
1. Adjusted EBITDA is defined by the Company as net income
plus depreciation, depletion and amortization, non-cash
charges, income tax expense, interest and other expense,
and any impairment of mining assets, less non-controlling
interests in operating income of consolidated subsidiaries,
interest and other income, and any royalty portfolio
restructuring gains or losses.
PAGE 6 EMBEDDED GROWTH, FULLY INVESTED
1. Gold equivalent ounces for fiscal 2013 were calculated by
dividing actual revenue by the average gold price of $1,605
for fiscal 2013.
2. Net gold equivalent ounces are calculated by applying the
Company’s interests in production at each individual
property, and considering the per ounce delivery payment
associated with metal streams as a reduction to gross
ounces.
3. Gold equivalent ounces for the future period were
calculated by dividing future estimated revenue by the
current spot price of approximately $1,350 on September
18, 2013.
4. As reported by the operator, net gold equivalent ounces at
Mt. Milligan are based upon operator’s estimated annual
production rate of 262,100 ounces of gold for the first six
years using a gold price of $1,350 per ounce for conversion
purposes of the delivery payment.
5. As reported by the operator, net gold equivalent ounces at
Pascua-Lama are based upon operator’s estimated annual
production rate of 800,000 to 850,000 ounces of gold
during the first five years. Barrick has announced that
development at Pascua-Lama has been suspended
pending the outcome of regulatory and litigation
challenges.
PAGE 7 EMBEDDED GROWTH, FULLY INVESTED: DEVELOPMENT
CORNERSTONE PROPERTIES
1. This is a metal stream whereby the purchase price for gold
ounces delivered is $435 per ounce, or the prevailing
market price of gold, if lower; no inflation adjustment. Per
Thompson Creek’s National Instrument 43-101 technical
report filed on SEDAR, under Thompson Creek’s profile, on
October 13, 2011.
2. Reserves as of October 23, 2009.
3. Estimated production of 262,000 ounces of gold annually
during the first six years; 195,000 ounces of gold
thereafter, per Thompson Creek’s National Instrument 43-
101 technical report filed on SEDAR, under Thompson
Creek’s profile, on October 13, 2011.
4 NSR sliding-scale schedule (price of gold per ounce – royalty
rate): less than or equal to $325 – 0.78%; $400 – 1.57%;
$500 – 2.72%; $600 – 3.56%; $700 – 4.39%; greater than or
equal to $800 – 5.23%. The royalty is interpolated between
upper and lower endpoints.
5. Approximately 20% of the royalty is limited to the first
14.0M ounces of gold produced from the project. Also, 24%
of the royalty can be extended beyond 14.0 million ounces
produced for $4.4 million. In addition, a one-time payment
totaling $8.4 million will be made if gold prices exceed $600
per ounce for any six-month period within the first 36
months of commercial production.
6. Reserves as of December 31, 2011. Royalty applies to all
gold production from an area of interest in Chile. Only that
portion of reserves pertaining to our royalty interest in
Chile is reflected here.
7. Barrick has announced that development at Pascua-Lama
has been suspended pending the outcome of regulatory
and litigation challenges.
8. Based on Barrick’s guidance of 800,000-850,000oz of gold
production during the first five years.
PAGE 13 FINANCIALLY ROBUST:
PRODUCING CORNERSTONE PROPERTIES
1. 75% of payable gold until 910,000 payable ounces;
50% thereafter. As of June 30, 2013, there have been
approximately 167,000 cumulative payable ounces
produced.
2. Reserves as of December 31, 2012, as reported by the
operator.
3. Recovered metal is contained in concentrate and is subject
to third party treatment charges and recovery losses.
4. Reserves also include 5.8 billion pounds of lead and 13.9
billion pounds of zinc.
5. Goldcorp’s CY2013 estimated production also includes 20
million to 21 million ounces of silver, 145 million to 160
million pounds of lead and 285 million to 305 million
pounds of zinc.
6. Per BoAML 2008 Vale Inco EIS
7. FY2013 actual production also included 2.7 million pounds
of cobalt.
PAGE 17 ATTRACTIVE MARKET ENVIRONMENT
1. Source: PWC, “Mine 2013: A Confidence Crisis” Page 28.
2. Source: Ernst and Young, “Mergers, Acquisitions and Capital
Raising in Mining and Metals, H1 2013” Page 8.
3. Source: Bank of America Merrill Lynch Index Yields
PAGE 18 ATTRACTIVE MARKET ENVIRONMENT
1. Source: Minerals Council of Australia “Life Cycle of a Mine,”
Royal Gold Estimates
2. Source: Royal Gold estimates from reserve lives; includes
both polymetallic deposits
PAGE 19 ATTRACTIVE MARKET ENVIRONMENT
1. Carrying cost per ounce was calculated by dividing the
amount of Royal Gold’s Peñasquito mineral interests by the
number of GEO’s attributable to Royal Gold’s royalty
interest at the property at $1,523 per gold ounce.
PAGE 21 FAVORABLY POSITIONED
1. Source: Ycharts.
2. Book value is the Company’s tangible assets less its total
liabilities and shareholders’ equity.
Many of the matters in these endnotes and the accompanying slides constitute forward looking statements and are subject to numerous risks, which could cause actual results to
differ. See complete Cautionary Statement on page 2.
23
1660 Wynkoop Street
Denver, CO 80202-1132
303.573.1660
info@royalgold.com
www.royalgold.com

Denver gold forum screencast

  • 1.
    Denver Gold Forum2013 Tony Jensen, President and CEO September 23, 2013
  • 2.
    Cautionary Statement 40 This presentationcontains certain forward‐looking statements within the meaning of the Private Securities Litigation Reform Act of 1995. Such forward- looking statements involve known and unknown risks, uncertainties, and other factors that could cause actual results to differ materially from the projections and estimates contained herein and include, but are not limited to, the statements that Royal Gold is a high margin, low cost business; that the Company holds a portfolio of long lived, high quality core assets; that full production at Mt. Milligan would comprise 50% of our 2013 net gold equivalent ounces production; that the Company expects to see future production of net gold equivalent ounces due to both Mt. Milligan and Pascua‐Lama; that commercial production is expected during the fourth quarter of calendar 2013 at Mt. Milligan; that Mt. Milligan has many attractive qualities including a favorable geographic location, strong local and regional infrastructure, long mine life, decreased construction risk and permitting, a low strip ratio, exploration upside and attractive operating economics; that Royal Gold has maintained cost and capital allocation discipline; and that the Company is confident in the long term value of Pascua-Lama. Factors that could cause actual results to differ materially from these forward‐looking statements include, among others: the risks inherent in construction, development and operation of mining properties, including those specific to a new mine being developed and operated by a base metals company, such as Mt. Milligan, and those specific to the development and operation of a major new mine, such as Pascua-Lama; changes in gold and other metals prices; decisions and activities of the Company’s management; unexpected operating costs; environmental and permit problems; litigation and other government regulation or action on Pascua-Lama; decisions and activities of the operators of the Company’s royalty and stream properties; unanticipated grade, geological, metallurgical, processing or other problems at the properties; inaccuracies in technical reports and reserve estimates; revisions by operators of reserves, mineralization or production estimates; changes in project parameters as plans of the operators are refined; the results of current or planned exploration activities; discontinuance of exploration activities by operators; economic and market conditions; operations in land subject to First Nations jurisdiction in Canada; the ability of operators to bring non‐producing and not yet in development projects into production and operate in accordance with feasibility studies; erroneous royalty payment calculations; title defects to royalty properties; future financial needs of the Company; the impact of future acquisitions and royalty and stream financing transactions; adverse changes in applicable laws and regulations; litigation; and risks associated with conducting business in foreign countries, including application of foreign laws to contract and other disputes, environmental laws, enforcement and uncertain political and economic environments. These risks and other factors are discussed in more detail in the Company’s public filings with the Securities and Exchange Commission. Statements made herein are as of the date hereof and should not be relied upon as of any subsequent date. The Company’s past performance is not necessarily indicative of its future performance. The Company disclaims any obligation to update any forward‐looking statements. The Company and its affiliates, agents, directors and employees accept no liability whatsoever for any loss or damage of any kind arising out of the use of all or any part of this material. Endnotes located on page 23. September 23, 2013 2
  • 3.
    Overview September 23, 20133 Growth – Strong track record of growth – Embedded growth, fully invested • Positioned to grow volume ~50% from Mt. Milligan alone Financially Robust – Mt. Milligan investment complete – Low costs with Adjusted EBITDA1 margin at ~90% of revenue – Liquidity of ~$1 billion Attractive Market Environment – Royalty/Streaming a compelling alternative to challenging equity/debt markets Favorably Positioned – Current Price/Book Value at discount to historical levels
  • 4.
    > 90 Exploration >40 Evaluation Gold Hill (2012) Marigold (2011) Pascua-Lama (2013) Tambor (2010) Wolverine (2010) Troy (2010) Andacollo (2010) Inata (2010) South Laverton (2010) Las Cruces (2010) Dolores (2010) Gwalia Deeps (2010) Exploration Evaluation Development Construction Ramp-Up to Full Production Other Development Projects (9) Peñasquito HPGR (2010) Canadian Malartic (2011) 2 Peñasquito SAG Line 2 (2010) Peñasquito SAG Line 1 (2010) Holt (2010) 3 Strong Track Record of Growth September 23, 2013 In 2010, our growth pipeline included many “new” properties including Andacollo, Peñasquito, Holt, Las Cruces, Dolores and Canadian Malartic 4
  • 5.
    Fiscal 2013 RevenueContribution by Property Strong Track Record of Growth September 23, 2013 In 2013, those “new” properties contributed over half of Royal Gold’s total revenue 5 0% 10% 20% 30% 40% 50% 60% 70% 80% 90% 100% Holt Marigold Inata Las Cruces Dolores Malartic Mulatos Wolverine Penasquito Andacollo Other “New”Propertiesin2010
  • 6.
    GEO’s at $1,605/ozNew GEO’s at recent spot $1,350/oz 0 50 100 150 200 250 300 350 FY 2013 Mt. Milligan and Pascua-Lama NetGoldEquivalentOuncesinThousands Estimated Gold Equivalent Ounces 1,2 3,4 5 ~50% estimated increase from FY 2013 due to Mt. Milligan alone (Estimated future contribution at full production) Current ~180k oz/yr Mt. Milligan Pascua-Lama Peñasquito Voisey’s Bay Other Andacollo Embedded Growth, Fully Invested September 23, 2013 6
  • 7.
    Embedded Growth, FullyInvested Development Cornerstone Properties 7 Mt. Milligan Pascua-Lama Photo: May 2013 Stream: 1 52.25% of payable gold Reserves: 2 6.0M oz (Au) Est. Mine Life: 22 years Commercial Prod: Q4 CY13 Est. Production: 3 262k oz (Au)/yr • Commissioning underway • First concentrate production expected in several weeks • Substantially on budget and on schedule established in Feb 2011 Royalty: 4,5 0.78% to 5.23% NSR sliding scale Reserves: 6 14.6M oz (Au) Est. Mine Life: 25 Years Production: 7 Mid-2016 Est. Production: 8 800-850k oz (Au)/yr • Low operating costs at first quartile of industry cost curve • Barrick fully committed to complying with the SMA resolution • Ore expected by mid-2016 September 23, 2013 Photo: July 2013
  • 8.
    Embedded Growth, FullyInvested 8 Mt. Milligan Facilities, July 2013 September 23, 2013
  • 9.
    Embedded Growth, FullyInvested 9 Mt. Milligan Primary Crusher, July 2013 September 23, 2013
  • 10.
    10 Mt. Milligan 40ftSAG Mill, 60kTPD Design, July 2013 Embedded Growth, Fully Invested September 23, 2013
  • 11.
    40 Mt. Milligan Flotationand Regrind, July 2013 Embedded Growth, Fully Invested September 23, 2013 11
  • 12.
    40 Embedded Growth, FullyInvested September 23, 2013 12 Pascua-Lama Processing Facilities, Argentina, May 2013
  • 13.
    Financially Robust Andacollo Peñasquito Voisey’s Bay ProducingCornerstone Properties September 23, 2013 Royalty: 2.0% NSR Reserves: 2,4 15.7M oz (Au), 912M oz (Ag) Estimated Mine Life: 22 Years Estimated CY13 production: 5 360k to 400k ozs (Au) Royalty: 1 75% of Au production (NSR) Reserves: 2 1.8M oz (Au) Estimated Mine Life: 20+ Years Estimated CY13 production: 3 63k oz (Au) Royalty: 2.7% NSR Reserves: 2 1.0B lbs (Ni); 0.6B lbs (Cu) Est. Mine Life: 20+ Years 6 Actual CY12 production: 7 144.0M lbs (Ni); 102.0M lbs (Cu) 13 Contribution to total FY 2013 revenue 28% or $82M Contribution to total FY 2013 revenue Contribution to total FY 2013 revenue 10% or $28M 11% or $33M
  • 14.
    0% 10% 20% 30% 40% 50% 60% 70% 80% 90% Financially Robust 14 Cash Marginby Operating Property1, H1 2013 Weighted Average Cash Margin 46% Cashmargin Percentage of H1 2013 Revenue 0% 95%* *5% of Royal Gold’s revenue does not have a corresponding cash margin as the operator does not report it to the level of detail associated with our royalties; this includes Leeville and Cortez. September 23, 2013
  • 15.
    The average employee countat a mining company with >$250M in EBITDA is over 9,000. Royal Gold stands out with less than $25 million in overhead and just 21 employees. (Source: S&P Capital iQ screen) Financially Robust $50 $100 $150 $200 $250 $300 $350 Adjusted EBITDA margin ~90% of Revenue Efficient Use of Resources Maximizes Margins September 23, 2013 15
  • 16.
    $0 $200 $400$600 $800 $1,000 $1,200 FY 2013 Operating Cash Flow Debt and Commitments Liquidity at June 30, 2013 Financially Robust 16 $709M Working Capital $350M Undrawn Credit $370M convertible Debt 2019 @2.875% $USD millions Strong Balance Sheet and Cash Flow in an Attractive Market September 23, 2013 $173M * *Indicates $50M commitment related to Tulsequah Chief
  • 17.
    Attractive Market Environment September23, 2013 17 Source: E&Y, 2013 2012 had lowest percentage of mining finance from equity in a decade,1 and H1 2013 proceeds trended even lower Operators, explorers and developers facing less favorable debt markets as yields have increased 5 5.2 5.4 5.6 5.8 6 6.2 6.4 6.6 6.8 7 US High Yield (B Effective Yield) 3 Source: BofA Merrill Lynch US High Yield B Effective Yield September 18, 2013 - 0.5 1.0 1.5 2.0 2.5 3.0 3.5 4.0 4.5 5.0 - 200 400 600 800 1,000 1,200 1,400 1,600 1,800 Jan12 Feb12 Mar12 Apr12 May12 Jun12 Jul12 Aug12 Sep12 Oct12 Nov12 Dec12 Jan13 Feb13 Mar13 Apr13 May13 Jun13 Averageproceeds$m Proceeds($m) Proceeds Average proceeds Follow-on issues by month (2012 - H1 2013) 2
  • 18.
    Attractive Market Environment September23, 2013 18 Capital Consuming 1 Average 10 - 15 years Capital Generating 2 10 - 30+ years Average mine development cycle capital intensive but delivers long term cash flow optionality
  • 19.
    Attractive Market Environment September23, 2013 19 Peñasquito Case Study Development Cycle and Optionality 1950’s First drill holes 1994 Formal exploration program 2006 Royal Gold acquires royalty; gold reserves at 10M oz 2009 First sales begin, 15 years after formal exploration commenced 2012 Gold reserves are greater than 15M oz with a 23 year mine life During this period the mine’s ownership changed hands six times, royalty unaffected Royal Gold carrying cost = $102/EqOz Au
  • 20.
    54% 36% 36%37% 31% 44% 48% 48% 14% 20% 16% 15% 0% 10% 20% 30% 40% 50% 60% 70% 80% 90% 100% 2010A 2011A 2012A 2013A Primary Gold Mines Polymetallic Mines Base Metal Mines Attractive Market Environment Multiple Sources for New Business Opportunities The largest source of our gold revenue in fiscal 2013 was non- precious metals mines September 23, 2013 20
  • 21.
    0 0.5 1 1.5 2 2.5 3 3.5 4 4.5 RGLD Price /Book Value September 23, 2013 21 Favorably Positioned Share Price Remains at Discount to Historical Multiples 1 5 year average: 2.5x Current: 1.5x Source: Ycharts. Book value is the company's total tangible assets less its total liabilities and shareholders’ equity.
  • 22.
    Royal Gold Summary September23, 2013 22 Growth – Strong track record of growth – Embedded growth, fully invested Financially Robust – Mt. Milligan investment complete – EBITDA margin ~90% of revenue – Liquidity of ~$1 billion Attractive Market Environment – a compelling alternative to challenging equity/debt markets Favorably Positioned – Current Price/Book value at discount to historical levels Mt. Milligan Primary Crusher, July 2013
  • 23.
    Endnotes PAGE 3 OVERVIEW 1.Adjusted EBITDA is defined by the Company as net income plus depreciation, depletion and amortization, non-cash charges, income tax expense, interest and other expense, and any impairment of mining assets, less non-controlling interests in operating income of consolidated subsidiaries, interest and other income, and any royalty portfolio restructuring gains or losses. PAGE 6 EMBEDDED GROWTH, FULLY INVESTED 1. Gold equivalent ounces for fiscal 2013 were calculated by dividing actual revenue by the average gold price of $1,605 for fiscal 2013. 2. Net gold equivalent ounces are calculated by applying the Company’s interests in production at each individual property, and considering the per ounce delivery payment associated with metal streams as a reduction to gross ounces. 3. Gold equivalent ounces for the future period were calculated by dividing future estimated revenue by the current spot price of approximately $1,350 on September 18, 2013. 4. As reported by the operator, net gold equivalent ounces at Mt. Milligan are based upon operator’s estimated annual production rate of 262,100 ounces of gold for the first six years using a gold price of $1,350 per ounce for conversion purposes of the delivery payment. 5. As reported by the operator, net gold equivalent ounces at Pascua-Lama are based upon operator’s estimated annual production rate of 800,000 to 850,000 ounces of gold during the first five years. Barrick has announced that development at Pascua-Lama has been suspended pending the outcome of regulatory and litigation challenges. PAGE 7 EMBEDDED GROWTH, FULLY INVESTED: DEVELOPMENT CORNERSTONE PROPERTIES 1. This is a metal stream whereby the purchase price for gold ounces delivered is $435 per ounce, or the prevailing market price of gold, if lower; no inflation adjustment. Per Thompson Creek’s National Instrument 43-101 technical report filed on SEDAR, under Thompson Creek’s profile, on October 13, 2011. 2. Reserves as of October 23, 2009. 3. Estimated production of 262,000 ounces of gold annually during the first six years; 195,000 ounces of gold thereafter, per Thompson Creek’s National Instrument 43- 101 technical report filed on SEDAR, under Thompson Creek’s profile, on October 13, 2011. 4 NSR sliding-scale schedule (price of gold per ounce – royalty rate): less than or equal to $325 – 0.78%; $400 – 1.57%; $500 – 2.72%; $600 – 3.56%; $700 – 4.39%; greater than or equal to $800 – 5.23%. The royalty is interpolated between upper and lower endpoints. 5. Approximately 20% of the royalty is limited to the first 14.0M ounces of gold produced from the project. Also, 24% of the royalty can be extended beyond 14.0 million ounces produced for $4.4 million. In addition, a one-time payment totaling $8.4 million will be made if gold prices exceed $600 per ounce for any six-month period within the first 36 months of commercial production. 6. Reserves as of December 31, 2011. Royalty applies to all gold production from an area of interest in Chile. Only that portion of reserves pertaining to our royalty interest in Chile is reflected here. 7. Barrick has announced that development at Pascua-Lama has been suspended pending the outcome of regulatory and litigation challenges. 8. Based on Barrick’s guidance of 800,000-850,000oz of gold production during the first five years. PAGE 13 FINANCIALLY ROBUST: PRODUCING CORNERSTONE PROPERTIES 1. 75% of payable gold until 910,000 payable ounces; 50% thereafter. As of June 30, 2013, there have been approximately 167,000 cumulative payable ounces produced. 2. Reserves as of December 31, 2012, as reported by the operator. 3. Recovered metal is contained in concentrate and is subject to third party treatment charges and recovery losses. 4. Reserves also include 5.8 billion pounds of lead and 13.9 billion pounds of zinc. 5. Goldcorp’s CY2013 estimated production also includes 20 million to 21 million ounces of silver, 145 million to 160 million pounds of lead and 285 million to 305 million pounds of zinc. 6. Per BoAML 2008 Vale Inco EIS 7. FY2013 actual production also included 2.7 million pounds of cobalt. PAGE 17 ATTRACTIVE MARKET ENVIRONMENT 1. Source: PWC, “Mine 2013: A Confidence Crisis” Page 28. 2. Source: Ernst and Young, “Mergers, Acquisitions and Capital Raising in Mining and Metals, H1 2013” Page 8. 3. Source: Bank of America Merrill Lynch Index Yields PAGE 18 ATTRACTIVE MARKET ENVIRONMENT 1. Source: Minerals Council of Australia “Life Cycle of a Mine,” Royal Gold Estimates 2. Source: Royal Gold estimates from reserve lives; includes both polymetallic deposits PAGE 19 ATTRACTIVE MARKET ENVIRONMENT 1. Carrying cost per ounce was calculated by dividing the amount of Royal Gold’s Peñasquito mineral interests by the number of GEO’s attributable to Royal Gold’s royalty interest at the property at $1,523 per gold ounce. PAGE 21 FAVORABLY POSITIONED 1. Source: Ycharts. 2. Book value is the Company’s tangible assets less its total liabilities and shareholders’ equity. Many of the matters in these endnotes and the accompanying slides constitute forward looking statements and are subject to numerous risks, which could cause actual results to differ. See complete Cautionary Statement on page 2. 23
  • 24.
    1660 Wynkoop Street Denver,CO 80202-1132 303.573.1660 info@royalgold.com www.royalgold.com