This presentation by Tony Jensen, President and CEO of Royal Gold, Inc. discusses the company's business strategy and outlook. Some key points:
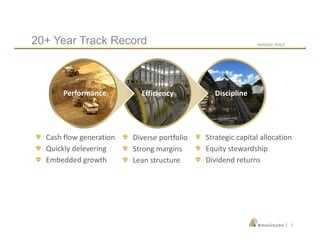
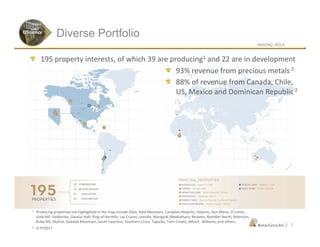
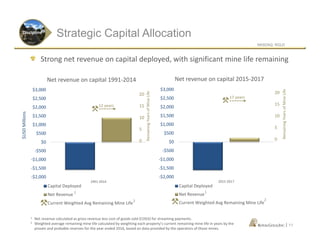
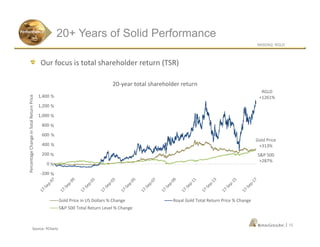
- Royal Gold has a 20+ year track record of generating solid cash flow from its diverse portfolio of streaming and royalty agreements. It aims to maintain this performance through embedded growth from new projects.
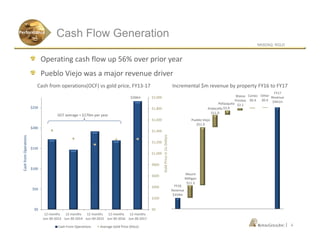
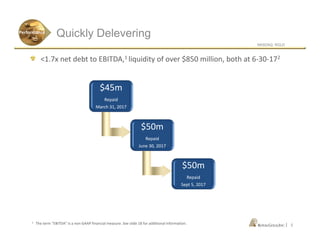
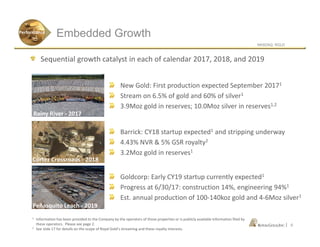
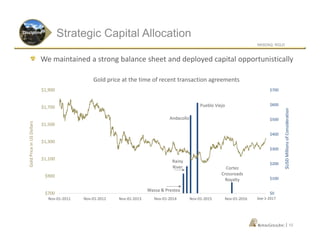
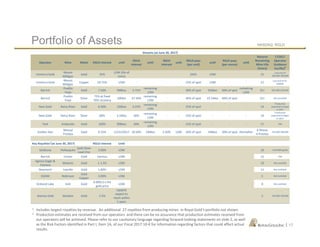
- The company is quickly deleveraging its balance sheet and sees growth catalysts from new projects coming online in 2017, 2018 and 2019, including Rainy River, Cortez Crossroads, and Peñasquito Pyrite Leach.
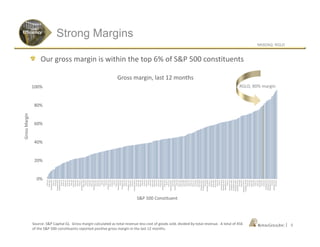
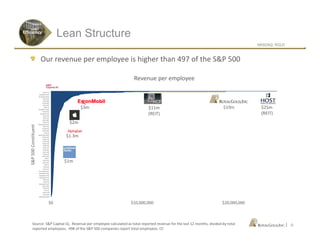
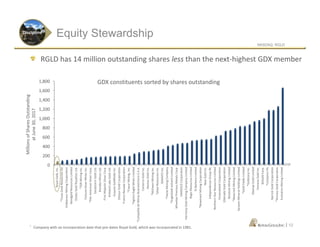
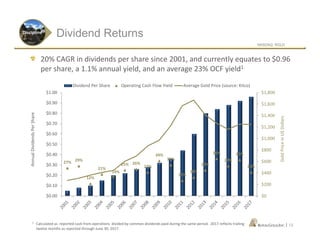
- Royal Gold focuses on strong margins, a lean cost structure, strategic capital allocation, equity stewardship and returning dividends to shareholders