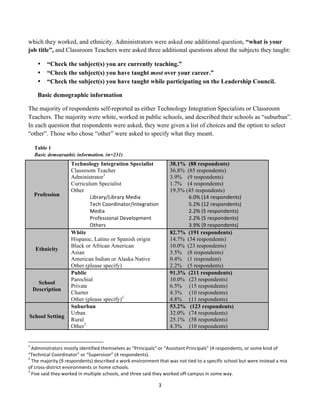
An	
  Evaluation	
  of	
  The	
  Discovery	
  Educator	
  Network   	


                                                By	


                                Joshua	
  D.	
  Briggs,	
  Ed.M.	
  
                                Ilona	
  E.	
  Holland,	
  Ed.D.	


                                       June	
  10,	
  2011	


Table of Contents


         I.   Executive Summary ii

        II.   Methods             1
                 • Introduction   1
                 • Methodology    1
                 • Limitations    2

       III.   Results 2
                 • Demographics and Background Information 2
                 • Participation in DEN 8
                         o Social Media 8
                         o The Weekly Update 14
                         o Webinars 17
                         o The Educators Resource Library 19
                 • Professional Development 21
                 • Use of Technology 31

   IV.        Discussion and Recommendations 38

       V.     Appendices 43
                 • Appendix A – Complete social media rankings 43


                                                     i	


Executive Summary
Overview

This report presents the results of an online survey conducted in March, 2011 of members of the
Discovery Educator Network Leadership Council. The survey was conducted to determine what
resources, services, and products members used, how they used them, how DEN had affected their
professional development, and how DEN had affected their use of technology in their work. Two-
hundred and thirty one (231) members of the Leadership Council complete the survey partially, and two-
hundred and ten (210) completed the survey in full. It consisted of 33 to 42 closed and open response
questions.

Major Findings

Respondents reported being extremely involved in DEN, utilizing all that DEN had to offer.
Respondents were very active users of social media in their daily lives, and many respondents frequently
used social media to interact with DEN, with two-thirds using it to interact with DEN at least once a
month and over half using it to interact with DEN at least once a week. Members found social media
useful for connecting with like-minded colleagues and sharing resources.

Of all the resources DEN offers, the Weekly Update was the most popular. Three-fourths of respondents
read the Weekly Update as frequently as was possible, weekly, and only one respondent never read the
Weekly Update. Respondents found it useful for getting information about the community and new
resources and events that DEN was offering. When asked how it could be improved, respondents wanted
the Update to include “quick tips” with resources, lessons, and tools that could be implemented
immediately as well as an easily accessible archive of past Updates.

Webinars and the Educator Resource Library were also popular with both showing high levels of
participation and high ratings of usefulness. Despite this finding, there was room for improvement.
Two webinars did not have as high attendance as the others. Thought Leadership and Student Centered,
showed the lower levels of attendance with approximately one-fifth of respondents saying they had
never attended that type of webinar. In addition, over one-third of leaders said that over the course of a
year’s time they had uploaded “no” resources to the Educator’s Resource Library. .

Respondents reported that DEN had a major positive impact on their professional growth, with nine out
of ten respondents (89.2%) saying that DEN had impacted their professional growth either
“tremendously” or “very much” When asked what was most important to professional growth in their
field, respondents mentioned building a network of colleagues, having access to great resources, getting
new ideas about how to integrate technology, and being able to keep up with current trends.
Respondents then went on to say that DEN had helped them in every one of these areas.

Respondents reported that DEN had also an extremely beneficial impact on how they used technology in
their work. Nearly all respondents (96.7%) reported that their use of technology had improved and

                                                    ii	


increased in some way as a result of their involvement with DEN. Respondents stated that DEN had
helped them in numerous ways, including learning to effectively use specific products and services,
learning to use technology to enrich and enhance their curriculum, and improving their instructional
practice and helping them develop curriculum that was engaging and exciting for their students.

Almost all respondents reported facing challenges when integrating technology into their work, and over
half (59.5%) reported that DEN had been able to help them with those challenges. The most common
challenge faced by members was getting “buy in” from others in their districts. These respondents had a
hard time getting other teachers, administrators, and peers to accept the benefits of using technology.
Other major challenges were connecting technology to the current curriculum in rich ways (particularly
using technology to teach STEM and other core subjects), dealing with access issues, and finding
funding.

On the whole, respondents were overwhelmingly positive about DEN, the services it provided, and the
ways in which it had helped them grow as professionals.


                                                   iii	


Method
Introduction

The Discovery Educator Network (DEN) is a worldwide community of teachers, administrators,
technology specialists, curriculum specialists, and other educators that is run by Discovery Education.
Over one million members use DEN to collaborate, share resources, work with digital media, and
network. DEN has a various levels of involvement. The most involved group, the Leadership Council
(LC), is a volunteer group of 345 DEN members who help coordinate DEN activities across the country.
The LC plays a critical role in supporting the state-level DEN communities through consistent and
varied communications as well as organization and support of local activities and events.

This study was conducted to gauge how DEN members use the network, and to determine what opinions
and ideas members have about DEN and its services. Specifically, this study wanted to answer four key
questions:

       •   What resources, services, and products to DEN members use?
       •   How do they use those resources, services, and products?
       •   How has DEN affected their professional growth?
       •   How has DEN affected how they use technology in their work?

Methodology

           Recruitment and administrative procedures.

All members of the Discovery Educator Network Leadership Council (DEN L.C.) were invited via email
to participate in an online survey. Two hundred forty-eight LC members initially responded to the
invitation to take the survey, which was administered through SurveyMonkey.com

Participants were able to access the survey beginning on March 7th, 2011, and were given two weeks to
complete it. The survey deadline was then extended five more days in an effort to allow more responses.
The survey closed on March 25th, 2011. Two hundred and thirty one respondents completed the survey
at least partially, and two hundred and ten respondents (84.7% of those who initially signed up)
completed it in full

           Survey structure.

The survey asked between 33 and 42 questions (depending on how respondents answered) and consisted
of five sections:

       •   Twelve to fifteen questions about respondents’ background, work experience, and demographics.
       •   Eleven to fourteen questions about how respondents used, and what participants thought of,
           various resources that DEN offers. The resources discussed were:
               o DEN and social media

                                                     1	


o The Weekly Update
              o Webinars
              o The Educator Resource Library
       •   Five to six questions about respondents’ professional growth in relation to DEN.
       •   Four questions about respondents’ use of technology in their work.
       •   One final question asking for any additional comments.

Approximately three quarters of the questioned asked were forced-choice questions, and approximately
one quarter of the questions asked were open-response questions. Frequently, respondents were allowed
to select more than one answer to a question. For this reason, percentages present in this report will often
add up to more than 100%. In those cases, the number of respondents (n=x) is noted with a *.

The first question of the survey asked a respondent to “check the title that best describes your current
job” and was given the choices:

       •   Classroom Teacher
       •   Technology Integration Specialist
       •   Curriculum Specialist
       •   Administrator
       •   Other

The answer to that first question affected the language, and a few of the questions, in the rest of the
survey. The language of the survey was slightly tailored to fit the profession selected by the respondent.
And two answers (Classroom Teacher and Administrator) prompted between one and three follow-up
questions. All questions in the survey had to be at least partially answered to continue, with the
exception of one question about ethnicity.

           Limitations

It is important to note that the breakdown of the sample by the five professional groups listed above was
very skewed. Approximately one-third of respondents self-identified as “classroom teachers” and one-
third self-identified as “technology integration specialists”. The remaining one-third of respondents split
very unevenly across the final three professional choices. Although in analysis, researchers did consider
how results broke down among the five groups of professions listed above, it is very difficult to draw
conclusions about specific subgroups in relation to the information in this survey.

                                                   Results
Demographics and Background Information

The first third of the survey was dedicated to questions about respondents backgrounds. All respondents
were asked twelve questions about profession, work history, the nature and location of the schools in


                                                       2	


which they worked, and ethnicity. Administrators were asked one additional question, “what is your
job title”, and Classroom Teachers were asked three additional questions about the subjects they taught:

                             •                             “Check the subject(s) you are currently teaching.”
                             •                             “Check the subject(s) you have taught most over your career.”
                             •                             “Check the subject(s) you have taught while participating on the Leadership Council.

                             Basic demographic information

The majority of respondents self-reported as either Technology Integration Specialists or Classroom
Teachers. The majority were white, worked in public schools, and described their schools as “suburban”.
In each question that respondents were asked, they were given a list of choices and the option to select
“other”. Those who chose “other” were asked to specify what they meant.

                   Table 1
                   Basic demographic information. (n=231)
                                                                                                                                      Technology Integration Specialist                                                                                     38.1% (88 respondents)
                                                                                                                                      Classroom Teacher                                                                                                     36.8% (85 respondents)
                                                                                                                                      Administrator1                                                                                                        3.9% (9 respondents)
                                                                                                                                      Curriculum Specialist                                                                                                 1.7% (4 respondents)
                                                                                                                                      Other                                                                                                                 19.5% (45 respondents)
                  Profession                                                                                                                  Library/Library	
  Media	
                                                                                           6.0%	
  (14	
  respondents)	
  
                                                                                                                                      	
      Tech	
  Coordinator/Integration	
                                                                             	
     5.2%	
  (12	
  respondents)	
  
                                                                                                                                      	
      Media	
                                                                                                       	
     2.2%	
  (5	
  respondents)	
  
                                                                                                                                      	
      Professional	
  Development	
                                                                                 	
     2.2%	
  (5	
  respondents)	
  
                                                                                                                                      	
      Others	
                                                                                                      	
     3.9%	
  (9	
  respondents)	
  
                                                                                                                                      White                                                                                                                 82.7% (191 respondents)
                                                                                                                                      Hispanic, Latino or Spanish origin                                                                                    14.7% (34 respondents)
                                                                                                                                      Black or African American                                                                                             10.0% (23 respondents)
                      Ethnicity
                                                                                                                                      Asian                                                                                                                 3.5% (8 respondents)
                                                                                                                                      American Indian or Alaska Native                                                                                      0.4% (1 respondent)
                                                                                                                                      Other (please specify)                                                                                                2.2% (5 respondents)
                                                                                                                                      Public                                                                                                                91.3% (211 respondents)
                                                                                                                                      Parochial                                                                                                             10.0% (23 respondents)
               School
                                                                                                                                      Private                                                                                                               6.5% (15 respondents)
             Description
                                                                                                                                      Charter                                                                                                               4.3% (10 respondents)
                                                                                                                                      Other (please specify)2                                                                                               4.8% (11 respondents)
                                                                                                                                      Suburban                                                                                                              53.2% (123 respondents)
                                                                                                                                      Urban                                                                                                                 32.0% (74 respondents)
   School Setting
                                                                                                                                      Rural                                                                                                                 25.1% (58 respondents)
                                                                                                                                      Other3                                                                                                                4.3% (10 respondents)


1
  	
  Administrators	
  mostly	
  identified	
  themselves	
  as	
  “Principals”	
  or	
  “Assistant	
  Principals”	
  (4	
  respondents,	
  or	
  some	
  kind	
  of	
  	
  
“Technical	
  Coordinator”	
  or	
  “Supervisor”	
  (4	
  respondents).	
  
2
  	
  The	
  majority	
  (9	
  respondents)	
  described	
  a	
  work	
  environment	
  that	
  was	
  not	
  tied	
  to	
  a	
  specific	
  school	
  but	
  were	
  instead	
  a	
  mix	
  
of	
  cross-­‐district	
  environments	
  or	
  home	
  schools.	
  
3
  	
  Five	
  said	
  they	
  worked	
  in	
  multiple	
  schools,	
  and	
  three	
  said	
  they	
  worked	
  off-­‐campus	
  in	
  some	
  way.	
  

                                                                                                                                                                                                                                                    3	


The respondents to this survey work across 35 different states. The states with the most respondents
were California (10.8%), Texas (8/7%), Pennsylvania (7.4%), Florida (6.5%), Maryland (4.8%),
Virginia (4.8%), and Kansas (4.3%).


           Professional experience

In general, the respondents were a very experienced group. One-fourth had worked in their current
primary professional roles for over 15 years. Figure 1 shows how long respondents had been working in
their fields, and Figure 2 breaks that same information down by profession.


               80	
  
               60	
  
               40	
  
               20	
  
                 0	
  
                         Less	
  than	
     One	
  to	
                                  Seven	
  to	
        Ten	
  to	
         Thirteen	
  to	
       Over	
  
                                                               Four	
  to	
  six	
  
                            one	
           three	
                                        nine	
             twelve	
              fiYeen	
             fiYeen	
  
       Number	
               11	
             24	
                    48	
                  29	
                33	
                   28	
              58	
  
       Percentage	
         4.8%	
          10.4%	
                20.8%	
                12.6%	
             14.3%	
                12.2%	
            25.1%	


Figure 1: How long have you been a Teacher/Tech Integration Specialist, etc. (n=231)

Overall, respondents were very experienced, with the largest percentage, 25.1% working for over fifteen
years and the smallest percentage, 4.8% working for less than one year. Classroom Teachers (n=85)
were particularly experienced, with almost half (47.1%) working for over fifteen years.


                                   50.0%	
  
                                   45.0%	
  
                                   40.0%	
  
                                   35.0%	
  
                                   30.0%	
  
                                   25.0%	
  
                                   20.0%	
  
                                   15.0%	
  
                                   10.0%	
  
                                    5.0%	
  
                                    0.0%	
  
                                                        Less	
  than	
                                                                Seven	
  to	
          Ten	
  to	
     Thirteen	
  to	
  
                                                                                One	
  to	
  three	
   Four	
  to	
  six	
                                                                      Over	
  fiYeen	
  
                                                           one	
                                                                        nine	
               twelve	
          fiYeen	
  
         Classroom	
  Teachers	
                            0.0%	
                     0.0%	
                12.9%	
                    14.1%	
              12.9%	
            12.9%	
            47.1%	
  
         Tech	
  Integra[on	
  Specialists	
                3.4%	
                     18.2%	
               28.4%	
                    15.9%	
              15.9%	
            12.5%	
             5.7%	
  
         Curriculum	
  Specialists	
                      25.0%	
                      25.0%	
               25.0%	
                    25.0%	
               0.0%	
             0.0%	
             0.0%	
  
         Administrators	
                                 33.3%	
                      44.4%	
               11.1%	
                     0.0%	
              11.1%	
             0.0%	
             0.0%	
  
         Other	
                                            8.9%	
                     6.7%	
                22.2%	
                     4.4%	
              15.6%	
            13.3%	
            28.9%	
  

Figure 2: How long have you been a Teacher/ Tech Integration Specialist/etc. by profession. (n=231)


                                                                                                                          4	


Years working with DEN

In addition to speaking about overall work experience, respondents also answered questions about their
years in DEN. Experience with DEN ranged from one and six years, with most (70%) of the respondents
having participated for six years. Figure 3 reflects how long all respondents had been in DEN, and figure
4 shows how long they had been on the Leadership Council.

          40.00%	
                                                                                                                      30.0%	
                               61	
  
                                                                                                      70	
  
          30.00%	
                                                                          56	
                                                                    42	
                 41	
  
                                                                      40	
                                                              20.0%	
        35	
  
                                                                                 36	
                                                                                                               27	
       25	
  
          20.00%	
                                    22	
  
                                             6	
                                                                                        10.0%	
  
          10.00%	
         1	
  
            0.00%	
                                                                                                                      0.0%	
  
                        <	
  One	
   One	
           Two	
   Three	
   Four	
              Five	
     Six	
                                         <	
  One	
     One	
     Two	
     Three	
     Four	
     Five	
  
           Percent	
   0.43%	
   2.60%	
   9.52%	
  17.32%	
  
                                                          15.58%	
  
                                                                24.24%	
  
                                                                      30.30%	
                                                          Percent	
   15.2%	
   18.2%	
   26.4%	
   17.7%	
   11.7%	
   10.8%	
  

        Figure3: Years in DEN (n=231)                                                                                          Figure 4: Years on Leadership Council. (n=231)

Technology Integration Specialists (n=88) were the group that, on average, have been participating in
DEN the longest, with 79.5% of this group part of DEN for four or more years, and 42% having been a
part of DEN for all six years of its existence. Only 20% of Classroom Teachers and 26.7% of Others
said that they had been in DEN for six years.

                 Grade levels worked with

Respondents also answered questions about the grade levels that they have worked with, both over the
course of their careers, and while participating on the Leadership Council. They were given 4 specific
grade ranges to choose from, plus the choice to select “other”. Respondents were allowed to pick
multiple grade ranges. The majority of respondents worked with elementary school children.


          80.0%	
                                                                                                                                                  91.8% of Classroom Teachers
          60.0%	
  
                                                                                                                                                                   selected only one of the grade ranges
          40.0%	
  
                                                                                                                                                                   presented in the question. The other
          20.0%	
  
           0.0%	
  
                                                                                                                                                                   professions frequently selected
                                                                                  Pre-­‐k	
  to	
                               Other	
  (please	
                 multiple grade ranges.
                         1st	
  -­‐	
  5th	
         6th	
  -­‐	
  8th	
                              9th	
  -­‐	
  12th	
  
                                                                               kindergarten	
                                     specify)	
  
          Series1	
        61.5%	
                     45.9%	
                     40.3%	
                32.0%	
                       16.5%	
  

       Figure 5: Grade level respondents are currently working with. (n=231*)	


Of the 38 people who answered “Other”, the majority (42.1%) said that they taught teachers or staff in
some way, through in-service training, professional development, or recertification. An additional 26.3%
explained that they worked in some form of Higher Education.


                                                                                                                                5	


Respondents also answered questions about which grade levels they worked with while part of the
Leadership Council and which grade levels they worked with most over the course of their careers. Both
questions yielded results very similar to those shown in Figure 5.

        80.0%	
                                                                                                                         70.0%	
  
                                                                                                                                        60.0%	
  
        60.0%	
                                                                                                                         50.0%	
  
        40.0%	
                                                                                                                         40.0%	
  
                                                                                                                                        30.0%	
  
        20.0%	
                                                                                                                         20.0%	
  
                                                                                                                                        10.0%	
  
         0.0%	
                                                                                                                          0.0%	
  
                                                                     Pre-­‐k	
  to	
                       Other	
                                                                                                           Pre-­‐k	
  to	
      Other	
  
                      1st	
  -­‐	
  5th	
     6th	
  -­‐	
  8th	
   kindergart 9th	
  -­‐	
  12th	
       (please	
                                    1st	
  -­‐	
  5th	
     6th	
  -­‐	
  8th	
   9th	
  -­‐	
  12th	
   kindergart           (please	
  
                                                                        en	
                              specify)	
                                                                                                            en	
             specify)	
  
                        64.1%	
                 47.6%	
              38.1%	
               33.3%	
          13.4%	
                                      61.5%	
                 39.4%	
               22.9%	
                18.2%	
              5.6%	
  

        Figure 6: Which grades have you worked with while                                                                                 Figure 7: Which grades have you worked with most
        participating in the Leadership Council? (n=231*)                                                                                 over the course of your career? (n=231*)

Additionally, respondents were asked how long they had worked with the grade level they had taught the
most, and once again the answer pointed to the high experience level of DEN LC members. Over one-
quarter of respondents (28.6%) had worked with a particular grade level for over fifteen years.

                                                                                                                                                                                 When looking at this question by
                                                                                                                                                    66	
  
       30.0%	
                                                                                                                                                                   profession, Classroom Teachers
       25.0%	
                                                                                                                                                                   showed a very similar trend to the
       20.0%	
  
                                                                     43	
                 41	
                                                                                   group as a whole, with 29.4%
                                                                                                           38	
  
                                                                                                                                                                                 working 15 years or more (largest
       15.0%	
  
                                                                                                                               26	
                                              number). Technology Integration
       10.0%	
                                   16	
                                                                                                                            Specialists were a little different,
        5.0%	
                                                                                                                                                                   with only 15.9% answering “Over
                           1	
  
        0.0%	
                                                                                                                                                                   fifteen” only and over one-fourth
                    Less	
  than	
            One	
  to	
                             Seven	
  to	
     Ten	
  to	
      Thirteen	
  to	
        Over	
  
                       one	
  	
              three	
  
                                                              Four	
  to	
  six	
  
                                                                                        nine	
  	
      twelve	
           fiYeen	
              fiYeen	
                          (26.1%) answering “Four to six.”
                       0.4%	
                  6.9%	
             18.6%	
               17.7%	
         16.5%	
             11.3%	
             28.6%	
                          Nineteen percent (19.3%) answered
                                                                                                                                                                                 “Ten to twelve”.
Figure 8: How many years have you worked with the grade level you have
taught the most? (n=231)

                    Subjects taught (Classroom Teachers only)

Finally, all respondents who selected “Classroom Teachers” (n=85) in answer to Question 1 were asked
3 additional questions about which subjects they taught. All three questions yielded similar results. The
subjects taught by the majority of teachers in almost equal distribution were Science, English/Language
Arts and Math.


                                                                                                                                  6	


80.0%	
  
             60.0%	
  
             40.0%	
  
             20.0%	
  
              0.0%	
  
                                                 English,	
                             Social	
  
                                                                                                                                                                             Other	
  
                                                Language	
                             Studies,	
      Computer	
      Music,	
  the	
      Special	
      Physical	
  
                               Science	
                            Math	
                                                                                                  (please	
  
                                                  Arts,	
                              History,	
       Science	
        Arts	
            Educa[on	
     Educa[on	
  
                                                                                                                                                                            specify)	
  
                                                 Reading	
                              Civics	
  
             Series1	
          68.2%	
           60.0%	
           55.3%	
             49.4%	
           29.4%	
          10.6%	
           10.6%	
         7.1%	
          12.9%	
  

Figure 9: Check the subjects that you are currently teaching? (n=85*)


       80.0%	
  
       60.0%	
  
       40.0%	
  
       20.0%	
  
        0.0%	
  
                                           English,	
                               Social	
  
                                                                                                       Computer	
     Music,	
  the	
       Special	
      Physical	
   Other	
  (please	
  
                         Science	
        Language	
            Math	
             Studies,	
  
                                                                                                        Science	
       Arts	
             Educa[on	
     Educa[on	
      specify)	
  
                                        Arts,	
  Reading	
                      History,	
  Civics	
  
                         65.9%	
             67.1%	
            64.7%	
             49.4%	
            24.7%	
           10.6%	
             11.8%	
         8.2%	
            7.1%	


Figure 10: Check the subjects you have taught most over your career. (n=85*)


       80.0%	
  
       60.0%	
  
       40.0%	
  
       20.0%	
  
        0.0%	
  
                                           English,	
                               Social	
  
                                                                                                       Computer	
     Music,	
  the	
       Special	
      Physical	
   Other	
  (please	
  
                         Science	
        Language	
            Math	
             Studies,	
  
                                                                                                        Science	
       Arts	
             Educa[on	
     Educa[on	
      specify)	
  
                                        Arts,	
  Reading	
                      History,	
  Civics	
  
                         67.1%	
             63.5%	
            57.6%	
             49.4%	
            30.6%	
            9.4%	
             12.9%	
         8.2%	
           14.1%	
  

Figure 11: Check the subject(s) you have taught while participating on the
Leadership Council. (n=85*)

About half as many participants answered “other” to the question “Check the subjects that you have
taught most over the course of your career” than did to the two questions that asked about more recent
teaching. Almost all “other” descriptions involved some kind of technology, including desktop
publishing, digital citizenship, industrial engineering, and technology and engineering.


                   Summary of demographics and background info.

The DEN Leadership Council members who participated in this survey generally came from a
diversified set of professions, states, school types, and worked with a wide range of grade levels. They
had a wide range of experience, from less than one year to over fifteen years working in the field. They
worked in numerous subject areas, which included Science, Math, English, Social Studies, Computer
Science, Music and the Arts, Physical Education, and others.


                                                                                                            7	


Although the Leadership Council members were diverse, they shared certain specific demographic
characteristics. The majority of the respondents were either Classroom Teachers or Technology
Integration Specialists, and a smaller, but significant number, worked in the library, with library media,
or other forms of technology coordination and integration. Respondents to this survey were mostly
White and worked in suburban public school settings.

Respondents generally had a wealth of work experience, with over half working in their field for ten
years or more. A large majority of respondents worked with students in grades 1-8, with almost two-
thirds of respondents saying they worked with students in grades 1-5. The Classroom Teachers who
completed this survey generally taught the core subjects (Science, Math, English, Social Studies) and
Computer Science. Finally, most of the respondents were very involved in the DEN community. Most
had been in DEN for the entire 6 years of its existence, and two-thirds had been serving on the
Leadership Council for two years or more.


Participation in DEN

Respondents answered between 11 and 14 questions about how they used the different resources,
services, and products offered by DEN. Approximately half of the questions addressed respondents’ use
of social media, both in general, and to interact with DEN. Three questions addressed the Weekly
Update, two questions addressed respondents’ use of DEN webinars, and three questions addressed
respondents’ use of the Educator Resource Library. Two of the questions asked in this section were
open-response questions, and the rest were forced-choice questions.

        Use of social media

Respondents were asked between four and six questions about social media (depending on how they
answered.) The first question was about general social media usage: “How often do you use social
media such as Facebook or LinkedIn in your daily life?” They were given six answer options. (see
figure 12)

                                                                                             The majority of DEN members
                                                                                             (71.2%) answered that they used
                                               Two	
  or	
  three	
                          social media on a daily basis.
                                                 [mes	
  a	
  
                                Weekly,	
                                                    These overall numbers were fairly
                                19.2%	
        month,	
  4.4%	
  

                                                Once	
  a	
                                  consistent across professions.
          Daily,	
  71.2%	
                   month,	
  0.9%	
                               Classroom Teachers (n=85) were
                                                                                             among the most active users with
                                                                         Less	
  than	
  
                                              Never,	
  2.6%	
            once	
  a	
        76.5% saying they used social
                                                                        month,	
  1.7%	
  
                                                                                             media “daily”.	
  

Figure 12: Use of social media in general. (n=229)

Figure 12: Use of social media in general. (n=229)
                                                                                     8	


The least active users of social media in general were Curriculum Specialists (n=4). One Curriculum
Specialist answered “never” and another answered, “two or three times a month”. The other two
Curriculum Specialists did say that they used social media “daily.” Although the very small sample size
makes it difficult to claim that less use of social media is a trend among Curriculum Specialists, it is still
notable because so few respondents in general answered either “never” or “two or three times a month.”

Next, the respondents who did use social media were asked: “Which form of social media do you use
most often?” They were given a list of six choices to select from. (see figure 13)

                                                                                                                                         Of the 11 respondents who gave
                                                                        LinkedIn,	
                                                      an “Other” answer, 5 respondents
                                                                          0.4%	
  
                                                                                          Edmodo,	
  2.7%	
  
                                                                                                                                         (45.5%) said they used “Plurk”
                                                                                  Other	
  (please	
  
                                                                                                                                         most often. This rate of response
                        Facebook,	
                                               specify),	
  4.9%	
                                    is comparable to Edmodo.
                          64.1%	
  

                                                              Twicer,	
  
                                                                                                                                         LinkedIn, on the other hand, was
                                                               21.5%	
                                                                   only used by one respondent.
                                               Blogs,	
  
                                               11.2%	


Figure 13: Most used forms of social media. (n=223*)


                                       80.0%	
                                                                                                    Figure 14 shows the most
                                       70.0%	
                                                                                                    popular forms of social
                                       60.0%	
                                                                                                    media by daily users
                                       50.0%	
  
                                                                                                                                                  (n=163), weekly users
                                       40.0%	
  
                                                                                                                                                  (n=44), and less frequent
                                       30.0%	
  
                                                                                                                                                  users (n=16).
                                       20.0%	
  
                                       10.0%	
  
                                                                                                                                                  Those social media users
                                           0.0%	
                                                                                                 who use less frequently
                                                      Facebook	
   Twicer	
                 Blogs	
       Edmodo	
     Plurk	
     LinkedIn	
  
                                                                                                                                                  are more prone to use
             Daily	
  users	
  n=165	
                      69.7%	
         22.4%	
         4.2%	
          2.4%	
     1.2%	
        0.0%	
  
             Weekly	
  users	
  n=46	
                      50.0%	
         19.6%	
        21.7%	
          2.2%	
     4.3%	
        2.2%	
  
                                                                                                                                                  blogs than they are other
             Less	
  frequent	
  users	
  n=17	
            29.4%	
         11.8%	
        47.1%	
          5.9%	
     5.9%	
        0.0%	
       forms of social media.	
  

       Figure 14: Most popular forms of social media, by frequency of
       general social media usage. (n=223)


All respondents were then asked: “How often do you interact with DEN through social media such
as Facebook or LinkedIn?” They were given six answer options to choose from. (see figure 15)


                                                                                                           9	


Two	
  or	
  three	
  
                                     Weekly,	
  
                                     27.1%	
  
                                                                   [mes	
  a	
                     Almost 70% of respondents use social
                                                                 month,	
  10.9%	
  
                                                                                                   media to interact with DEN at least
                    Daily,	
  22.7%	
  
                                                                                                   once a month and almost 50% use
                                                                   Once	
  a	
                     social media to interact with DEN at
                                                                 month,	
  9.2%	
  
                                   Never,	
                                                        least once a week.
                                   14.0%	
  
                                                          Less	
  than	
  
                                                           once	
  a	
  
                                                         month,	
  16.2%	
  

Figure 15: Frequency of use of social media to interact with DEN.
(n=229)

The most popular answer was “weekly” with over one quarter of respondents giving that response. By
profession, Technology Integration Specialists (n=86) were slightly more likely to interact with DEN via
social media. 29.1% of Technology Integration Specialists said they interacted with DEN via social
media “daily”. (Compared to 17.6% of Classroom Teachers (n=85), 22.2% of Administrators (n=9),
22.2% of Others (n=45), and 0% of Curriculum Specialists (n=4))

Next, respondents who said they did use social media to interact with DEN (n=197) were then asked,
“which form of social media do you use most to interact with DEN?” They were given six answer
options. (see figure 16)


                                 Facebook,	
                                                       Blogs were the most popular answer for
                                   32.0%	
                   LinkedIn,	
  0.0%	
  
                                                             Edmodo,	
  2.0%	
  
                                                                                                   social media to interact with DEN, with
                                                              Other,	
  8.6%	
  
                                                                                                   39.1% of respondents using blogs the
           Blogs,	
  39.1%	
  
                                                                                                   most. By comparison, only 11.2% of
                                      Twicer,	
  24.4%	
                                           general social media users said they use
                                                                                                   blogs the most.


Figure 16: Social media to interact with DEN. N=197*

Although over two-thirds of general social media users said that Facebook was the form of social media
they used the most, only one-third of respondents who use social media to interact with DEN use
Facebook the most.

17 respondents answered “other” to this question:

       •   Email: 5 respondents (29.4%)

                                                                                          10	


•                             Google Groups: 5 respondents (29.4%)
                             •                             Plurk: 4 respondents (23.5%)
                             •                             Wikis: 2 (11.8%)
                             •                             Skype, Google Docs, and Facebook: 1 respondent each (5.9%) (The total is more than 100%
                                                           because a few respondents mentioned more than one of the above.)

Next, respondents were also asked to “Please score each of the following in terms of its usefulness to
you in participating in DEN”. They were given a list of five forms of social media. For each form of
social media, they were given the option to give a score between one (not at all useful) and five (very
useful.)4

       Table 2
       Ratings of how useful social media is in terms of interacting with DEN.
       Social media used to                                                                                                                                                                 Useful                                                  Neutral   Not useful    Average rating
        interact with DEN.
           Blogs (n=225)                                                                                                                                                                     88.0%                                                   9.3%       2.7%             4.38
                Facebook (n=224)                                                                                                                                                             62.0%                                                  28.6%       9.4%             3.78
                        Twitter (n=224)                                                                                                                                                      60.3%                                                  27.2%       12.5%            3.71
                    Edmodo (n=221)                                                                                                                                                           40.7%                                                  39.4%       19.9%            3.21
                  LinkedIn (n=217)                                                                                                                                                           17.5%                                                  51.6%       30.9%            2.68


When it came to participating in DEN, respondents’ order of preference was blogs, Facebook, and then
Twitter. All three were rated useful by more than 60% of respondents.

LinkedIn was the only form of social media that respondents did not find useful. At best, most
respondents were neutral about LinkedIn.

Finally, all respondents were asked to give an open response to the question “Please explain why you
do or do not interact with DEN through Social Media.”

Of the 226 respondents who answered this question, the majority (65.0%) gave an answer to explain
why they did use social media to interact with DEN, and approximately one-third (34%) gave an answer
to explain why they did not use social media to interact with DEN. Two respondents (0.9%) gave an
answer that was a mix of reasons for using and reasons for not using.

                                                           Reasons for using social media to interact with DEN

A total of 147 participants provided reasons for using social media to interact with DEN. Reasons were
evenly distributed among four main categories5. The participants stated that social media provides:

                             •                             A convenient and easy tool


4
       	
  The	
  full	
  breakdown	
  of	
  these	
  scores	
  is	
  included	
  in	
  Appendix	
  A.	
  
5
       	
  A	
  main	
  category	
  was	
  one	
  that	
  was	
  mentioned	
  by	
  at	
  least	
  10%	
  of	
  the	
  respondent	
  subgroup.	


                                                                                                                                                                                                                                                                   11	


•   Current up-to-date information
       •   An effective vehicle to initiate and maintain collaborations and interactions with one another
       •   An effective vehicle for resource-sharing

Some respondents mentioned more than one of these categories when describing why they use social
media to interact with DEN.

Over one-fourth (29.3%) of these respondents stated that they use social media to connect with DEN
because it is easy and quick.

       o “Quick and easy. & part of my normal routine”
       o “Once you sign up on Social Media sites and connect with other DEN members, it is so simple.
         Their messages/posts are available any time you are on that social media site.”
       o “It is an easy way to update on ALL the recent activities, current trends and educational
         opportunities. I read DEN blogs from several different states.”


Thirty-eight respondents (25.9%) said that social media is a great way to collaborate, stay connected,
and learn from their colleagues. These responses focused on the professional development that grew out
of these interactions.

       o “The DEN is a huge part of my professional learning network. We share ideas, collaborate on
         projects and support each other in our challenges.”
       o “Social media allows me to bring the DEN network to me. It is an easy way for me to gain
         valuable resources from other like-minded peers in a very timely manner anytime, anywhere.”
       o “Asking questions and answering questions from others helps us become more than the sum of
         our parts.”


Thirty-three respondents (22.4%) said that social media is the best way to “keep up” with what is
happening in DEN.

       o “To check up on what’s happening, get current information”
       o “It is called FOMO - Fear of missing out.”
       o “It also helps me learn about the latest technology components that can enrich my classroom.”


Twenty-five respondents (27.0%) spoke of social media as a way to share resources and ideas.

       o “Social media and web tools allow to me to share resources and learn about resources,
         webinars, and participate in conversations with DEN members or DEN LC members.”
       o “There is never a time that I am on Twitter and don't get more than a handful of ideas, tips and
         tricks or great websites to share.”


                                                       12	


Other reasons for using social media to interact with DEN included the promotion and facilitation of
new friendships, and seeing the human side of colleagues.

           Reasons for not using social media to interact with DEN

Seventy-seven participants provided reasons for NOT using social media to interact with DEN. The
reasons were distributed among four main categories. The participants stated that they:

       •   Didn’t see a need and thought social media was distracting (n=29). A number of these
           respondents considered social media appropriate for personal use, but not professional use.
               o “Interaction on social media is superficial and does not allow for in-depth relationship
                  building and communication.”
       •   Didn’t have time to spend on social media (n=15)
               o “I am too busy planning and preparing for the following day.”
       •   Were not aware of DEN’s presence on social media sites such as Facebook and Twitter (n=13)
               o “Is there a DEN presence on Facebook?”
       •   Had access issues due to district-level firewalls (n=8)
               o “Facebook and LinkedIn are both blocked at school.”

The remaining respondents gave a variety of reasons for not interacting with DEN via social media.
Most gave a specific explanation of why they used one form of social media rather than another. A few
explained that they were just now becoming familiar with social media in general so were “slow
starters”, and two others simply could not explain why they did not use social media to interact with
DEN.

In summary, the respondents to this survey were generally very active social media users, with over two-
thirds saying that, in general, they used social media “daily”. When intending to interact with DEN
specifically, most respondents used social media on a weekly basis. Of all the forms of social media,
Facebook was the most popular form for respondents in their day-to-day life, with approximately two-
thirds saying that Facebook is the form of social media that they use the most. Interestingly, when it
came to interacting with DEN specifically, respondents were more likely to turn to blogs, although
Facebook remained the second most popular option. Almost three-fourths of respondents used either
blogs or Facebook to interact with DEN. The only form of social media that was considered “not useful”
for interacting with DEN was LinkedIn. In addition, numerous respondents wrote in “Plurk” as a form of
social media that they commonly use to interact with DEN. This was not a platform that was considered
when designing the survey. Reasons for using social media to interact with DEN ranged from being
“convenient and easy”, to being “good for getting up-to-date information”, to “a great way to connect
with like-minded educators”, to “an effective way to share resources.” Those respondents who did not
use social media to interact with DEN said they did not do so primarily because they “didn’t see the
need” had “access issues”, or simply “didn’t know” that DEN had an active social media presence.


                                                      13	


The Weekly Update

Respondents were then asked questions about specific features of the DEN website. To begin, all
respondents were asked about the Weekly Update, “How often do you read the Weekly Update?”
They were given six choices (see figure 17).


                                                                                            Most (76.1%) of the respondents
                            A	
  few	
  [mes	
  a	
                                         read the Weekly Update
                            month,	
  18.6%	
                     Once	
  a	
               optimally, every week. Only three
                                                                month,	
  4.0%	
  
                                                                                            of the 226 respondents (1.3%)
                                                        Once	
  every	
  few	
  
                                                        Once	
  a	
  year,	
  
                                                         months,	
  0.4%	
  
                                                           0.0%	
                           reported reading the Update less
       Every	
  week,	
  
          76.1%	
  
                                                                                            than once a month.

                                                                     Never,	
  0.9%	


Figure 17: Frequency with which respondents read the Weekly Update.
(n=226)

The Technology Integration Specialists (n=86) read the Weekly Update the most; 80.2% reported that
they read the Weekly Update every week. All three respondents who read the Weekly Update less than
once a month were Classroom Teachers (n=82). This same group also had the second lowest percentage
to read the Update on a weekly basis; 73.2% reported that they read the Weekly Update every week. The
only profession with a lower rate of weekly readership was Curriculum Specialists (n=4); 50% reported
reading the Update weekly, although this percentage is a little misleading because of the small sample
size. (The other two Curriculum Specialists reported reading the Update a few times a month.)

Those respondents who reported that they did, in fact, read the Weekly Update were then asked to “Put
the following reasons for reading the Weekly Update in the order of their relevance to you, (5
being the most relevant to you, 1 being the least relevant to you).” Two hundred and twenty-two
respondents answered this question. (note: respondents had to rate only one of the choices to move on
in the survey.)


                                                                                   14	


TABLE 3
Ranking of reasons for reading the Weekly Update. (n=222)6


                                                                                                                                                                                                                                                                                      Ranking    Number of
       Reasons for Reading Weekly Update                                                                                                                                                                                                            1             2    3    4    5    Average   Respondents
       Acquiring information about online events                                                                                                                                                                                                    8             26   32   57   59    3.73        182
       Finding information about free resources from
       Discovery Education                                                                                                                                                                                                                          16            32   44   46   58    3.50        196
       Obtaining information about in person events                                                                                                                                                                                                 40            32   44   35   37    2.98        188
       Getting Discovery Education product updates                                                                                                                                                                                                  69            41   33   37   38    2.70        218
       Receiving promotions                                                                                                                                                                                                                         45            50   42   34   16    2.60        187


“Acquiring information about in-person events” had both the highest average ranking (3.73) and was
most consistently chosen as the most important reason for reading the Weekly Update. “Getting
Discovery Education product updates” was the answer rated by the largest number of respondents (218).
It was also ranked by over one-third of those respondents as being the least relevant reason for reading
the Weekly Update. The reason with the lowest average ranking was “receiving promotions” Slightly
more than half (51%) of the 187 people who commented on the promotions ranked the reason as being a
low incentive for reading the update.

All respondents were then asked, “What would make the Weekly Update more useful to you?”

Two hundred-twenty-four (224) people answered this question. Almost two-thirds (63.4%) could offer
no suggestion to make the Weekly Update more useful. Of those, 35 said that they simply could not
think of anything to add. The other 107 respondents made a point of saying that the Update was great as
is:

                             o ”They don't bombard me with too much information. Perhaps they understand we are all
                               professionals and educators with many responsibilities.”
                             o “I use it every week and there is always something that applies to what I do. I think it reaches all
                               audience readers.”
                             o “I like being able to access information in one stop even if I don't have time during the week to
                               look at the blog. I know that all the important issues will be on the update.”


Of the remaining 82 respondents over one-third provided a particular suggestions for improving the
Weekly Update.

Twenty respondents (24.4% of respondents who offered some kind of suggestion) wanted the Update to
include some kind of “quick tip”:


6
 	
  Although	
  222	
  respondents	
  answered	
  this	
  question	
  overall,	
  most	
  individuals	
  only	
  scored	
  some	
  of	
  the	
  reasons	
  for	
  reading	
  
the	
  Weekly	
  Update,	
  thus	
  the	
  lower	
  numbers	
  in	
  the	
  column	
  “Number	
  of	
  Respondents”.	
  That	
  column	
  contains	
  the	
  response	
  
rate	
  for	
  each	
  reason.	


                                                                                                                                                                                                                                                         15	


o “How about adding one specific tip about some aspect of the Discovery resources?”
                             o “Perhaps a link to one short (2-3 min) how-to or I-didn't-know-you-could-do-that-with-
                               Discovery video tutorial.”
                             o “Tech Tip of the week.”


Many of these requests for a “quick tip” suggested including one grounded example, such as a lesson
plan, or video of someone using the tip in a classroom.7

                             Other types of resources that respondents would like to see in the Weekly Update included:
                             • Resources directly related to core classroom content.
                             • A calendar of what is going on in the DEN.
                             • Links specifically to resources that other educators have shared.
                             • New videos.

Seven respondents wanted the Weekly Update to include some sort of information related to local
events.

                             o “If there was a section for specific state news that might be helpful and promote more state,
                               regional, and local events.”

Six respondents thought the Update should include an easily searchable archive:

                             o “A central location where updates are archived and easily searchable would be great.”
                             o “It would be great to be able to access an archive of weekly updates.”

Other suggestions for things to add to the Update included two requests to make it shorter and less
dense, a request for it to come earlier in the week, a request for more opportunities to participate more
actively in the DEN in some way, a request for an audio version, and a request for a reminder to be sent
out that a new Update is posted.

In summary, The Weekly Update was extremely popular. Nearly all respondents (98.7%) read it at least
once a month, and three-fourths of respondents read it as frequently as was possible, weekly. Generally,
respondents liked the Update for information about events and free resources from Discovery, and were
less interested in the promotions and Discovery product information.

When asked for ways to improve the Weekly Update, nearly two-thirds of respondents (63.4%) had no
suggestion, with most explaining that the Update couldn’t be better. The remaining respondents had a
number of suggestions to improve the Weekly Update. Many wanted a quick “tip”, “link”, or “lesson”
included as a regular feature in the Update every week: a grounded, easy-to-use resource that could be
put into action immediately. Other respondents wanted more information about local events and issues.
Multiple respondents wanted the Weekly Update to have an easily accessible online archive of past


7
       	
  A	
  complete	
  list	
  of	
  “quick	
  tips”	
  suggestions	
  is	
  provided	
  in	
  Appendix	
  B.	
  

                                                                                                                                                                                                                                                    16	


postings so that DEN members could quickly search and retrieve useful information for “just-in-time”
professional development.


       Webinars

Next, all respondents were then asked either 1 or 2 questions about DEN webinars. The first question,
asked of all respondents, was “How often do you attend DEN webinars?” They were given five
choices (see figure 18).


                                                                                        A large majority, 90.1%, attended
                                                                   Once	
  a	
          multiple DEN webinars each year, with
                  A	
  few	
  [mes	
  a	
                        year,	
  5.8%	
  
                   year,	
  52.2%	
                                                     52.2% saying they attended “a few times
                                                                   Never,	
  3.6%	
  
                                                                                        a year” and 37.9% saying they attend “at
                                                              At	
  least	
             least monthly”. Only one respondent
                                                            weekly,	
  0.4%	
  
                                          At	
  least	
  
                                                                                        (0.4%) said that she attended DEN
                                          monthly,	
                                    webinars “at least weekly.” 8 never
                                           37.9%	
  
                                                                                        attended at all.


Figure 18: How often respondents attend DEN webinars. (n=224)


The 215 respondents who said they had attended at least some webinars were then asked to “Please
score the following types of DEN webinars in terms of their usefulness to you:” They were provided
a five point rating scale with 5 being “extremely useful” and 1 being “not at all useful.”

In Table 4 we see that all webinars have a positive average rating of a 3.9 or more. Virtual Conferences
had the highest average rating overall (4.58, Virtual Conferences also had the largest number of
respondents (134) who gave it the highest score of 5. The most common score for all types of webinars
was either a 4 or a 5.


                                                                               17	


TABLE 4
Ratings of different types of webinars.                                                                                                                                                                                                                (n=215)8

                                                                                                                                                                          I have                                                                                                                           Rating
                                                                                                                                                                           never                                                                      1-                                                  Average
                                                                                                                                                                                                                                                              2-                                 5-
                                                                                                                                                                         attended                                                                    Not                3-              4-                (does not    Response    Number of
                  Type of webinar                                                                                                                                                                                                                             Not                               Very
                                                                                                                                                                         this type                                                                  useful            Neutral          Useful               count       Count     Respondents
                                                                                                                                                                                                                                                             useful                             useful
                                                                                                                                                                             of                                                                     at all                                                 “never
                                                                                                                                                                         webinar                                                                                                                         attended”)
   Virtual Conferences
                                                                                                                                                                                                13                                                    0           2     12               54       134       4.58         215           202
    (e.g. DEN SciCon)
  Classroom Integration
   (e.g. 50 ways to use
                                                                                                                                                                                                11                                                    0           1     10               79       114       4.50         215           204
  Discovery Education
        Streaming)
    Product Overview
      (e.g. Discovery
                                                                                                                                                                                                15                                                    3           5     24               97       71        4.14         215           200
  Education Streaming
       Walkthrough)
   Thought Leadership
       (e.g. Ed-Tech                                                                                                                                                                            43                                                    2           5     31               74       60        4.08         215           172
          Connect)
  Student Centered (e.g.
  Spotlight on the Gulf
                                                                                                                                                                                                38                                                    4          10     35               75       53        3.92         215           177
       with Philippe
         Cousteau)


Table 5 shows the percentage of non-attendance for each webinar, and Table 6 shows how each type of
webinar was rated, in terms of its general usefulness.

215 respondents answered this question, but they only had to rate one webinar to move on in the survey.

       TABLE 5                                                                                                                                                                                                                                                                        TABLE 6
       Percentage of Non-attendance by Webinar Type                                                                                                                                                                                                                                   Positive vs. Negative Usefulness Ratings by Webinar Type.
                                                                                                                                                                                                                                  I have never attended                                                     Positive      Negative
                                                                        Webinars                                                                                                                                                                                                         Webinars                                      Neutral
                                                                                                                                                                                                                                   this type of webinar                                                     Rating         rating
  Thought Leadership (n=172)                                                                                                                                                                                                                              20.0%                          Classroom
                                                                                                                                                                                                                                                                                                             94.6%         0.5%         4.9%
                                                                                                                                                                                                                                                                                         Integration
            Student Centered (n=177)                                                                                                                                                                                                                      17.7%
                                                                                                                                                                                                                                                                                 Virtual Conferences         93.1%         1.0%         5.9%
               Product Overview (n=200)                                                                                                                                                                                                                   7.0%
                                                                                                                                                                                                                                                                                  Product Overview           84.0%         4.0%        12.0%
        Virtual Conferences (n=202)                                                                                                                                                                                                                       6.0%
                                                                                                                                                                                                                                                                                 Thought Leadership          77.9%         4.1%        18.0%
  Classroom Integration (n=204)                                                                                                                                                                                                                           5.1%
                                                                                                                                                                                                                                                                                      Student Centered       72.3%         7.9%        19.8%


8
 	
  Most	
  respondents	
  scored	
  the	
  usefulness	
  of	
  more	
  than	
  one	
  webinar.	
  	
  	
  A	
  few,	
  however,	
  did	
  not.	
  	
  See	
  the	
  number	
  of	
  
responses	
  for	
  each	
  type	
  of	
  webinar	
  to	
  determine	
  the	
  response	
  rate	
  for	
  each.	


                                                                                                                                                                                                                                                                             18	


Thought Leadership and Student Centered webinars had both high percentages of non-attendance and
negative ratings. (It is important to note, however, that far fewer participants rated these two webinars
overall as well) Conversely, the webinars with the highest attendance and ratings were those on
classroom integration and virtual conferences.


                   Resource Library

Respondents were next asked 3 questions about the Educator Resource Library. First, all respondents
were asked, “Approximately how many resources do you upload to the Educator Resources section
of the website per year?” (shown in figure 19) and “Approximately how may resources do you
download from the Educator Resources section of the website per year?” (shown in figure 20.)

                                46.6%	
  
       50.0%	
                                                                                       50.0%	
                   40.4%	
  
                    36.3%	
  
       40.0%	
                                                                                       40.0%	
  
       30.0%	
                                                                                       30.0%	
                                   23.8%	
  
       20.0%	
                                                                                       20.0%	
                                                                 15.7%	
  
                                                 10.3%	
                                                         10.3%	
                                       9.9%	
  
       10.0%	
                                                                        5.8%	
         10.0%	
  
                                                                     0.9%	
  
        0.0%	
                                                                                        0.0%	
  
                     None	
     1	
  to	
  3	
   4	
  to	
  6	
   7	
  to	
  9	
      10	
  or	
                 None	
   1	
  to	
  3	
   4	
  to	
  6	
   7	
  to	
  9	
   10	
  or	
  
                                                                                      more	
                                                                                 more	
  

       Figure 19: Resource Library, uploads per year                                                 Figure 20: Resource Library, downloads per year
       (n=223)                                                                                       (n=223)

Overall, DEN participants tended to download resources with greater regularity than they uploaded
them. That said, there was little difference in the most frequent tendency with which DEN participants
tended to upload and download resources. They tended to do both once or twice a year. Interestingly,
DEN participants were three times more likely to never have uploaded resources than never have
downloaded them. Over one-third of all respondents (36.3%) never upload resources to the Educator
Resources Library.

All respondents were then asked, “Please score each of the following resources from the Educator
Resources section in terms of its usefulness to you.”

TABLE 7
Usefulness of Resources in the Educator Resource Library. (n=223)

                                                                                     1 Not at        2 Not          3                   4               5 Very            Rating            Response
       Educator Resource Library Resources
                                                                                     all useful      useful       Neutral             Useful            useful            Average            Count
       Archived webinars                                                                    2           4              20                102                95                4.27            223
       Multimedia presentations (e.g Keynote)                                               1           3              32                 96                90                4.22            222
       Project samples                                                                      1           1              49                 92                79                4.11            222
       Lesson plans                                                                         3           12             52                 91                64                3.91            222


                                                                                                       19	


Respondents found the Archived webinars, Multimedia Presentations, and Project Samples to be useful.
Their average ratings fell between “useful” and “very useful”. Lesson Plans received a slightly lower
average rating, between “neutral” and “useful.”

Table 8 shows the overall positive and negative ratings of each type of resource.

        TABLE 8
        Positive vs. negative ratings of Resource Library
        resources.
             Educators Resource Library      Positive                 Negative
                                                        Neutral
        	
           Resources               Rating                    Rating
       Archived webinars (n=223)             88.3%        9.0%             2.7%
       Multimedia presentations (n=222)      83.8%        14.4%            1.8%
       Project samples (n=222)               77.0%        22.1%            0.9%
       Lesson plans (n=222)                  69.8%        23.4%            6.8%


Although it would seem likely that Lesson plans might be rated lower because they might be more
useful to one profession than another, this did not seem to be the case, as can be seen in Table 9


       TABLE 9
       Comparative ratings of Resources, by profession.

                                             Tech
                                                                             Curriculum     Admin-
           Educators Resource             Integration      Teachers                                    Others
                                                                             Specialists   istrators
           Library Resources              Specialists       n=82                                        n=42
                                                                                n=4           n=9
                                             n=86
       Archived webinars                     4.31             4.26                4.25       3.89       4.31
       Multimedia presentations              4.28             4.23                4.25       3.67       4.19
       Project samples                       4.16             4.04                4.25       4.22       4.12
       Lesson plans                          3.97             3.86                4.25       3.78       3.86


Lesson plans were consistently rated with the lowest average ratings across all the professions.
Additionally, Administrators consistently gave lower scores to resources than members of other
professions did (with the exception of Project Samples.) It is difficult to draw clear conclusions from
this due to the small Administrator sample size (n=9). However, Curriculum Specialists did not deviate
from the general trend, and they have an even smaller sample size (n=4). It is worth considering doing
further study to see if the resources offered by DEN are generally less helpful to Administrators than
they are to other professionals.

In summary, the members of the Leadership Council were very active users of DEN webinars and the
DEN Educator’s Resource Library. The vast majority of respondents (90.1%) attended multiple DEN

                                                                  20	


webinars every year. Every type of DEN webinar that was mentioned in the survey received a positive
rating, although two types of webinars, Thought Leadership and Student Centered, received lower than
average ratings and higher than average rates of non-attendance.

Respondents were generally active users of the Educator’s Resource Library, although they were more
likely to download resources than upload them. Over one-third of the Leadership Council respondents
said that they “never” uploaded resources to the Library. All of the resources in the Library were rated
as being “useful”, although Lesson plans were generally considered to be less useful than other
resources.

Summary of participation in DEN.

In looking at the overall results of how respondents from the Leadership Council participated in DEN, it
became clear that these respondents were very active users of all that DEN had to offer: social media
connections, the Weekly Update, webinars, and the Educator Resource Library.

The Weekly Update seemed to be the most popular point of form of interaction, with three-fourths of
respondents reading the Update as frequently as was possible. Only one respondent out of 226 had never
read the Weekly Update. Respondents looked to the Weekly Update and social media as a way to keep
informed on happenings in the DEN community. The participants were very involved with DEN through
social media. Over two-thirds interacted with DEN through some form of social media at least once a
month and over half interacted with DEN via this medium at least once a week. Blogs, Facebook, and
Twitter were the preferred forms of social interaction with DEN. Daily users were more likely to use
Facebook, and weekly users were more likely to use blogs.


Professional Development
The next section of the survey posed between 5 and 6 questions about professional development (PD To
begin, respondents were asked to define their conception of professional development: “The Discovery
Educators Network is trying to ensure that the professional development opportunities it offers
are relevant to the field. To support this effort, please explain what you think is most essential for
the professional growth of a (teacher/technology integration specialist/curriculum
specialist/administrator/other.) (Please include at least two ideas.)”

Some respondents were confused about the nature of the question, thinking that it was asking about
professional development in relation to the DEN, as opposed to the topic in general. Most respondents
listed multiple examples of essential components to professional development, and a number of clear
themes emerged. At least 10% of the respondents discussed the importance of one or more of the
following:

       •   Helping to integrate technology
       •   Providing access to practical resources

                                                     21	


•                             Networking with colleagues
                             •                             Keeping up with current trends

Helping to Integrate Technology

The response mentioned most frequently, by almost one-third of the respondents (32.9%), referenced the
importance of facilitating the integration of technology into the classroom. For this group of educators,
an increased understanding of technology implementation was considered a key part of professional
development. This interest in learning how to integrate technology was present across job types, and
approximately one-third of respondents from each profession mentioned this as a crucial part of
professional development.9 Their comments included:

                             o “Learning how to integrate technology such as Discovery into daily lessons.”
                             o “The integration of technology use in the classroom to expand and reignite students interest in
                               the ‘textbook’ goals and standards.”
                             o “it has not only elevated my teaching by modeling best practices but it also opened a world of
                               dynamic and 'ahead of the curve' technologies that my teachers and students are craving.”
                             o “When I first became a member, I barely knew how to check my school email. I had created one
                               powerpoint in my professional lifetime, and had bungled its use badly at a conference. I wasn't
                               really excited about trying to integrate technology any further! Now, I use technology every
                               day with my students. I create lessons that integrate media and provide instruction for my
                               students in how to use internet resources and create projects using media.”

Providing Access to Practical Resources10

Almost one-third of the respondents (32.4%) also stated that professional development was dependent
upon the provision of good resources. They explained that materials needed to be easy to use,
accessible, and of low cost. The respondents also felt that grounded examples of resource
implementation were essential. They wrote:

                             o “-Examples of good teaching -Samples of good lesson plans/activities”
                             o “…having hands-on demos and seeing how things are being used in the classroom is important.
                               It is more valuable to me to see an actual teacher in action rather than having someone who is
                               not invested in the learning and the outcomes.”
                             o “There are too many Web2 sites out there and DENers share not only good options that they
                               found, but often share student example as well. When trying to push VoiceThreads here, I was
                               able to share actual student products and even had students here participate in a remote
                               classroom's experience”


9
     	
  The	
  one	
  exception	
  to	
  this	
  trend	
  was	
  Curriculum	
  Specialists	
  (n=4).	
  50%	
  of	
  respondents	
  who	
  identified	
  with	
  this	
  job,	
  
although	
  this	
  may	
  be	
  due	
  to	
  the	
  small	
  sample	
  size	
  of	
  this	
  group.	
  
10
         	
  It is important to note that respondents who mentioned access to resources frequently seemed to be talking about the
benefit of the resources that the DEN currently offers, rather than resources in general.


                                                                                                                                                                                                                                                    22	


Twenty-three (23) of these respondents specifically mentioned having access to resources that are
essentially “ready to go” into use immediately.

       o “In this current environment that is very anti-teacher, we need resources that are "classroom
         ready" and easy to implement.”
       o “By giving me practical lessons that I can use right away.”

Networking with colleagues

Of the 222 respondents who answered this question, 56 (25.2%) said that a key to professional
development was having a “network of colleagues” with whom to connect and learn.

       o “The ability to connect with others in the same professional position to share ideas and
         strategies. We all can learn so much from each other, and it helps immensely to have such a
         great collective brain to connect to when I need help or ideas.”
       o “A supportive PLN. That is the greatest thing the DEN offers me...the assurance that I'm not
         alone, and a resource for other teachers.”
       o “Being able to connect with other educators, not just within my district, but all over the world
         has become invaluable to me.”

Technology Integration Specialists (n=85) were the group that gave this answer the most, with 31.8%
saying this was important. They were closely followed by Classroom Teachers (n=82) with 28.0%
saying this was important and Administrators (n=9) with 22.2% saying this was important. Only 9.5% of
Others (n=42) thought that a network of colleagues was key to professional development, and no
curriculum specialist gave an answer that suggested having a network of colleagues was crucial to
professional development.


Of the 56 respondents who mentioned a “network of colleagues”, 21 specifically mentioned the value of
“in-person events”.

       o “I think the most essential part of promoting our growth is the in-person events where we can
         meet and work with other like-minded people around the country.”
       o “I love the in-person events because it gives me a chance to form relationships with other
         educators”

Over half of the respondents giving this answer were Technology Integration Specialists. Twelve
members of that group mentioned in-person events. Five Classroom Teachers, three Others, one
Administrator, and no Curriculum Specialists mentioned this as an important part of professional
development.

Keeping Up With Current Trends


                                                      23	


53 respondents (23.9%) mentioned that “keeping up with current trends” in education was key to
professional development. Although there were a few different ways that respondents defined “current
trends” (resources, best practices, legislation) 42 of the 53 respondents specifically said that keeping up
with trends in educational technology was a key part of professional development. It was considered
important by all professional groups, with Technology Integration Specialists mentioning it the most
(28.2%) and Classroom Teachers mentioning it the least (18.3%).

              o “I think it's essential for teachers to be up to date on the latest trends/technologies available.”
              o “New ideas - particularly in the area of technology since it is constantly evolving.”.
              o “I feel like I am always on the cutting edge of educational technology through the contacts and
                experiences I have had with discovery.”


Finally, other professional development needs mentioned by respondents included a need to focus on
particular types of content, including STEM and core subjects (18 respondents, 8.1%). A few also
mentioned a general need for educators to keep seeking out new opportunities to learn (16 respondents,
7.2%).

The open ended question on professional development was followed by a question that asked the
respondents to “please indicate how much or how little DEN has contributed to your professional
growth?” A five point scale was provided with 5 being “tremendously” and 1 “being not at all.”


                                                                                    Almost everyone, (89.2%)
                                                                                    answered either “tremendously” or
                                                                                    “very much.” Most (68.5%)
                        Tremendously        Very	
  much,	
  
                           ,	
  68.5%	
       20.7%	
                               provided the highest possible
                                                                                    response “tremendously. No
                                                                                    respondent said that DEN had not
                                                         Somewhat,	
                contributed to their professional
                                                                8.6%	
  
                                                 Not	
  at	
  all,	
                growth at all, and only 5
                                                   0.0%	
   licle,	
  
                                                        Very	
  
                                                              2.3%	
                respondents answered “very little” 	


       Figure 21: Please indicate how much or how little DEN has
       contributed to your professional growth. (n=222)


All respondents were then asked, “In what ways has your participation in the DEN community
supported your professional growth? Please provide specific examples.”


                                                                           24	


Although many new ideas and trends surfaced, many responses to this question mirrored those
provided in defining professional development in general. Participation in DEN supported professional
growth primarily through:

       •   Building a network of colleagues
       •   Learning how to integrate technology
       •   Enriching practice with new ideas
       •   Helping members keep up with current trends

Building a network of colleagues

By far the most popular single response was given by 110 of 213 participants (51.6%). They said that
the DEN supported their professional growth by providing a “network of colleagues.” Respondents
mentioned that this network provided access to “like minded individuals” who provide support, ideas,
and answers to questions. It gave them a place where they felt they belonged and fit in. They reported
that these colleagues challenged them and helped them learn and grow. Examples of their comments
included:

       o “This connection through Social Media has by far been the best professional development I have
         had as a teacher in my 22 years of teacher.”
       o “It has enabled me to look outside of my classroom and find a community of other teachers
         sharing the same struggles in new and innovative ways.”
       o “I literally have access to HUNDREDS of the best tech educators in the world. If I have a
         question, I can crowd source for a solution or idea.”
       o “I have struggled with being a "geek" forever and to this day still get fussed at for wanting to try
         to teach and use new things. Through the DEN I finally feel like I fit in. The very first time that I
         attended a DEN event, I cried.”

Integrating Technology

Forty-five respondents (21.1%) mentioned that DEN helped them better use technology in their practice,
integrate technology into the classroom, and fully explore what technology could bring to their work.
They talked about how this new understanding of technology had a transformative effect on their
professional lives.

       o “Almost everything I have learned about technology and web 2.0 resources, I have learned from
         and through the DEN.”
       o “I feel like I am always on the cutting edge of educational technology through the contacts and
         experiences I have had with discovery.”
       o “Many colleagues feel comfortable approaching me for information about technology use
         because they know that I was recently a non-user! I give all of the credit for my change to my
         participation in the DEN community.”


                                                       25	


Enriching practice with new ideas

Thirty-two respondents (15.0%) explained that the DEN had enriched and expanded the work that they
were already doing by giving them new ways to look at old materials and lessons and new ideas to use
with students. Because of exposure to DEN, these participants explained that they were able to approach
their work with fresh thinking and new approaches.

       o “What better way to discuss global climate with my students then to see and speak to a scientist
         who studies polar bears (webinar)?”
       o “I've been validated and encouraged to try new things.”
       o “The DEN has changed the way I approach education”


Helping members keep up with current trends

Although fewer respondents mentioned “keeping up with current trends” in answer to this question
(15.5%) as compared to those (23.9%) who responded in kind to the more general question on
professional development, 33 respondents did appreciate that DEN provided this service. These
participants felt that had greatly raised their awareness of current educational thinking, new trends, and
fresh ideas.

       o “The DEN community has been a source of new ideas, new teaching methods…”
       o “Because of the DEN community, I have always believed I was a year or two ahead of what was
         coming. With the DEN, I was already there.”

Other comments were each made by fewer than 10% of the respondents. They included the following:

       •   Increased confidence (n=18). Respondents explained that DEN had helped them learn to believe
           in themselves and their own abilities. 9 respondents (4.2%) said that DEN had helped them
           develop as leaders.
               o “I have been comfortable to take risks and challenge myself to try something new with
                  my students.”

       •   Leadership development (n=9). Respondents said that DEN had helped them become leaders in
           their districts and schools.

       •   Finally, throughout the answer to this question were many mentions of the inspiration,
           motivation that DEN has provided members, and the love that the members have for the
           organization.

              o “Personally and professionally, I am more excited about learning than I ever have been.
                I attribute it to the DEN.”


                                                     26	


o “DEN members provide inspiration & motivation for me to continue on my own path of
         learning & discovery.”
       o “I really love you guys.”

Only 2 respondents (0.9%) said that the DEN had provided little or no growth. One said because he had
not participated enough, and the other simply said “it has not” in answer to this question. Both of these
respondents answered “very little” to the question of how much DEN had contributed to their
professional growth.


Next, respondents were asked: “How could DEN better support your professional growth?”

As was the case when respondents were asked how to improve the Weekly Update, the most popular
answer to this question was that respondents had “no suggestion” for improvement. Ninety-four of the
213 respondents (44.1%) either couldn’t think of anything to add, or specifically complimented DEN
and said that there was nothing more they could do.

41 respondents (19.2%) said that increasing the number of in-person events and institutes would be very
beneficial to their professional growth. Many mentioned that access to “like-minded colleagues” at these
events was very important. 23 of these respondents (10.8% of total respondents) specifically mentioned
that they would like more “local events”. Frequently, respondents requested specific help for their
region.

Thirty-one respondents (14.6%) made requests for specific resources. Some of the respondents
requested resources for use in the classroom and others asked for content directed specifically to
professional development for particular careers. For example, requests included (1) more resources to
help teach STEM and core content , (2) more resources targeted to specific grade levels (in particular
elementary school and high school), and (3) more resources focused on guiding the implementation of
DEN content Professional Development requests included resources specifically targeted at
Administrators and Technology Integration Specialists. Other requests included more free resources,
resources for mobile devices, resources for the SMART board, and more professional development
sessions that provided “follow up” to prior PD sessions.

Finally, respondents were asked one more open ended question about professional growth: “What
suggestions do you have for additional professional development services that DEN could provide
its members?”

“No suggestion” was again a very popular answer among the 213 respondents, with 68 respondents
(31.9%) giving this response.

Once again, over one-third of the respondents (39.9%) requested particular kinds of resources for use in
the classroom and specific content in professional development sessions. The list of resources was
basically the same as that generated for the previous question. However there were additional requests

                                                   27	


that included materials that students themselves could use, materials to help with teacher certification,
and materials targeted at special education students.

Some respondents (13.1%) requested more direct support at the local level.

       o “Providing smaller "institute-like" events that are more local (perhaps by state or region) so that
          more people can attend.”
       o “Perhaps more regional/local overnight experiences. One week in the summer is just not
          enough!”

An additional 8 respondents mentioned wanting more in-person event without talking about support on
the local level.

Finally, the participants generated a number of other suggestions, each mentioned by fewer than 10% of
the respondents. These included:

       • Improved ease of access to online materials. Eight people wanted access to archives for quick,
          “on demand professional development.” Five wanted resources that could be put into practice
          immediately (similar to the “quick tips” suggestion in the “weekly update” section.).
             o “For example, a webinar - 30 mins - animoto OR a webinar - 30 minutes - edmodo, etc.
                Quick, succinct, one topic.”

       • Changes in Webinars. A few (n=7) expressed a desire to see “DEN experts” more directly
          involved in webinars and other forms of professional development. These experts included
          people like Lance Rougeux as well as Discovery Channel celebrities. Others mentioned “timing
          issues”, particularly with how online events don’t seem to accommodate west coast members.
          Others wanted more opportunities to have DEN members as webinar presenters.

       • The addition of various activities and affordances. There were dozens of additional ideas ranging
          from a suggestion to add a book club discussion, to a suggestion to do “student adventure trips”
          locally, to a suggestion to have training materials in PDF form so they would print more easily.


The respondents were then asked one last question about professional development, “As a member of
the Leadership council, and a producer of DEN events, rank the following resources in order of
how beneficial you think they are to the other educators in your DEN community. (Put the items
in order of their perceived benefit, 9 being most useful, 1 being least useful.)” Respondents were
given a list of nine DEN services to choose from. (See table 10)


                                                      28	


TABLE10
           Rankings of how useful resources are to others in your field. (n=213)

                                                                                                                                                                                                                                                    Average ranking, from
                                                                                                                  DEN Resources
                                                                                                                                                                                                                                                            1 to 9
           Local in-person events (n=198)11                                                                                                                                                                                                                    6.49
              Days of Discovery (n=193)                                                                                                                                                                                                                        6.14
               Summer Institutes (n=200)                                                                                                                                                                                                                       5.88
                   Webinars (n=187)                                                                                                                                                                                                                            5.38
       Educator resources on the website (n=204)                                                                                                                                                                                                               5.33
              Virtual conferences (n=194)                                                                                                                                                                                                                      5.23
             Pre-conference events (n=195)                                                                                                                                                                                                                     4.91
       Exclusive Star giveaways (e.g. Mindmiester
                                                                                                                                                                                                                                                               3.62
                or Schooltown) (n=209)
                 Training Kits (n=199)                                                                                                                                                                                                                         3.26


Overall, the Leadership Council ranked six resources as being very useful to other educators. They
consistently ranked those opportunities that provided in-person interactions higher than either web-based
communications or product-related resources. Local-in person events were considered to be the most
useful to other educators with a mean score of 6.49, a mode of 9 (most useful). Training kits on the other
hand, were considered least useful with a mean score of 3.26, and a mode of 1 (least useful)

These trends were observed consistently across all professional groups. One notable difference,
however, occurred with the Administrators (n=9) who ranked Pre-Conference Events as the second most
useful resource with a mean score of 6.5 and a mode of 8. The average ranking for other professionals
put these events in seventh place.

Although there were strong and consistent trends with these answers, the range for every resource listed
was between 1 and 9. Every resource had at least three respondents who found it least useful, and at
least nine respondents who found it most useful.


Summary of professional development

Overall, respondents felt that DEN had been instrumental in their professional growth. There was a very
strong correlation between what respondents identified as being essential to professional growth in their
fields, and the resources and services that DEN provided. When asked “how much or how little had
DEN contributed to your professional growth?” no single respondent answered “none”. Approximately
nine out of ten respondents (89.2%) said that DEN had contributed either “very much” or “tremendous-
ly” to their professional growth.


11
          	
  Respondents	
  scored	
  at	
  least	
  one	
  resource	
  but	
  did	
  not	
  score	
  every	
  resource.	


                                                                                                                                                                                                                                                      29	


Respondents said that the keys to professional growth were understanding how to integrate technology,
having access to useful resources, having the opportunity to network and learn from others, and making
sure to keep up with current trends. Respondents named a number of ways that DEN had helped them to
grow professionally, including assistance in building a network of like-minded colleagues, helping them
learn how to better integrate technology into their work, enriching their practice with new ideas and new
ways of thinking, and helping them stay up-to-date and aware of current educational trends. Although
numerous respondents (44.1%) said that there was nothing more DEN could possibly do to help them
with their professional growth, over half (55.9%) did have specific recommendations including requests
for an increase in in-person events; access to resources that were more targeted at specific grade levels,
subjects, or professions; and an increased effort to make DEN more democratic by opening up
opportunities to attend events to more members.


Use of Technology
To close the survey, all respondents were asked 4 questions about how they used technology in their
practice, and how DEN had affected that use of technology.

First, all respondents were asked “How has your use of technology in your work changed over the
last three years as a result of your participation in DEN?”

Of the 210 respondents who answered this question, 203 (96.7%) indicated that the DEN had improved
and increased their use of technology in some way. 40 respondents (19.0%) clearly stated that their use
of technology had increased, and of those, 21 respondents (10.0%) explained that it had increased their
use dramatically.

       o   “My technology use as quadrupled twelve times because of the DEN.”
       o   “There has been a 100%+ improvement.”
       o   “Exponentially! (and I used a lot of technology to begin with!)”
       o   “My use of technology has expanded beyond my own belief. I feel so much more comfortable
           and use technology much more than I expected.”


Almost two-thirds, (62.9%) explained that DEN helped them better use technological resources in some
way. 82 (39.0% of total respondents) said that DEN helped them learn how to use, or greatly improved
their use of, a particular technological tool. 20 respondents (9.5%) mentioned improvement the use of
video or Discovery streaming. 18 respondents (8.6%) mentioned improvement in the use of web 2.0
tools. Other specific tools mentioned include blogs, webinars, prezi, mashups, music in the classroom,
and podcasting. 29 respondents (13.8%) didn’t name any particular tool, but said that DEN had provided
“new” resources.

The 48 other respondents (22.9%) who mentioned resources focused on behavior rather than any

                                                    30	


particular tool. 24 respondents said that DEN had taught them how to “integrate technology” into the
classroom.

       o “I integrate technology more often in my daily classroom activities.”
       o “More of my teachers are comfortable and able to infuse technology into their curriculum”

       A few, (n=8) said that DEN’s support of their technology use had opened up “new approaches to
       teaching.

       o ”I have implemented lessons that I would not have thought of.”
       o “I am using so many new ways to teach the students.”

       Other descriptions of behavior changes included mentions of “going paperless”, being open to
       experimentation, working “smarter, not harder”, and being able to focus on what is really useful in
       technology.

30 respondents (14.3%) said that DEN had helped them learn how to use technology to greatly improve
students’ experience in the classroom. 14 respondents (6.7%) mentioned improvements in “student
engagement” and 12 respondents (5.7%) explained that they were using technology to shift to creating
more “student centered learning”.

       o “I've changed the way I use technology with students--giving them the freedom of exploration
         and creativity.”
       o “An emphasis on CREATIVITY and having students produce original work and projects.”

       An additional 4 respondents mentioned that their use of technology had directly led to increased
       student growth.

25 respondents (11.9%) said that their involvement with DEN had allowed them to become “tech
leaders” in their own schools and districts.

       o “I am a respected tech trainer for my district. I was recently asked to design and teach a Digital
         Citizenship course for high school . Much of what I teach I learned from my PLN”
       o ”	
  I have become the go to person for technology assistance.”
       o “I am now the new technology "Guru" at my local district and in other area schools.”


Finally, the participants generated a number of other ways that DEN had changed how they used
technology, each mentioned by fewer than 10% of the respondents. These included:

       • Keeping up with current trends (n=16).


                                                      31	


• A network of colleagues (n=14). Respondents said that DEN had given them a community of
          like-minded professionals who enriched their technological learning.

       • Student engagement (n=14). Respondents explained DEN had taught them how to use technology
          to increase and enhance “student engagement” in the classroom.

       • Confidence (n=13). Respondents said that DEN had made them significantly more “confident”
          when it came to using technology.

       • Career shift (n=9). Respondents indicated that DEN had changed their use of technology so
          significantly that they went on to start a new career.
              o “I went and got a Masters in IT because my new passion for technology.”
              o “I am pursuing a Master's degree in Educational Technology Leadership.”


Respondents were next asked, “Other than lack of time, funding, and/or equipment, what is the
greatest challenge that you face in regards to using technology in your work?”

Of the 210 respondents who answered this question, only 8 (3.8%) said that they faced “no challenges”
in regards to using technology. 14 respondents (6.7%) specifically mentioned that one, two, or all of the
three challenges mentioned in the question (time, funding, equipment) were the main challenges that
they faced. The challenges cited by at least 9% of the respondents were:

       •   Getting buy-in from other members of the school district
       •   Connecting technology to the curriculum
       •   Dealing with access issues

Getting Buy-In

88 respondents (41.9%) said that the biggest challenge they faced in using technology was getting “buy
in” from other members of their schools and districts. Comments included:

       o “…district leadership, the school board members, and IT staff continues to make using
         technology in the classroom challenging.”
       o “Colleagues that are not learning at the same level that I am and administration that is way
         behind in their level of adoption of tech and therefore do not support me.”
       o “I have a difficult time getting some co-workers to get on board with using more technology in
         their class. Some still see tech as an 'extra' thing that there is no time for rather than it becoming
         a useful tool just like paper and pencil.”
       o “Teachers' unwillingness to infuse or want to use technology.”


                                                        32	


Members of all professions mentioned that getting “buy in” from others was a problem. No one
       group was singled out; Respondents said that it was a problem getting “buy-in” from other teachers,
       administrators, peers, superintendents, and from many other members of their staffs.


Connecting Technology to Curriculum

26 respondents (12.4%) mentioned that connecting technology to curriculum was the greatest challenge,
mentioning one or more of the following:

       •   16 of these respondents said that making sure the curriculum was driving the use of technology
           was the greatest challenge.
               o “It is also important to show educators the difference between the use of technology for
                   technology sake and high quality lessons that incorporate technology to increase student
                   achievement.”

       •   11 of these respondents said that meeting district and state curriculum standards, and the
           demands of standardized tests limited their opportunities to fully utilize technology in their work.
               o “We seem to be, more and more, governed by "the test". Finding ways to incorporate
                   technology while still meeting standards is a challenge. The activities I develop have to
                   be very much tied to standards.”

       •   A few (5) said that keeping up with what their students knew and were familiar with, and making
           their use of technology relatable to their students’ experiences was their greatest challenge.


Dealing with Access Issues

19 respondents (9.0%) said that access issues, district firewalls, and blocked sites were the greatest
challenge in regards to using technology.

       o “Oppressive policies have limited student and teacher access to exciting new media creation
         tools, publishing, and web 2.0 tools, and sent us back to the pre-internet days in many cases.”
       o “Filters that block me from many of the wonder tools that the DEN highlights or offers us.”


Other issues that respondents mentioned included:

       •   A lack of expertise in using the tools they wanted to use (n=13)
       •   Not knowing which technological resources to use because of “too many choices” (n=11)
       •   Specific technical issues, and problems troubleshooting the technology they had (n=8)
       •   Keeping up with everything that is offered (6 respondents.)


                                                        33	


Respondents were then asked, “Is this a problem that DEN has been able to help you with?”

Of the 210 respondents who answered this question, over half (59.5%) answered “yes, DEN has been
able to help.” 85 respondents (40.5%) answered that “no, DEN has not been able to help” with this
problem.

The 125 respondents who answered that DEN was able to help with their problem were asked, “How
has DEN helped you address this challenge? Please be specific and provide examples.”

The 85 respondents who answered that DEN was not able to help with their problem were asked, “In
what ways could DEN help you with this challenge?”

Getting “Buy-in”

Of the 88 respondents who had said that “getting buy in” from others was their greatest challenge, 55
respondents (62.5% of those 88) said that the DEN was, in fact, able to help them with this challenge.

       •   24 respondents said that it was the high quality of DEN’s resources that helped them get buy- in
           from others. They complimented the resources as being “easy to use” and “appealing” and said
           that the grounded easy-to use examples help them make the case to their peers.
               o “Given me simple ideas that even technically challenged teachers can replicate.”

       •   Other responses included “DEN has provided a good pitch” for their colleagues, said that they
           acquired good ideas for buy-in from “other members of DEN”, and that DEN offered good
           incentives.

Over one-third of the leaders (37.5%) said that DEN was not able to help with their “buy-in” problems.
The largest number (12) of these respondents said that there was nothing DEN could do, that it was a
local or institutional problem. The remaining respondents had a diverse number of recommendations,
including hosting a local “Day of Discovery” perhaps focused on administrators and providing specific
professional development sessions (e.g. webinars, networking opportunities) that dealt with this
particular problem.

Connecting technology to curriculum

Of the 26 respondents who said that connecting technology to the curriculum was the biggest challenge,
17 (65%) said that DEN was able to help them by either “providing exciting lessons” and other
resources, or by reaching out to other members of DEN to get ideas for good ways to connect the
technology to the curriculum:

       o “Being able to ask for advice and they guide you or give you a great tip to push that teacher over
         to being a facilitator of learning.”


                                                      34	


The remaining nine (34.6%) leaders said that DEN was not able to help them connect technology to the
curriculum. Five respondents had no suggestion as to how DEN could help. Two respondents
recommended targeted webinars to address the issue, and one recommended creating more “standards-
based, technology rich lessons”.

Access Issues

Of the 19 respondents who said that “access issues” were their biggest challenge, only six (31.5%) said
that it was a challenge DEN had helped with. Answers about how DEN had helped included the fact
that the resources provided by Discovery Education had made it easy to make a pitch for change, that
DEN had personally leant a hand to resolve the issue, and that the DEN community had provided “way
arounds” for some of the blocks.


The remaining two-thirds of the leaders said that DEN was not able to help with their issue. Six said
that there was nothing that DEN could do, it was a local issue. Two respondents recommended specific
training for Administrators to address the issue, two suggested that DEN develop a simple way to make
the case that is backed up with research, and three suggested providing other ways to get to relevant
material (embedded on the site, through Facebook, or on mobile devices that kids could access at home.)

Other challenges

In talking about how DEN had successfully helped with other technological issues, many respondents
explained that DEN’s resources, including grounded examples, had been essential in helping them deal
with the challenge. Good resources had helped respondents deal with limitations of time and
organization. Many respondents explained that the fact that DEN was a single location that they could
go to for multiple needs, saved them a lot of time, and helped keep them organized. The fact that there
were so many free resources had also proven to be very helpful.

       o “DEN has tons of ideas for lesson plans and ways to use technology and other resources in the
         classroom.”
       o “Seeing what other DEN members do is always inspiring and saves a lot of time. Many of the
         tools that are showcased in blog posts, at in-person events, and at the virtual conferences are
         free so money is not really the biggest factor.”

This second quote touched on another common theme: that respondents had usually been able to find
tips, suggestions, and solutions from the other members of the DEN network.

Of the 33 respondents who had other kinds of technological issues that they said DEN had not been able
to help them with (including a lack of expertise with tools, very specific technical issues), over half
(57.6%, 19 respondents) had no ideas about how DEN could help. Most of the suggested remedies were
creating training videos and online resources to address common troubleshooting issues, creating more


                                                     35	


easily accessible databases of information, and providing more “ready to go” lesson plans and resources
that could be put into practice immediately.


Respondents were then asked one final question about their use of technology, “What other challenges
regarding technology in your work might DEN be able to help you with?”

Of the 210 respondents who answered this question, 77 respondents (36.7%) had “no suggestion” or “no
idea” what else could be done. As with similar answers to other questions, these responses were
peppered with compliments to DEN and requests to “keep it up.”

       o “The DEN needs to keep doing what they do! They are very supportive and always reachable. I
         have made some very close friends within the DEN community and they have been there every
         step of my journey in this tech-developing world.”
       o “I feel that if something were to come up, the DEN will be the first place that I go to for
         assistance and advice.”
       o “I'm very happy...but I know the DEN will continue to improve and give me even more


The remaining comments clustered around two major concerns. Participants mentioned needing

       •   Additional resources for technology
       •   More assistance with outreach

Additional Resources

Thirty-three respondents (15.7%) had suggestions for different types of resources and content that would
be helpful to them in regards to technology. 10 respondents asked for new technology integration ideas,
5 wanted more examples and lessons that could be put into use immediately. Other requests included
calls for more resources to integrate technology into the teaching of STEM and other core subjects and
requests for materials to be targeted at specific grades.

       o “More tips and tricks rather than big major lessons and projects.”
       o “Providing more examples of student produced content at all levels.”
       o “Would it be possible for the DEN to offer workshops let's say using web 2.0 or 8 Ways to Use
         DE streaming for K-2, 3-5, 6-8, 9-12? Then, get into some real examples of work created within
         these grade levels using these tools”

More Assistance with Outreach

Thirty respondents (14.3%) wanted more assistance with reaching out to administrators, other teachers,
and other peers and superiors in their districts. They asked for more help in getting others on board with
technology in school and with DEN in particular.


                                                    36	


o “Getting quality tech information out to more people. Sometimes I am not sure if the other staff
         in my district are getting newsletters that I get. I hope that they do get some correspondence
         from Discovery - maybe on a monthly or quarterly basis. I think that many staff do not want a
         weekly message but they would look at something received less often.”
       o “Training the public, teachers, students, and administrators on what you have to offer.”
       o “Reach out to administrators and even our legislators to stress the importance of 21st century
         learning skills.”

Finally, the participants mentioned a few other ways that DEN could help with technology, each
mentioned by fewer than 10% of the respondents. These included:

       •   Funding (n=17) Respondents specifically asked for assistance with funding and other issues
           related to the cost of materials. Nine of these were requests for more free resources, and the wish
           to make access to Discovery less expensive. Eight respondents suggested that DEN could create
           resources to help members seek out funding and grants for technology use.
               o “Finding grants and other ways to fund technology.”

       •   Help with staying current (n=14). Respondents stressed that they wanted DEN to continue
           helping them stay current with new technologies, new trends, and new ideas for use in their
           work.

       •   Local support (n=13) Respondents requested more local support and in-person events.

       •   Resources for mobile devices (n=6) Respondents wanted more DEN materials for IPads and
           other mobile devices.

Summary of technology use

Respondents to this survey reported that, in general, DEN had a major impact on the way they used
technology in their work. Nearly all respondents (96.7%) reported that their use of technology had
improved and increased in some way as a result of their involvement with DEN. Respondents
specifically mentioned improvement with specific products like video integration, or social media; an
increased understanding of how to smoothly and usefully integrate technology into their work; and an
overall improvement in instructional practice leading to a more “student centered” classroom. Many
respondents pointed out that they had become “tech leaders” in their school communities.

Almost all respondents (96.2%) reported facing challenges in terms of using technology in their work.
The top challenges were getting “buy-in” from other members of the school district that using
technology was beneficial, connecting technology to the curriculum in a meaningful way, and dealing
with access issues. More than half of respondents (59.5%) said that DEN was able to help them with


                                                       37	


their challenges, mostly through high-quality resources and access to a helpful network of colleagues.
Less than half of the respondents (40.5%) said that DEN was not able to help with their challenges,
mostly because they were outside of DEN’s sphere of influence.


In completing the survey, respondents were asked to “Please add any additional comments that you
want to share about your DEN experience.”

Nearly all respondents used this as a final opportunity to praise DEN. Comments included:

       o “I cannot stress enough how indebted I am to the DEN for the support and encouragement that
         the DEN team has offered me as an educator. I feel as if they have been the light that has helped
         me to stay inspired as a teacher. I am very fearful that this, like so many cuts in education, will
         also end leaving me to depend on the offerings in tech locally, which are hard to find, expensive
         and not supported by my district. THANK YOU DEN!”
       o “I can't imagine still being a teacher in the 21st Century without being a member of the DEN.
         It's not an option.”
       o “Thank you for treating us like professionals! You are the only ones who do.”
       o “DEN has been an awesome experience. I just hope that Discovery realizes the gem that they
         have. I know it's probably hard to justify the money without hard data. They are truly making a
         difference for teachers! It's easy to recruit others for the DEN because they see how my face
         lights up when I talk about it. Thanks Discovery!”


Discussion and Recommendations
Four guiding questions were generated in conceptualizing this study. These questions informed the
development of the survey and now become the focus of discussion of the results. The questions were:

          What resources, services and products do DEN members use?

          How do DEN members use those resources, services, and products?

          How has DEN affected their professional growth?

          How has DEN affected how they use technology in their work?

What Resources, services, and products do DEN members use?

Overall, this study found that Leadership Council members were extremely active in DEN and
committed to using its resources, services and products. The fact that 84.7% of the respondents invited
to this survey completed it is itself a testament to that commitment. The participants regularly availed
themselves of nearly every resource and service that DEN had to offer. The most heavily used and the


                                                      38	


most appreciated resource was the Weekly Update. Three-fourths of the respondents read the Update as
often as possible, every week.

The participants also valued their interaction with peers and appreciated how DEN facilitated these
learning opportunities. Over two-thirds interacted with DEN through some form of social media at
least once a month and half interacted over distance at least once a week. Although all forms of social
media were utilized, blogs and Facebook were preferred. Many respondents discussed the value-added
of being able to collaborate and share information via social media through DEN.

The Update and social media were not the only heavily used resources and services used by the
Leadership Council members. Over one–third of the respondents attended webinars at least monthly.
Although exact information about the amount of general usage of the Resource Library was not gathered
through this survey, respondents indicated that they both uploaded and downloaded materials from the
Library and found the resource to be useful. Notably, however, one third of these leaders had never
uploaded a resource to the Library.

Overall, the participants from the Educator’s Leadership Council were highly involved in DEN and
heavily utilized all of its resources, services, and products. They were dedicated to participating in DEN
and interacted with the network at least on a weekly basis. They found their interactions to be very
useful to their professional lives.

How do DEN members use those resources, services, and products?

Members used the resources, services, and products in a variety of ways. They were very interested in
keeping up with current trends in education. . They found interaction with DEN through social media
and the Weekly Update to be great sources of information for learning about the “cutting edge” issues
and educational technology.

The leaders were also committed to finding resources to use in their work. Participants reported finding
a plethora of practical tools that they could implement from DEN resources like the webinars, Resource
Library, and Weekly Update. Access to grounded, easy-to-use resources that could be applied very
quickly to the school environment motivated leaders to turn to DEN. Requests for more such “turn
key” “classroom ready” resources were common.

Finally, leaders turned to DEN to provide avenues for collaborations and opportunities to learn from
colleagues. They recognized that one of the greatest values of DEN was the membership itself. They
looked for ways to share ideas and support one another.

How has DEN affected their professional growth?

Overall, respondents reported that DEN had a major effect on their professional growth. Approximately
nine out of ten respondents (89.2%) said that DEN had contributed either “very much” or
“tremendously” to their professional growth. There was a very strong correlation between what


                                                    39	


respondents said was necessary for their professional development and the ways in which they said DEN
had helped them grow professionally.

One-third of respondents (32.9%) said that developing an understanding how to integrate technology
into their work was a very important part of professional growth. Many respondents (21.1%) mentioned
that this was exactly the kind of service that DEN had provided for them.

Respondents clearly saw other DEN members as an invaluable resource. One-quarter of the respondents
(25.2%) mentioned that a “network of like-minded colleagues” was key to professional development and
over half of the respondents (51.6%) stated that this kind of “network” was exactly what DEN had
provided for them. Additionally, members frequently mentioned the fact that they could look to their
DEN community for help and support.

DEN participants especially appreciated the opportunities DEN provided for interaction with colleagues.
Overall, when asked to rate the resources that DEN provided in terms of how they assisted with
professional growth, in-person events and opportunities to network consistently ranked higher than
online events and specific product-related resources. Respondents indicated that not only has DEN
helped them grow professionally, it has helped transform their practice. There were multiple mentions of
DEN being “more valuable” than a Master’s degree, and of how DEN had transformed respondents into
“leaders.”

How has DEN affected how they use technology in their work?

In general, respondents reported that their involvement in DEN has had a tremendous positive impact on
their use of technology in their work. Nearly all respondents (96.7%) reported that their use of
technology had not only increased but improved in some way as a result of their involvement with DEN,
with many respondents reporting that DEN had been “transformative” for them. Respondents who were
“technology novices” prior to their involvement in DEN reported becoming “leaders in their schools”.
Respondents who already used a lot of technology prior to their involvement in DEN reported
transformative growth as well.

Almost two-thirds of respondents (62.9%), said that DEN had specifically helped them learn how to use
specific kinds of technology to integrate into their work. Respondents mentioned video integration, web
2.0 resources, music, webinars, and many other types of technological tools that DEN had helped them
master. Respondents also mentioned that DEN had helped them with technology integration on a more
fundamental level, helping them enrich their curriculum and using technology to make their classrooms
more “student centered.”

The vast majority of respondents (96.2%) explained that they faced some kind of technological
challenge in their work. The most common challenge faced by respondents was getting other members
of their staff and district to accept that technology could make a significant and important contribution to
their work. Other challenges included a concern for making sure technology was richly connected to
curriculum rather than simply an “add on” and also access issues, such as district firewalls.

                                                    40	


More than half of respondents (59.5%) said that DEN was able to help them with their challenges,
mostly through high-quality resources and access to a helpful network of colleagues. Less than half of
the respondents (40.5%) said that DEN was not able to help with their challenges, usually stating that it
was because of forces outside of DEN’s control.

Additional Thoughts and Recommendations

       •   Since the respondents to this survey were such an extremely active and involved group, it would
           be worth considering doing a similar, but smaller survey of other types of DEN members (Stars
           and general members). Such as study would allow DEN to compare those responses of those of
           the members of the leadership council. Questions from this survey instrument could be used to
           conduct focus groups, seminars, and other surveys.

       •   Since the responses of Administrators did not always reflect those of the other respondents,
           further study on how DEN impacts Administrators is recommended. Throughout the survey
           there are multiple mentions of Administrators needing more support and resources. Additionally,
           because numerous other professionals mentioned a need to reach out to Administrators to get
           more “buy in” for using DEN in their schools, more research on how Administrators experience
           DEN could be very beneficial to the community as a whole.

       •   The respondents to this survey were extremely knowledgeable about DEN, its services, and how
           it operates. Due to the number of specific suggestions, there were simply too many good ideas in
           the survey data to include in this report. Therefore, it would definitely be worthwhile for DEN
           staff to look at the raw, open-response data that was collected in this survey. Particular attention
           should be given to the recommendations for the Weekly Update, the recommendations for
           further professional development services, and the recommendations for how to help with
           challenges presented by the use of technology in respondents’ work.


Conclusion
The responses to this survey revealed that the members of the Leadership Council were incredibly
involved in and dedicated to DEN. They interacted regularly through all possible channels, using all of
DEN’s resources. The Discovery Education Network has had an incredible impact on the professional
development of its members. Discovery has connected educators from all around the country, has
provided exceptional professional development, and has increased and improved the use of technology
in the classroom. As mentioned by numerous respondents, Discovery has done all of this during a time
when budgets are being cut and districts are becoming less friendly to experimentation in the classroom.

Probably the best way to sum up all of this is with the voice of one of DEN’s members:


                                                        41	


“I have said this before, and I will say it again - Thank you so very much to the DEN for providing
exciting ways to be a great teacher!!!! Teachers are constantly asking me, ‘Where did you learn that?’
My response, ‘The Discovery Educator Network! You should join it.’”


                                                  42	


Appendices
Appendix A

Complete ratings of social media to interact with DEN.

                  1 – Not                                                          Number
                            2 – Not     3–       4–        5 - Very     Rating
                   at all                                                            of
                             useful   Neutral   Useful      useful      Average
                   useful                                                         Responses
       Blogs            2         4        21       77            121      4.38         225
       Facebook        12         9        64       71             68      3.78         224
       Twitter         24         4        61       60             75      3.71         224
       Edmodo          27        17        87       63             27      3.21         221
       LinkedIn        42        25       112       36              2      2.68         217


                                                         43	


DEN Impact Study 2011

  • 1.
      An  Evaluation  of  The  Discovery  Educator  Network     By     Joshua  D.  Briggs,  Ed.M.   Ilona  E.  Holland,  Ed.D.     June  10,  2011        
  • 2.
    Table of Contents I. Executive Summary ii II. Methods 1 • Introduction 1 • Methodology 1 • Limitations 2 III. Results 2 • Demographics and Background Information 2 • Participation in DEN 8 o Social Media 8 o The Weekly Update 14 o Webinars 17 o The Educators Resource Library 19 • Professional Development 21 • Use of Technology 31 IV. Discussion and Recommendations 38 V. Appendices 43 • Appendix A – Complete social media rankings 43 i    
  • 3.
    Executive Summary Overview This reportpresents the results of an online survey conducted in March, 2011 of members of the Discovery Educator Network Leadership Council. The survey was conducted to determine what resources, services, and products members used, how they used them, how DEN had affected their professional development, and how DEN had affected their use of technology in their work. Two- hundred and thirty one (231) members of the Leadership Council complete the survey partially, and two- hundred and ten (210) completed the survey in full. It consisted of 33 to 42 closed and open response questions. Major Findings Respondents reported being extremely involved in DEN, utilizing all that DEN had to offer. Respondents were very active users of social media in their daily lives, and many respondents frequently used social media to interact with DEN, with two-thirds using it to interact with DEN at least once a month and over half using it to interact with DEN at least once a week. Members found social media useful for connecting with like-minded colleagues and sharing resources. Of all the resources DEN offers, the Weekly Update was the most popular. Three-fourths of respondents read the Weekly Update as frequently as was possible, weekly, and only one respondent never read the Weekly Update. Respondents found it useful for getting information about the community and new resources and events that DEN was offering. When asked how it could be improved, respondents wanted the Update to include “quick tips” with resources, lessons, and tools that could be implemented immediately as well as an easily accessible archive of past Updates. Webinars and the Educator Resource Library were also popular with both showing high levels of participation and high ratings of usefulness. Despite this finding, there was room for improvement. Two webinars did not have as high attendance as the others. Thought Leadership and Student Centered, showed the lower levels of attendance with approximately one-fifth of respondents saying they had never attended that type of webinar. In addition, over one-third of leaders said that over the course of a year’s time they had uploaded “no” resources to the Educator’s Resource Library. . Respondents reported that DEN had a major positive impact on their professional growth, with nine out of ten respondents (89.2%) saying that DEN had impacted their professional growth either “tremendously” or “very much” When asked what was most important to professional growth in their field, respondents mentioned building a network of colleagues, having access to great resources, getting new ideas about how to integrate technology, and being able to keep up with current trends. Respondents then went on to say that DEN had helped them in every one of these areas. Respondents reported that DEN had also an extremely beneficial impact on how they used technology in their work. Nearly all respondents (96.7%) reported that their use of technology had improved and ii    
  • 4.
    increased in someway as a result of their involvement with DEN. Respondents stated that DEN had helped them in numerous ways, including learning to effectively use specific products and services, learning to use technology to enrich and enhance their curriculum, and improving their instructional practice and helping them develop curriculum that was engaging and exciting for their students. Almost all respondents reported facing challenges when integrating technology into their work, and over half (59.5%) reported that DEN had been able to help them with those challenges. The most common challenge faced by members was getting “buy in” from others in their districts. These respondents had a hard time getting other teachers, administrators, and peers to accept the benefits of using technology. Other major challenges were connecting technology to the current curriculum in rich ways (particularly using technology to teach STEM and other core subjects), dealing with access issues, and finding funding. On the whole, respondents were overwhelmingly positive about DEN, the services it provided, and the ways in which it had helped them grow as professionals. iii    
  • 5.
    Method Introduction The Discovery EducatorNetwork (DEN) is a worldwide community of teachers, administrators, technology specialists, curriculum specialists, and other educators that is run by Discovery Education. Over one million members use DEN to collaborate, share resources, work with digital media, and network. DEN has a various levels of involvement. The most involved group, the Leadership Council (LC), is a volunteer group of 345 DEN members who help coordinate DEN activities across the country. The LC plays a critical role in supporting the state-level DEN communities through consistent and varied communications as well as organization and support of local activities and events. This study was conducted to gauge how DEN members use the network, and to determine what opinions and ideas members have about DEN and its services. Specifically, this study wanted to answer four key questions: • What resources, services, and products to DEN members use? • How do they use those resources, services, and products? • How has DEN affected their professional growth? • How has DEN affected how they use technology in their work? Methodology Recruitment and administrative procedures. All members of the Discovery Educator Network Leadership Council (DEN L.C.) were invited via email to participate in an online survey. Two hundred forty-eight LC members initially responded to the invitation to take the survey, which was administered through SurveyMonkey.com Participants were able to access the survey beginning on March 7th, 2011, and were given two weeks to complete it. The survey deadline was then extended five more days in an effort to allow more responses. The survey closed on March 25th, 2011. Two hundred and thirty one respondents completed the survey at least partially, and two hundred and ten respondents (84.7% of those who initially signed up) completed it in full Survey structure. The survey asked between 33 and 42 questions (depending on how respondents answered) and consisted of five sections: • Twelve to fifteen questions about respondents’ background, work experience, and demographics. • Eleven to fourteen questions about how respondents used, and what participants thought of, various resources that DEN offers. The resources discussed were: o DEN and social media 1    
  • 6.
    o The WeeklyUpdate o Webinars o The Educator Resource Library • Five to six questions about respondents’ professional growth in relation to DEN. • Four questions about respondents’ use of technology in their work. • One final question asking for any additional comments. Approximately three quarters of the questioned asked were forced-choice questions, and approximately one quarter of the questions asked were open-response questions. Frequently, respondents were allowed to select more than one answer to a question. For this reason, percentages present in this report will often add up to more than 100%. In those cases, the number of respondents (n=x) is noted with a *. The first question of the survey asked a respondent to “check the title that best describes your current job” and was given the choices: • Classroom Teacher • Technology Integration Specialist • Curriculum Specialist • Administrator • Other The answer to that first question affected the language, and a few of the questions, in the rest of the survey. The language of the survey was slightly tailored to fit the profession selected by the respondent. And two answers (Classroom Teacher and Administrator) prompted between one and three follow-up questions. All questions in the survey had to be at least partially answered to continue, with the exception of one question about ethnicity. Limitations It is important to note that the breakdown of the sample by the five professional groups listed above was very skewed. Approximately one-third of respondents self-identified as “classroom teachers” and one- third self-identified as “technology integration specialists”. The remaining one-third of respondents split very unevenly across the final three professional choices. Although in analysis, researchers did consider how results broke down among the five groups of professions listed above, it is very difficult to draw conclusions about specific subgroups in relation to the information in this survey. Results Demographics and Background Information The first third of the survey was dedicated to questions about respondents backgrounds. All respondents were asked twelve questions about profession, work history, the nature and location of the schools in 2    
  • 7.
    which they worked,and ethnicity. Administrators were asked one additional question, “what is your job title”, and Classroom Teachers were asked three additional questions about the subjects they taught: • “Check the subject(s) you are currently teaching.” • “Check the subject(s) you have taught most over your career.” • “Check the subject(s) you have taught while participating on the Leadership Council. Basic demographic information The majority of respondents self-reported as either Technology Integration Specialists or Classroom Teachers. The majority were white, worked in public schools, and described their schools as “suburban”. In each question that respondents were asked, they were given a list of choices and the option to select “other”. Those who chose “other” were asked to specify what they meant. Table 1 Basic demographic information. (n=231) Technology Integration Specialist 38.1% (88 respondents) Classroom Teacher 36.8% (85 respondents) Administrator1 3.9% (9 respondents) Curriculum Specialist 1.7% (4 respondents) Other 19.5% (45 respondents) Profession Library/Library  Media   6.0%  (14  respondents)     Tech  Coordinator/Integration     5.2%  (12  respondents)     Media     2.2%  (5  respondents)     Professional  Development     2.2%  (5  respondents)     Others     3.9%  (9  respondents)   White 82.7% (191 respondents) Hispanic, Latino or Spanish origin 14.7% (34 respondents) Black or African American 10.0% (23 respondents) Ethnicity Asian 3.5% (8 respondents) American Indian or Alaska Native 0.4% (1 respondent) Other (please specify) 2.2% (5 respondents) Public 91.3% (211 respondents) Parochial 10.0% (23 respondents) School Private 6.5% (15 respondents) Description Charter 4.3% (10 respondents) Other (please specify)2 4.8% (11 respondents) Suburban 53.2% (123 respondents) Urban 32.0% (74 respondents) School Setting Rural 25.1% (58 respondents) Other3 4.3% (10 respondents)                                                                                                                         1  Administrators  mostly  identified  themselves  as  “Principals”  or  “Assistant  Principals”  (4  respondents,  or  some  kind  of     “Technical  Coordinator”  or  “Supervisor”  (4  respondents).   2  The  majority  (9  respondents)  described  a  work  environment  that  was  not  tied  to  a  specific  school  but  were  instead  a  mix   of  cross-­‐district  environments  or  home  schools.   3  Five  said  they  worked  in  multiple  schools,  and  three  said  they  worked  off-­‐campus  in  some  way.   3    
  • 8.
    The respondents tothis survey work across 35 different states. The states with the most respondents were California (10.8%), Texas (8/7%), Pennsylvania (7.4%), Florida (6.5%), Maryland (4.8%), Virginia (4.8%), and Kansas (4.3%). Professional experience In general, the respondents were a very experienced group. One-fourth had worked in their current primary professional roles for over 15 years. Figure 1 shows how long respondents had been working in their fields, and Figure 2 breaks that same information down by profession. 80   60   40   20   0   Less  than   One  to   Seven  to   Ten  to   Thirteen  to   Over   Four  to  six   one   three   nine   twelve   fiYeen   fiYeen   Number   11   24   48   29   33   28   58   Percentage   4.8%   10.4%   20.8%   12.6%   14.3%   12.2%   25.1%   Figure 1: How long have you been a Teacher/Tech Integration Specialist, etc. (n=231) Overall, respondents were very experienced, with the largest percentage, 25.1% working for over fifteen years and the smallest percentage, 4.8% working for less than one year. Classroom Teachers (n=85) were particularly experienced, with almost half (47.1%) working for over fifteen years. 50.0%   45.0%   40.0%   35.0%   30.0%   25.0%   20.0%   15.0%   10.0%   5.0%   0.0%   Less  than   Seven  to   Ten  to   Thirteen  to   One  to  three   Four  to  six   Over  fiYeen   one   nine   twelve   fiYeen   Classroom  Teachers   0.0%   0.0%   12.9%   14.1%   12.9%   12.9%   47.1%   Tech  Integra[on  Specialists   3.4%   18.2%   28.4%   15.9%   15.9%   12.5%   5.7%   Curriculum  Specialists   25.0%   25.0%   25.0%   25.0%   0.0%   0.0%   0.0%   Administrators   33.3%   44.4%   11.1%   0.0%   11.1%   0.0%   0.0%   Other   8.9%   6.7%   22.2%   4.4%   15.6%   13.3%   28.9%   Figure 2: How long have you been a Teacher/ Tech Integration Specialist/etc. by profession. (n=231) 4    
  • 9.
    Years working withDEN In addition to speaking about overall work experience, respondents also answered questions about their years in DEN. Experience with DEN ranged from one and six years, with most (70%) of the respondents having participated for six years. Figure 3 reflects how long all respondents had been in DEN, and figure 4 shows how long they had been on the Leadership Council. 40.00%   30.0%   61   70   30.00%   56   42   41   40   20.0%   35   36   27   25   20.00%   22   6   10.0%   10.00%   1   0.00%   0.0%   <  One   One   Two   Three   Four   Five   Six   <  One   One   Two   Three   Four   Five   Percent   0.43%   2.60%   9.52%  17.32%   15.58%   24.24%   30.30%   Percent   15.2%   18.2%   26.4%   17.7%   11.7%   10.8%   Figure3: Years in DEN (n=231) Figure 4: Years on Leadership Council. (n=231) Technology Integration Specialists (n=88) were the group that, on average, have been participating in DEN the longest, with 79.5% of this group part of DEN for four or more years, and 42% having been a part of DEN for all six years of its existence. Only 20% of Classroom Teachers and 26.7% of Others said that they had been in DEN for six years. Grade levels worked with Respondents also answered questions about the grade levels that they have worked with, both over the course of their careers, and while participating on the Leadership Council. They were given 4 specific grade ranges to choose from, plus the choice to select “other”. Respondents were allowed to pick multiple grade ranges. The majority of respondents worked with elementary school children. 80.0%   91.8% of Classroom Teachers 60.0%   selected only one of the grade ranges 40.0%   presented in the question. The other 20.0%   0.0%   professions frequently selected Pre-­‐k  to   Other  (please   multiple grade ranges. 1st  -­‐  5th   6th  -­‐  8th   9th  -­‐  12th   kindergarten   specify)   Series1   61.5%   45.9%   40.3%   32.0%   16.5%   Figure 5: Grade level respondents are currently working with. (n=231*)   Of the 38 people who answered “Other”, the majority (42.1%) said that they taught teachers or staff in some way, through in-service training, professional development, or recertification. An additional 26.3% explained that they worked in some form of Higher Education. 5    
  • 10.
    Respondents also answeredquestions about which grade levels they worked with while part of the Leadership Council and which grade levels they worked with most over the course of their careers. Both questions yielded results very similar to those shown in Figure 5. 80.0%   70.0%   60.0%   60.0%   50.0%   40.0%   40.0%   30.0%   20.0%   20.0%   10.0%   0.0%   0.0%   Pre-­‐k  to   Other   Pre-­‐k  to   Other   1st  -­‐  5th   6th  -­‐  8th   kindergart 9th  -­‐  12th   (please   1st  -­‐  5th   6th  -­‐  8th   9th  -­‐  12th   kindergart (please   en   specify)   en   specify)   64.1%   47.6%   38.1%   33.3%   13.4%   61.5%   39.4%   22.9%   18.2%   5.6%   Figure 6: Which grades have you worked with while Figure 7: Which grades have you worked with most participating in the Leadership Council? (n=231*) over the course of your career? (n=231*) Additionally, respondents were asked how long they had worked with the grade level they had taught the most, and once again the answer pointed to the high experience level of DEN LC members. Over one- quarter of respondents (28.6%) had worked with a particular grade level for over fifteen years. When looking at this question by 66   30.0%   profession, Classroom Teachers 25.0%   showed a very similar trend to the 20.0%   43   41   group as a whole, with 29.4% 38   working 15 years or more (largest 15.0%   26   number). Technology Integration 10.0%   16   Specialists were a little different, 5.0%   with only 15.9% answering “Over 1   0.0%   fifteen” only and over one-fourth Less  than   One  to   Seven  to   Ten  to   Thirteen  to   Over   one     three   Four  to  six   nine     twelve   fiYeen   fiYeen   (26.1%) answering “Four to six.” 0.4%   6.9%   18.6%   17.7%   16.5%   11.3%   28.6%   Nineteen percent (19.3%) answered “Ten to twelve”. Figure 8: How many years have you worked with the grade level you have taught the most? (n=231) Subjects taught (Classroom Teachers only) Finally, all respondents who selected “Classroom Teachers” (n=85) in answer to Question 1 were asked 3 additional questions about which subjects they taught. All three questions yielded similar results. The subjects taught by the majority of teachers in almost equal distribution were Science, English/Language Arts and Math. 6    
  • 11.
    80.0%   60.0%   40.0%   20.0%   0.0%   English,   Social   Other   Language   Studies,   Computer   Music,  the   Special   Physical   Science   Math   (please   Arts,   History,   Science   Arts   Educa[on   Educa[on   specify)   Reading   Civics   Series1   68.2%   60.0%   55.3%   49.4%   29.4%   10.6%   10.6%   7.1%   12.9%   Figure 9: Check the subjects that you are currently teaching? (n=85*) 80.0%   60.0%   40.0%   20.0%   0.0%   English,   Social   Computer   Music,  the   Special   Physical   Other  (please   Science   Language   Math   Studies,   Science   Arts   Educa[on   Educa[on   specify)   Arts,  Reading   History,  Civics   65.9%   67.1%   64.7%   49.4%   24.7%   10.6%   11.8%   8.2%   7.1%     Figure 10: Check the subjects you have taught most over your career. (n=85*) 80.0%   60.0%   40.0%   20.0%   0.0%   English,   Social   Computer   Music,  the   Special   Physical   Other  (please   Science   Language   Math   Studies,   Science   Arts   Educa[on   Educa[on   specify)   Arts,  Reading   History,  Civics   67.1%   63.5%   57.6%   49.4%   30.6%   9.4%   12.9%   8.2%   14.1%   Figure 11: Check the subject(s) you have taught while participating on the Leadership Council. (n=85*) About half as many participants answered “other” to the question “Check the subjects that you have taught most over the course of your career” than did to the two questions that asked about more recent teaching. Almost all “other” descriptions involved some kind of technology, including desktop publishing, digital citizenship, industrial engineering, and technology and engineering. Summary of demographics and background info. The DEN Leadership Council members who participated in this survey generally came from a diversified set of professions, states, school types, and worked with a wide range of grade levels. They had a wide range of experience, from less than one year to over fifteen years working in the field. They worked in numerous subject areas, which included Science, Math, English, Social Studies, Computer Science, Music and the Arts, Physical Education, and others. 7    
  • 12.
    Although the LeadershipCouncil members were diverse, they shared certain specific demographic characteristics. The majority of the respondents were either Classroom Teachers or Technology Integration Specialists, and a smaller, but significant number, worked in the library, with library media, or other forms of technology coordination and integration. Respondents to this survey were mostly White and worked in suburban public school settings. Respondents generally had a wealth of work experience, with over half working in their field for ten years or more. A large majority of respondents worked with students in grades 1-8, with almost two- thirds of respondents saying they worked with students in grades 1-5. The Classroom Teachers who completed this survey generally taught the core subjects (Science, Math, English, Social Studies) and Computer Science. Finally, most of the respondents were very involved in the DEN community. Most had been in DEN for the entire 6 years of its existence, and two-thirds had been serving on the Leadership Council for two years or more. Participation in DEN Respondents answered between 11 and 14 questions about how they used the different resources, services, and products offered by DEN. Approximately half of the questions addressed respondents’ use of social media, both in general, and to interact with DEN. Three questions addressed the Weekly Update, two questions addressed respondents’ use of DEN webinars, and three questions addressed respondents’ use of the Educator Resource Library. Two of the questions asked in this section were open-response questions, and the rest were forced-choice questions. Use of social media Respondents were asked between four and six questions about social media (depending on how they answered.) The first question was about general social media usage: “How often do you use social media such as Facebook or LinkedIn in your daily life?” They were given six answer options. (see figure 12) The majority of DEN members (71.2%) answered that they used Two  or  three   social media on a daily basis. [mes  a   Weekly,   These overall numbers were fairly 19.2%   month,  4.4%   Once  a   consistent across professions. Daily,  71.2%   month,  0.9%   Classroom Teachers (n=85) were among the most active users with Less  than   Never,  2.6%   once  a   76.5% saying they used social month,  1.7%   media “daily”.   Figure 12: Use of social media in general. (n=229) Figure 12: Use of social media in general. (n=229) 8    
  • 13.
    The least activeusers of social media in general were Curriculum Specialists (n=4). One Curriculum Specialist answered “never” and another answered, “two or three times a month”. The other two Curriculum Specialists did say that they used social media “daily.” Although the very small sample size makes it difficult to claim that less use of social media is a trend among Curriculum Specialists, it is still notable because so few respondents in general answered either “never” or “two or three times a month.” Next, the respondents who did use social media were asked: “Which form of social media do you use most often?” They were given a list of six choices to select from. (see figure 13) Of the 11 respondents who gave LinkedIn,   an “Other” answer, 5 respondents 0.4%   Edmodo,  2.7%   (45.5%) said they used “Plurk” Other  (please   most often. This rate of response Facebook,   specify),  4.9%   is comparable to Edmodo. 64.1%   Twicer,   LinkedIn, on the other hand, was 21.5%   only used by one respondent. Blogs,   11.2%   Figure 13: Most used forms of social media. (n=223*) 80.0%   Figure 14 shows the most 70.0%   popular forms of social 60.0%   media by daily users 50.0%   (n=163), weekly users 40.0%   (n=44), and less frequent 30.0%   users (n=16). 20.0%   10.0%   Those social media users 0.0%   who use less frequently Facebook   Twicer   Blogs   Edmodo   Plurk   LinkedIn   are more prone to use Daily  users  n=165   69.7%   22.4%   4.2%   2.4%   1.2%   0.0%   Weekly  users  n=46   50.0%   19.6%   21.7%   2.2%   4.3%   2.2%   blogs than they are other Less  frequent  users  n=17   29.4%   11.8%   47.1%   5.9%   5.9%   0.0%   forms of social media.   Figure 14: Most popular forms of social media, by frequency of general social media usage. (n=223) All respondents were then asked: “How often do you interact with DEN through social media such as Facebook or LinkedIn?” They were given six answer options to choose from. (see figure 15) 9    
  • 14.
    Two  or  three   Weekly,   27.1%   [mes  a   Almost 70% of respondents use social month,  10.9%   media to interact with DEN at least Daily,  22.7%   once a month and almost 50% use Once  a   social media to interact with DEN at month,  9.2%   Never,   least once a week. 14.0%   Less  than   once  a   month,  16.2%   Figure 15: Frequency of use of social media to interact with DEN. (n=229) The most popular answer was “weekly” with over one quarter of respondents giving that response. By profession, Technology Integration Specialists (n=86) were slightly more likely to interact with DEN via social media. 29.1% of Technology Integration Specialists said they interacted with DEN via social media “daily”. (Compared to 17.6% of Classroom Teachers (n=85), 22.2% of Administrators (n=9), 22.2% of Others (n=45), and 0% of Curriculum Specialists (n=4)) Next, respondents who said they did use social media to interact with DEN (n=197) were then asked, “which form of social media do you use most to interact with DEN?” They were given six answer options. (see figure 16) Facebook,   Blogs were the most popular answer for 32.0%   LinkedIn,  0.0%   Edmodo,  2.0%   social media to interact with DEN, with Other,  8.6%   39.1% of respondents using blogs the Blogs,  39.1%   most. By comparison, only 11.2% of Twicer,  24.4%   general social media users said they use blogs the most. Figure 16: Social media to interact with DEN. N=197* Although over two-thirds of general social media users said that Facebook was the form of social media they used the most, only one-third of respondents who use social media to interact with DEN use Facebook the most. 17 respondents answered “other” to this question: • Email: 5 respondents (29.4%) 10    
  • 15.
    Google Groups: 5 respondents (29.4%) • Plurk: 4 respondents (23.5%) • Wikis: 2 (11.8%) • Skype, Google Docs, and Facebook: 1 respondent each (5.9%) (The total is more than 100% because a few respondents mentioned more than one of the above.) Next, respondents were also asked to “Please score each of the following in terms of its usefulness to you in participating in DEN”. They were given a list of five forms of social media. For each form of social media, they were given the option to give a score between one (not at all useful) and five (very useful.)4 Table 2 Ratings of how useful social media is in terms of interacting with DEN. Social media used to Useful Neutral Not useful Average rating interact with DEN. Blogs (n=225) 88.0% 9.3% 2.7% 4.38 Facebook (n=224) 62.0% 28.6% 9.4% 3.78 Twitter (n=224) 60.3% 27.2% 12.5% 3.71 Edmodo (n=221) 40.7% 39.4% 19.9% 3.21 LinkedIn (n=217) 17.5% 51.6% 30.9% 2.68 When it came to participating in DEN, respondents’ order of preference was blogs, Facebook, and then Twitter. All three were rated useful by more than 60% of respondents. LinkedIn was the only form of social media that respondents did not find useful. At best, most respondents were neutral about LinkedIn. Finally, all respondents were asked to give an open response to the question “Please explain why you do or do not interact with DEN through Social Media.” Of the 226 respondents who answered this question, the majority (65.0%) gave an answer to explain why they did use social media to interact with DEN, and approximately one-third (34%) gave an answer to explain why they did not use social media to interact with DEN. Two respondents (0.9%) gave an answer that was a mix of reasons for using and reasons for not using. Reasons for using social media to interact with DEN A total of 147 participants provided reasons for using social media to interact with DEN. Reasons were evenly distributed among four main categories5. The participants stated that social media provides: • A convenient and easy tool                                                                                                                         4  The  full  breakdown  of  these  scores  is  included  in  Appendix  A.   5  A  main  category  was  one  that  was  mentioned  by  at  least  10%  of  the  respondent  subgroup.       11    
  • 16.
    Current up-to-date information • An effective vehicle to initiate and maintain collaborations and interactions with one another • An effective vehicle for resource-sharing Some respondents mentioned more than one of these categories when describing why they use social media to interact with DEN. Over one-fourth (29.3%) of these respondents stated that they use social media to connect with DEN because it is easy and quick. o “Quick and easy. & part of my normal routine” o “Once you sign up on Social Media sites and connect with other DEN members, it is so simple. Their messages/posts are available any time you are on that social media site.” o “It is an easy way to update on ALL the recent activities, current trends and educational opportunities. I read DEN blogs from several different states.” Thirty-eight respondents (25.9%) said that social media is a great way to collaborate, stay connected, and learn from their colleagues. These responses focused on the professional development that grew out of these interactions. o “The DEN is a huge part of my professional learning network. We share ideas, collaborate on projects and support each other in our challenges.” o “Social media allows me to bring the DEN network to me. It is an easy way for me to gain valuable resources from other like-minded peers in a very timely manner anytime, anywhere.” o “Asking questions and answering questions from others helps us become more than the sum of our parts.” Thirty-three respondents (22.4%) said that social media is the best way to “keep up” with what is happening in DEN. o “To check up on what’s happening, get current information” o “It is called FOMO - Fear of missing out.” o “It also helps me learn about the latest technology components that can enrich my classroom.” Twenty-five respondents (27.0%) spoke of social media as a way to share resources and ideas. o “Social media and web tools allow to me to share resources and learn about resources, webinars, and participate in conversations with DEN members or DEN LC members.” o “There is never a time that I am on Twitter and don't get more than a handful of ideas, tips and tricks or great websites to share.” 12    
  • 17.
    Other reasons forusing social media to interact with DEN included the promotion and facilitation of new friendships, and seeing the human side of colleagues. Reasons for not using social media to interact with DEN Seventy-seven participants provided reasons for NOT using social media to interact with DEN. The reasons were distributed among four main categories. The participants stated that they: • Didn’t see a need and thought social media was distracting (n=29). A number of these respondents considered social media appropriate for personal use, but not professional use. o “Interaction on social media is superficial and does not allow for in-depth relationship building and communication.” • Didn’t have time to spend on social media (n=15) o “I am too busy planning and preparing for the following day.” • Were not aware of DEN’s presence on social media sites such as Facebook and Twitter (n=13) o “Is there a DEN presence on Facebook?” • Had access issues due to district-level firewalls (n=8) o “Facebook and LinkedIn are both blocked at school.” The remaining respondents gave a variety of reasons for not interacting with DEN via social media. Most gave a specific explanation of why they used one form of social media rather than another. A few explained that they were just now becoming familiar with social media in general so were “slow starters”, and two others simply could not explain why they did not use social media to interact with DEN. In summary, the respondents to this survey were generally very active social media users, with over two- thirds saying that, in general, they used social media “daily”. When intending to interact with DEN specifically, most respondents used social media on a weekly basis. Of all the forms of social media, Facebook was the most popular form for respondents in their day-to-day life, with approximately two- thirds saying that Facebook is the form of social media that they use the most. Interestingly, when it came to interacting with DEN specifically, respondents were more likely to turn to blogs, although Facebook remained the second most popular option. Almost three-fourths of respondents used either blogs or Facebook to interact with DEN. The only form of social media that was considered “not useful” for interacting with DEN was LinkedIn. In addition, numerous respondents wrote in “Plurk” as a form of social media that they commonly use to interact with DEN. This was not a platform that was considered when designing the survey. Reasons for using social media to interact with DEN ranged from being “convenient and easy”, to being “good for getting up-to-date information”, to “a great way to connect with like-minded educators”, to “an effective way to share resources.” Those respondents who did not use social media to interact with DEN said they did not do so primarily because they “didn’t see the need” had “access issues”, or simply “didn’t know” that DEN had an active social media presence. 13    
  • 18.
    The Weekly Update Respondentswere then asked questions about specific features of the DEN website. To begin, all respondents were asked about the Weekly Update, “How often do you read the Weekly Update?” They were given six choices (see figure 17). Most (76.1%) of the respondents A  few  [mes  a   read the Weekly Update month,  18.6%   Once  a   optimally, every week. Only three month,  4.0%   of the 226 respondents (1.3%) Once  every  few   Once  a  year,   months,  0.4%   0.0%   reported reading the Update less Every  week,   76.1%   than once a month. Never,  0.9%   Figure 17: Frequency with which respondents read the Weekly Update. (n=226) The Technology Integration Specialists (n=86) read the Weekly Update the most; 80.2% reported that they read the Weekly Update every week. All three respondents who read the Weekly Update less than once a month were Classroom Teachers (n=82). This same group also had the second lowest percentage to read the Update on a weekly basis; 73.2% reported that they read the Weekly Update every week. The only profession with a lower rate of weekly readership was Curriculum Specialists (n=4); 50% reported reading the Update weekly, although this percentage is a little misleading because of the small sample size. (The other two Curriculum Specialists reported reading the Update a few times a month.) Those respondents who reported that they did, in fact, read the Weekly Update were then asked to “Put the following reasons for reading the Weekly Update in the order of their relevance to you, (5 being the most relevant to you, 1 being the least relevant to you).” Two hundred and twenty-two respondents answered this question. (note: respondents had to rate only one of the choices to move on in the survey.) 14    
  • 19.
    TABLE 3 Ranking ofreasons for reading the Weekly Update. (n=222)6 Ranking Number of Reasons for Reading Weekly Update 1 2 3 4 5 Average Respondents Acquiring information about online events 8 26 32 57 59 3.73 182 Finding information about free resources from Discovery Education 16 32 44 46 58 3.50 196 Obtaining information about in person events 40 32 44 35 37 2.98 188 Getting Discovery Education product updates 69 41 33 37 38 2.70 218 Receiving promotions 45 50 42 34 16 2.60 187 “Acquiring information about in-person events” had both the highest average ranking (3.73) and was most consistently chosen as the most important reason for reading the Weekly Update. “Getting Discovery Education product updates” was the answer rated by the largest number of respondents (218). It was also ranked by over one-third of those respondents as being the least relevant reason for reading the Weekly Update. The reason with the lowest average ranking was “receiving promotions” Slightly more than half (51%) of the 187 people who commented on the promotions ranked the reason as being a low incentive for reading the update. All respondents were then asked, “What would make the Weekly Update more useful to you?” Two hundred-twenty-four (224) people answered this question. Almost two-thirds (63.4%) could offer no suggestion to make the Weekly Update more useful. Of those, 35 said that they simply could not think of anything to add. The other 107 respondents made a point of saying that the Update was great as is: o ”They don't bombard me with too much information. Perhaps they understand we are all professionals and educators with many responsibilities.” o “I use it every week and there is always something that applies to what I do. I think it reaches all audience readers.” o “I like being able to access information in one stop even if I don't have time during the week to look at the blog. I know that all the important issues will be on the update.” Of the remaining 82 respondents over one-third provided a particular suggestions for improving the Weekly Update. Twenty respondents (24.4% of respondents who offered some kind of suggestion) wanted the Update to include some kind of “quick tip”:                                                                                                                         6  Although  222  respondents  answered  this  question  overall,  most  individuals  only  scored  some  of  the  reasons  for  reading   the  Weekly  Update,  thus  the  lower  numbers  in  the  column  “Number  of  Respondents”.  That  column  contains  the  response   rate  for  each  reason.           15    
  • 20.
    o “How aboutadding one specific tip about some aspect of the Discovery resources?” o “Perhaps a link to one short (2-3 min) how-to or I-didn't-know-you-could-do-that-with- Discovery video tutorial.” o “Tech Tip of the week.” Many of these requests for a “quick tip” suggested including one grounded example, such as a lesson plan, or video of someone using the tip in a classroom.7 Other types of resources that respondents would like to see in the Weekly Update included: • Resources directly related to core classroom content. • A calendar of what is going on in the DEN. • Links specifically to resources that other educators have shared. • New videos. Seven respondents wanted the Weekly Update to include some sort of information related to local events. o “If there was a section for specific state news that might be helpful and promote more state, regional, and local events.” Six respondents thought the Update should include an easily searchable archive: o “A central location where updates are archived and easily searchable would be great.” o “It would be great to be able to access an archive of weekly updates.” Other suggestions for things to add to the Update included two requests to make it shorter and less dense, a request for it to come earlier in the week, a request for more opportunities to participate more actively in the DEN in some way, a request for an audio version, and a request for a reminder to be sent out that a new Update is posted. In summary, The Weekly Update was extremely popular. Nearly all respondents (98.7%) read it at least once a month, and three-fourths of respondents read it as frequently as was possible, weekly. Generally, respondents liked the Update for information about events and free resources from Discovery, and were less interested in the promotions and Discovery product information. When asked for ways to improve the Weekly Update, nearly two-thirds of respondents (63.4%) had no suggestion, with most explaining that the Update couldn’t be better. The remaining respondents had a number of suggestions to improve the Weekly Update. Many wanted a quick “tip”, “link”, or “lesson” included as a regular feature in the Update every week: a grounded, easy-to-use resource that could be put into action immediately. Other respondents wanted more information about local events and issues. Multiple respondents wanted the Weekly Update to have an easily accessible online archive of past                                                                                                                         7  A  complete  list  of  “quick  tips”  suggestions  is  provided  in  Appendix  B.   16    
  • 21.
    postings so thatDEN members could quickly search and retrieve useful information for “just-in-time” professional development. Webinars Next, all respondents were then asked either 1 or 2 questions about DEN webinars. The first question, asked of all respondents, was “How often do you attend DEN webinars?” They were given five choices (see figure 18). A large majority, 90.1%, attended Once  a   multiple DEN webinars each year, with A  few  [mes  a   year,  5.8%   year,  52.2%   52.2% saying they attended “a few times Never,  3.6%   a year” and 37.9% saying they attend “at At  least   least monthly”. Only one respondent weekly,  0.4%   At  least   (0.4%) said that she attended DEN monthly,   webinars “at least weekly.” 8 never 37.9%   attended at all. Figure 18: How often respondents attend DEN webinars. (n=224) The 215 respondents who said they had attended at least some webinars were then asked to “Please score the following types of DEN webinars in terms of their usefulness to you:” They were provided a five point rating scale with 5 being “extremely useful” and 1 being “not at all useful.” In Table 4 we see that all webinars have a positive average rating of a 3.9 or more. Virtual Conferences had the highest average rating overall (4.58, Virtual Conferences also had the largest number of respondents (134) who gave it the highest score of 5. The most common score for all types of webinars was either a 4 or a 5. 17    
  • 22.
    TABLE 4 Ratings ofdifferent types of webinars. (n=215)8 I have Rating never 1- Average 2- 5- attended Not 3- 4- (does not Response Number of Type of webinar Not Very this type useful Neutral Useful count Count Respondents useful useful of at all “never webinar attended”) Virtual Conferences 13 0 2 12 54 134 4.58 215 202 (e.g. DEN SciCon) Classroom Integration (e.g. 50 ways to use 11 0 1 10 79 114 4.50 215 204 Discovery Education Streaming) Product Overview (e.g. Discovery 15 3 5 24 97 71 4.14 215 200 Education Streaming Walkthrough) Thought Leadership (e.g. Ed-Tech 43 2 5 31 74 60 4.08 215 172 Connect) Student Centered (e.g. Spotlight on the Gulf 38 4 10 35 75 53 3.92 215 177 with Philippe Cousteau) Table 5 shows the percentage of non-attendance for each webinar, and Table 6 shows how each type of webinar was rated, in terms of its general usefulness. 215 respondents answered this question, but they only had to rate one webinar to move on in the survey. TABLE 5 TABLE 6 Percentage of Non-attendance by Webinar Type Positive vs. Negative Usefulness Ratings by Webinar Type. I have never attended Positive Negative Webinars Webinars Neutral this type of webinar Rating rating Thought Leadership (n=172) 20.0% Classroom 94.6% 0.5% 4.9% Integration Student Centered (n=177) 17.7% Virtual Conferences 93.1% 1.0% 5.9% Product Overview (n=200) 7.0% Product Overview 84.0% 4.0% 12.0% Virtual Conferences (n=202) 6.0% Thought Leadership 77.9% 4.1% 18.0% Classroom Integration (n=204) 5.1% Student Centered 72.3% 7.9% 19.8%                                                                                                                         8  Most  respondents  scored  the  usefulness  of  more  than  one  webinar.      A  few,  however,  did  not.    See  the  number  of   responses  for  each  type  of  webinar  to  determine  the  response  rate  for  each.       18    
  • 23.
    Thought Leadership andStudent Centered webinars had both high percentages of non-attendance and negative ratings. (It is important to note, however, that far fewer participants rated these two webinars overall as well) Conversely, the webinars with the highest attendance and ratings were those on classroom integration and virtual conferences. Resource Library Respondents were next asked 3 questions about the Educator Resource Library. First, all respondents were asked, “Approximately how many resources do you upload to the Educator Resources section of the website per year?” (shown in figure 19) and “Approximately how may resources do you download from the Educator Resources section of the website per year?” (shown in figure 20.) 46.6%   50.0%   50.0%   40.4%   36.3%   40.0%   40.0%   30.0%   30.0%   23.8%   20.0%   20.0%   15.7%   10.3%   10.3%   9.9%   10.0%   5.8%   10.0%   0.9%   0.0%   0.0%   None   1  to  3   4  to  6   7  to  9   10  or   None   1  to  3   4  to  6   7  to  9   10  or   more   more   Figure 19: Resource Library, uploads per year Figure 20: Resource Library, downloads per year (n=223) (n=223) Overall, DEN participants tended to download resources with greater regularity than they uploaded them. That said, there was little difference in the most frequent tendency with which DEN participants tended to upload and download resources. They tended to do both once or twice a year. Interestingly, DEN participants were three times more likely to never have uploaded resources than never have downloaded them. Over one-third of all respondents (36.3%) never upload resources to the Educator Resources Library. All respondents were then asked, “Please score each of the following resources from the Educator Resources section in terms of its usefulness to you.” TABLE 7 Usefulness of Resources in the Educator Resource Library. (n=223) 1 Not at 2 Not 3 4 5 Very Rating Response Educator Resource Library Resources all useful useful Neutral Useful useful Average Count Archived webinars 2 4 20 102 95 4.27 223 Multimedia presentations (e.g Keynote) 1 3 32 96 90 4.22 222 Project samples 1 1 49 92 79 4.11 222 Lesson plans 3 12 52 91 64 3.91 222 19    
  • 24.
    Respondents found theArchived webinars, Multimedia Presentations, and Project Samples to be useful. Their average ratings fell between “useful” and “very useful”. Lesson Plans received a slightly lower average rating, between “neutral” and “useful.” Table 8 shows the overall positive and negative ratings of each type of resource. TABLE 8 Positive vs. negative ratings of Resource Library resources. Educators Resource Library Positive Negative Neutral   Resources Rating Rating Archived webinars (n=223) 88.3% 9.0% 2.7% Multimedia presentations (n=222) 83.8% 14.4% 1.8% Project samples (n=222) 77.0% 22.1% 0.9% Lesson plans (n=222) 69.8% 23.4% 6.8% Although it would seem likely that Lesson plans might be rated lower because they might be more useful to one profession than another, this did not seem to be the case, as can be seen in Table 9 TABLE 9 Comparative ratings of Resources, by profession. Tech Curriculum Admin- Educators Resource Integration Teachers Others Specialists istrators Library Resources Specialists n=82 n=42 n=4 n=9 n=86 Archived webinars 4.31 4.26 4.25 3.89 4.31 Multimedia presentations 4.28 4.23 4.25 3.67 4.19 Project samples 4.16 4.04 4.25 4.22 4.12 Lesson plans 3.97 3.86 4.25 3.78 3.86 Lesson plans were consistently rated with the lowest average ratings across all the professions. Additionally, Administrators consistently gave lower scores to resources than members of other professions did (with the exception of Project Samples.) It is difficult to draw clear conclusions from this due to the small Administrator sample size (n=9). However, Curriculum Specialists did not deviate from the general trend, and they have an even smaller sample size (n=4). It is worth considering doing further study to see if the resources offered by DEN are generally less helpful to Administrators than they are to other professionals. In summary, the members of the Leadership Council were very active users of DEN webinars and the DEN Educator’s Resource Library. The vast majority of respondents (90.1%) attended multiple DEN 20    
  • 25.
    webinars every year.Every type of DEN webinar that was mentioned in the survey received a positive rating, although two types of webinars, Thought Leadership and Student Centered, received lower than average ratings and higher than average rates of non-attendance. Respondents were generally active users of the Educator’s Resource Library, although they were more likely to download resources than upload them. Over one-third of the Leadership Council respondents said that they “never” uploaded resources to the Library. All of the resources in the Library were rated as being “useful”, although Lesson plans were generally considered to be less useful than other resources. Summary of participation in DEN. In looking at the overall results of how respondents from the Leadership Council participated in DEN, it became clear that these respondents were very active users of all that DEN had to offer: social media connections, the Weekly Update, webinars, and the Educator Resource Library. The Weekly Update seemed to be the most popular point of form of interaction, with three-fourths of respondents reading the Update as frequently as was possible. Only one respondent out of 226 had never read the Weekly Update. Respondents looked to the Weekly Update and social media as a way to keep informed on happenings in the DEN community. The participants were very involved with DEN through social media. Over two-thirds interacted with DEN through some form of social media at least once a month and over half interacted with DEN via this medium at least once a week. Blogs, Facebook, and Twitter were the preferred forms of social interaction with DEN. Daily users were more likely to use Facebook, and weekly users were more likely to use blogs. Professional Development The next section of the survey posed between 5 and 6 questions about professional development (PD To begin, respondents were asked to define their conception of professional development: “The Discovery Educators Network is trying to ensure that the professional development opportunities it offers are relevant to the field. To support this effort, please explain what you think is most essential for the professional growth of a (teacher/technology integration specialist/curriculum specialist/administrator/other.) (Please include at least two ideas.)” Some respondents were confused about the nature of the question, thinking that it was asking about professional development in relation to the DEN, as opposed to the topic in general. Most respondents listed multiple examples of essential components to professional development, and a number of clear themes emerged. At least 10% of the respondents discussed the importance of one or more of the following: • Helping to integrate technology • Providing access to practical resources 21    
  • 26.
    Networking with colleagues • Keeping up with current trends Helping to Integrate Technology The response mentioned most frequently, by almost one-third of the respondents (32.9%), referenced the importance of facilitating the integration of technology into the classroom. For this group of educators, an increased understanding of technology implementation was considered a key part of professional development. This interest in learning how to integrate technology was present across job types, and approximately one-third of respondents from each profession mentioned this as a crucial part of professional development.9 Their comments included: o “Learning how to integrate technology such as Discovery into daily lessons.” o “The integration of technology use in the classroom to expand and reignite students interest in the ‘textbook’ goals and standards.” o “it has not only elevated my teaching by modeling best practices but it also opened a world of dynamic and 'ahead of the curve' technologies that my teachers and students are craving.” o “When I first became a member, I barely knew how to check my school email. I had created one powerpoint in my professional lifetime, and had bungled its use badly at a conference. I wasn't really excited about trying to integrate technology any further! Now, I use technology every day with my students. I create lessons that integrate media and provide instruction for my students in how to use internet resources and create projects using media.” Providing Access to Practical Resources10 Almost one-third of the respondents (32.4%) also stated that professional development was dependent upon the provision of good resources. They explained that materials needed to be easy to use, accessible, and of low cost. The respondents also felt that grounded examples of resource implementation were essential. They wrote: o “-Examples of good teaching -Samples of good lesson plans/activities” o “…having hands-on demos and seeing how things are being used in the classroom is important. It is more valuable to me to see an actual teacher in action rather than having someone who is not invested in the learning and the outcomes.” o “There are too many Web2 sites out there and DENers share not only good options that they found, but often share student example as well. When trying to push VoiceThreads here, I was able to share actual student products and even had students here participate in a remote classroom's experience”                                                                                                                         9  The  one  exception  to  this  trend  was  Curriculum  Specialists  (n=4).  50%  of  respondents  who  identified  with  this  job,   although  this  may  be  due  to  the  small  sample  size  of  this  group.   10  It is important to note that respondents who mentioned access to resources frequently seemed to be talking about the benefit of the resources that the DEN currently offers, rather than resources in general.   22    
  • 27.
    Twenty-three (23) ofthese respondents specifically mentioned having access to resources that are essentially “ready to go” into use immediately. o “In this current environment that is very anti-teacher, we need resources that are "classroom ready" and easy to implement.” o “By giving me practical lessons that I can use right away.” Networking with colleagues Of the 222 respondents who answered this question, 56 (25.2%) said that a key to professional development was having a “network of colleagues” with whom to connect and learn. o “The ability to connect with others in the same professional position to share ideas and strategies. We all can learn so much from each other, and it helps immensely to have such a great collective brain to connect to when I need help or ideas.” o “A supportive PLN. That is the greatest thing the DEN offers me...the assurance that I'm not alone, and a resource for other teachers.” o “Being able to connect with other educators, not just within my district, but all over the world has become invaluable to me.” Technology Integration Specialists (n=85) were the group that gave this answer the most, with 31.8% saying this was important. They were closely followed by Classroom Teachers (n=82) with 28.0% saying this was important and Administrators (n=9) with 22.2% saying this was important. Only 9.5% of Others (n=42) thought that a network of colleagues was key to professional development, and no curriculum specialist gave an answer that suggested having a network of colleagues was crucial to professional development. Of the 56 respondents who mentioned a “network of colleagues”, 21 specifically mentioned the value of “in-person events”. o “I think the most essential part of promoting our growth is the in-person events where we can meet and work with other like-minded people around the country.” o “I love the in-person events because it gives me a chance to form relationships with other educators” Over half of the respondents giving this answer were Technology Integration Specialists. Twelve members of that group mentioned in-person events. Five Classroom Teachers, three Others, one Administrator, and no Curriculum Specialists mentioned this as an important part of professional development. Keeping Up With Current Trends 23    
  • 28.
    53 respondents (23.9%)mentioned that “keeping up with current trends” in education was key to professional development. Although there were a few different ways that respondents defined “current trends” (resources, best practices, legislation) 42 of the 53 respondents specifically said that keeping up with trends in educational technology was a key part of professional development. It was considered important by all professional groups, with Technology Integration Specialists mentioning it the most (28.2%) and Classroom Teachers mentioning it the least (18.3%). o “I think it's essential for teachers to be up to date on the latest trends/technologies available.” o “New ideas - particularly in the area of technology since it is constantly evolving.”. o “I feel like I am always on the cutting edge of educational technology through the contacts and experiences I have had with discovery.” Finally, other professional development needs mentioned by respondents included a need to focus on particular types of content, including STEM and core subjects (18 respondents, 8.1%). A few also mentioned a general need for educators to keep seeking out new opportunities to learn (16 respondents, 7.2%). The open ended question on professional development was followed by a question that asked the respondents to “please indicate how much or how little DEN has contributed to your professional growth?” A five point scale was provided with 5 being “tremendously” and 1 “being not at all.” Almost everyone, (89.2%) answered either “tremendously” or “very much.” Most (68.5%) Tremendously Very  much,   ,  68.5%   20.7%   provided the highest possible response “tremendously. No respondent said that DEN had not Somewhat,   contributed to their professional 8.6%   Not  at  all,   growth at all, and only 5 0.0%   licle,   Very   2.3%   respondents answered “very little”     Figure 21: Please indicate how much or how little DEN has contributed to your professional growth. (n=222)   All respondents were then asked, “In what ways has your participation in the DEN community supported your professional growth? Please provide specific examples.” 24    
  • 29.
    Although many newideas and trends surfaced, many responses to this question mirrored those provided in defining professional development in general. Participation in DEN supported professional growth primarily through: • Building a network of colleagues • Learning how to integrate technology • Enriching practice with new ideas • Helping members keep up with current trends Building a network of colleagues By far the most popular single response was given by 110 of 213 participants (51.6%). They said that the DEN supported their professional growth by providing a “network of colleagues.” Respondents mentioned that this network provided access to “like minded individuals” who provide support, ideas, and answers to questions. It gave them a place where they felt they belonged and fit in. They reported that these colleagues challenged them and helped them learn and grow. Examples of their comments included: o “This connection through Social Media has by far been the best professional development I have had as a teacher in my 22 years of teacher.” o “It has enabled me to look outside of my classroom and find a community of other teachers sharing the same struggles in new and innovative ways.” o “I literally have access to HUNDREDS of the best tech educators in the world. If I have a question, I can crowd source for a solution or idea.” o “I have struggled with being a "geek" forever and to this day still get fussed at for wanting to try to teach and use new things. Through the DEN I finally feel like I fit in. The very first time that I attended a DEN event, I cried.” Integrating Technology Forty-five respondents (21.1%) mentioned that DEN helped them better use technology in their practice, integrate technology into the classroom, and fully explore what technology could bring to their work. They talked about how this new understanding of technology had a transformative effect on their professional lives. o “Almost everything I have learned about technology and web 2.0 resources, I have learned from and through the DEN.” o “I feel like I am always on the cutting edge of educational technology through the contacts and experiences I have had with discovery.” o “Many colleagues feel comfortable approaching me for information about technology use because they know that I was recently a non-user! I give all of the credit for my change to my participation in the DEN community.” 25    
  • 30.
    Enriching practice withnew ideas Thirty-two respondents (15.0%) explained that the DEN had enriched and expanded the work that they were already doing by giving them new ways to look at old materials and lessons and new ideas to use with students. Because of exposure to DEN, these participants explained that they were able to approach their work with fresh thinking and new approaches. o “What better way to discuss global climate with my students then to see and speak to a scientist who studies polar bears (webinar)?” o “I've been validated and encouraged to try new things.” o “The DEN has changed the way I approach education” Helping members keep up with current trends Although fewer respondents mentioned “keeping up with current trends” in answer to this question (15.5%) as compared to those (23.9%) who responded in kind to the more general question on professional development, 33 respondents did appreciate that DEN provided this service. These participants felt that had greatly raised their awareness of current educational thinking, new trends, and fresh ideas. o “The DEN community has been a source of new ideas, new teaching methods…” o “Because of the DEN community, I have always believed I was a year or two ahead of what was coming. With the DEN, I was already there.” Other comments were each made by fewer than 10% of the respondents. They included the following: • Increased confidence (n=18). Respondents explained that DEN had helped them learn to believe in themselves and their own abilities. 9 respondents (4.2%) said that DEN had helped them develop as leaders. o “I have been comfortable to take risks and challenge myself to try something new with my students.” • Leadership development (n=9). Respondents said that DEN had helped them become leaders in their districts and schools. • Finally, throughout the answer to this question were many mentions of the inspiration, motivation that DEN has provided members, and the love that the members have for the organization. o “Personally and professionally, I am more excited about learning than I ever have been. I attribute it to the DEN.” 26    
  • 31.
    o “DEN membersprovide inspiration & motivation for me to continue on my own path of learning & discovery.” o “I really love you guys.” Only 2 respondents (0.9%) said that the DEN had provided little or no growth. One said because he had not participated enough, and the other simply said “it has not” in answer to this question. Both of these respondents answered “very little” to the question of how much DEN had contributed to their professional growth. Next, respondents were asked: “How could DEN better support your professional growth?” As was the case when respondents were asked how to improve the Weekly Update, the most popular answer to this question was that respondents had “no suggestion” for improvement. Ninety-four of the 213 respondents (44.1%) either couldn’t think of anything to add, or specifically complimented DEN and said that there was nothing more they could do. 41 respondents (19.2%) said that increasing the number of in-person events and institutes would be very beneficial to their professional growth. Many mentioned that access to “like-minded colleagues” at these events was very important. 23 of these respondents (10.8% of total respondents) specifically mentioned that they would like more “local events”. Frequently, respondents requested specific help for their region. Thirty-one respondents (14.6%) made requests for specific resources. Some of the respondents requested resources for use in the classroom and others asked for content directed specifically to professional development for particular careers. For example, requests included (1) more resources to help teach STEM and core content , (2) more resources targeted to specific grade levels (in particular elementary school and high school), and (3) more resources focused on guiding the implementation of DEN content Professional Development requests included resources specifically targeted at Administrators and Technology Integration Specialists. Other requests included more free resources, resources for mobile devices, resources for the SMART board, and more professional development sessions that provided “follow up” to prior PD sessions. Finally, respondents were asked one more open ended question about professional growth: “What suggestions do you have for additional professional development services that DEN could provide its members?” “No suggestion” was again a very popular answer among the 213 respondents, with 68 respondents (31.9%) giving this response. Once again, over one-third of the respondents (39.9%) requested particular kinds of resources for use in the classroom and specific content in professional development sessions. The list of resources was basically the same as that generated for the previous question. However there were additional requests 27    
  • 32.
    that included materialsthat students themselves could use, materials to help with teacher certification, and materials targeted at special education students. Some respondents (13.1%) requested more direct support at the local level. o “Providing smaller "institute-like" events that are more local (perhaps by state or region) so that more people can attend.” o “Perhaps more regional/local overnight experiences. One week in the summer is just not enough!” An additional 8 respondents mentioned wanting more in-person event without talking about support on the local level. Finally, the participants generated a number of other suggestions, each mentioned by fewer than 10% of the respondents. These included: • Improved ease of access to online materials. Eight people wanted access to archives for quick, “on demand professional development.” Five wanted resources that could be put into practice immediately (similar to the “quick tips” suggestion in the “weekly update” section.). o “For example, a webinar - 30 mins - animoto OR a webinar - 30 minutes - edmodo, etc. Quick, succinct, one topic.” • Changes in Webinars. A few (n=7) expressed a desire to see “DEN experts” more directly involved in webinars and other forms of professional development. These experts included people like Lance Rougeux as well as Discovery Channel celebrities. Others mentioned “timing issues”, particularly with how online events don’t seem to accommodate west coast members. Others wanted more opportunities to have DEN members as webinar presenters. • The addition of various activities and affordances. There were dozens of additional ideas ranging from a suggestion to add a book club discussion, to a suggestion to do “student adventure trips” locally, to a suggestion to have training materials in PDF form so they would print more easily. The respondents were then asked one last question about professional development, “As a member of the Leadership council, and a producer of DEN events, rank the following resources in order of how beneficial you think they are to the other educators in your DEN community. (Put the items in order of their perceived benefit, 9 being most useful, 1 being least useful.)” Respondents were given a list of nine DEN services to choose from. (See table 10) 28    
  • 33.
    TABLE10 Rankings of how useful resources are to others in your field. (n=213) Average ranking, from DEN Resources 1 to 9 Local in-person events (n=198)11 6.49 Days of Discovery (n=193) 6.14 Summer Institutes (n=200) 5.88 Webinars (n=187) 5.38 Educator resources on the website (n=204) 5.33 Virtual conferences (n=194) 5.23 Pre-conference events (n=195) 4.91 Exclusive Star giveaways (e.g. Mindmiester 3.62 or Schooltown) (n=209) Training Kits (n=199) 3.26 Overall, the Leadership Council ranked six resources as being very useful to other educators. They consistently ranked those opportunities that provided in-person interactions higher than either web-based communications or product-related resources. Local-in person events were considered to be the most useful to other educators with a mean score of 6.49, a mode of 9 (most useful). Training kits on the other hand, were considered least useful with a mean score of 3.26, and a mode of 1 (least useful) These trends were observed consistently across all professional groups. One notable difference, however, occurred with the Administrators (n=9) who ranked Pre-Conference Events as the second most useful resource with a mean score of 6.5 and a mode of 8. The average ranking for other professionals put these events in seventh place. Although there were strong and consistent trends with these answers, the range for every resource listed was between 1 and 9. Every resource had at least three respondents who found it least useful, and at least nine respondents who found it most useful. Summary of professional development Overall, respondents felt that DEN had been instrumental in their professional growth. There was a very strong correlation between what respondents identified as being essential to professional growth in their fields, and the resources and services that DEN provided. When asked “how much or how little had DEN contributed to your professional growth?” no single respondent answered “none”. Approximately nine out of ten respondents (89.2%) said that DEN had contributed either “very much” or “tremendous- ly” to their professional growth.                                                                                                                         11  Respondents  scored  at  least  one  resource  but  did  not  score  every  resource.       29    
  • 34.
    Respondents said thatthe keys to professional growth were understanding how to integrate technology, having access to useful resources, having the opportunity to network and learn from others, and making sure to keep up with current trends. Respondents named a number of ways that DEN had helped them to grow professionally, including assistance in building a network of like-minded colleagues, helping them learn how to better integrate technology into their work, enriching their practice with new ideas and new ways of thinking, and helping them stay up-to-date and aware of current educational trends. Although numerous respondents (44.1%) said that there was nothing more DEN could possibly do to help them with their professional growth, over half (55.9%) did have specific recommendations including requests for an increase in in-person events; access to resources that were more targeted at specific grade levels, subjects, or professions; and an increased effort to make DEN more democratic by opening up opportunities to attend events to more members. Use of Technology To close the survey, all respondents were asked 4 questions about how they used technology in their practice, and how DEN had affected that use of technology. First, all respondents were asked “How has your use of technology in your work changed over the last three years as a result of your participation in DEN?” Of the 210 respondents who answered this question, 203 (96.7%) indicated that the DEN had improved and increased their use of technology in some way. 40 respondents (19.0%) clearly stated that their use of technology had increased, and of those, 21 respondents (10.0%) explained that it had increased their use dramatically. o “My technology use as quadrupled twelve times because of the DEN.” o “There has been a 100%+ improvement.” o “Exponentially! (and I used a lot of technology to begin with!)” o “My use of technology has expanded beyond my own belief. I feel so much more comfortable and use technology much more than I expected.” Almost two-thirds, (62.9%) explained that DEN helped them better use technological resources in some way. 82 (39.0% of total respondents) said that DEN helped them learn how to use, or greatly improved their use of, a particular technological tool. 20 respondents (9.5%) mentioned improvement the use of video or Discovery streaming. 18 respondents (8.6%) mentioned improvement in the use of web 2.0 tools. Other specific tools mentioned include blogs, webinars, prezi, mashups, music in the classroom, and podcasting. 29 respondents (13.8%) didn’t name any particular tool, but said that DEN had provided “new” resources. The 48 other respondents (22.9%) who mentioned resources focused on behavior rather than any 30    
  • 35.
    particular tool. 24respondents said that DEN had taught them how to “integrate technology” into the classroom. o “I integrate technology more often in my daily classroom activities.” o “More of my teachers are comfortable and able to infuse technology into their curriculum” A few, (n=8) said that DEN’s support of their technology use had opened up “new approaches to teaching. o ”I have implemented lessons that I would not have thought of.” o “I am using so many new ways to teach the students.” Other descriptions of behavior changes included mentions of “going paperless”, being open to experimentation, working “smarter, not harder”, and being able to focus on what is really useful in technology. 30 respondents (14.3%) said that DEN had helped them learn how to use technology to greatly improve students’ experience in the classroom. 14 respondents (6.7%) mentioned improvements in “student engagement” and 12 respondents (5.7%) explained that they were using technology to shift to creating more “student centered learning”. o “I've changed the way I use technology with students--giving them the freedom of exploration and creativity.” o “An emphasis on CREATIVITY and having students produce original work and projects.” An additional 4 respondents mentioned that their use of technology had directly led to increased student growth. 25 respondents (11.9%) said that their involvement with DEN had allowed them to become “tech leaders” in their own schools and districts. o “I am a respected tech trainer for my district. I was recently asked to design and teach a Digital Citizenship course for high school . Much of what I teach I learned from my PLN” o ”  I have become the go to person for technology assistance.” o “I am now the new technology "Guru" at my local district and in other area schools.” Finally, the participants generated a number of other ways that DEN had changed how they used technology, each mentioned by fewer than 10% of the respondents. These included: • Keeping up with current trends (n=16). 31    
  • 36.
    • A networkof colleagues (n=14). Respondents said that DEN had given them a community of like-minded professionals who enriched their technological learning. • Student engagement (n=14). Respondents explained DEN had taught them how to use technology to increase and enhance “student engagement” in the classroom. • Confidence (n=13). Respondents said that DEN had made them significantly more “confident” when it came to using technology. • Career shift (n=9). Respondents indicated that DEN had changed their use of technology so significantly that they went on to start a new career. o “I went and got a Masters in IT because my new passion for technology.” o “I am pursuing a Master's degree in Educational Technology Leadership.” Respondents were next asked, “Other than lack of time, funding, and/or equipment, what is the greatest challenge that you face in regards to using technology in your work?” Of the 210 respondents who answered this question, only 8 (3.8%) said that they faced “no challenges” in regards to using technology. 14 respondents (6.7%) specifically mentioned that one, two, or all of the three challenges mentioned in the question (time, funding, equipment) were the main challenges that they faced. The challenges cited by at least 9% of the respondents were: • Getting buy-in from other members of the school district • Connecting technology to the curriculum • Dealing with access issues Getting Buy-In 88 respondents (41.9%) said that the biggest challenge they faced in using technology was getting “buy in” from other members of their schools and districts. Comments included: o “…district leadership, the school board members, and IT staff continues to make using technology in the classroom challenging.” o “Colleagues that are not learning at the same level that I am and administration that is way behind in their level of adoption of tech and therefore do not support me.” o “I have a difficult time getting some co-workers to get on board with using more technology in their class. Some still see tech as an 'extra' thing that there is no time for rather than it becoming a useful tool just like paper and pencil.” o “Teachers' unwillingness to infuse or want to use technology.” 32    
  • 37.
    Members of allprofessions mentioned that getting “buy in” from others was a problem. No one group was singled out; Respondents said that it was a problem getting “buy-in” from other teachers, administrators, peers, superintendents, and from many other members of their staffs. Connecting Technology to Curriculum 26 respondents (12.4%) mentioned that connecting technology to curriculum was the greatest challenge, mentioning one or more of the following: • 16 of these respondents said that making sure the curriculum was driving the use of technology was the greatest challenge. o “It is also important to show educators the difference between the use of technology for technology sake and high quality lessons that incorporate technology to increase student achievement.” • 11 of these respondents said that meeting district and state curriculum standards, and the demands of standardized tests limited their opportunities to fully utilize technology in their work. o “We seem to be, more and more, governed by "the test". Finding ways to incorporate technology while still meeting standards is a challenge. The activities I develop have to be very much tied to standards.” • A few (5) said that keeping up with what their students knew and were familiar with, and making their use of technology relatable to their students’ experiences was their greatest challenge. Dealing with Access Issues 19 respondents (9.0%) said that access issues, district firewalls, and blocked sites were the greatest challenge in regards to using technology. o “Oppressive policies have limited student and teacher access to exciting new media creation tools, publishing, and web 2.0 tools, and sent us back to the pre-internet days in many cases.” o “Filters that block me from many of the wonder tools that the DEN highlights or offers us.” Other issues that respondents mentioned included: • A lack of expertise in using the tools they wanted to use (n=13) • Not knowing which technological resources to use because of “too many choices” (n=11) • Specific technical issues, and problems troubleshooting the technology they had (n=8) • Keeping up with everything that is offered (6 respondents.) 33    
  • 38.
    Respondents were thenasked, “Is this a problem that DEN has been able to help you with?” Of the 210 respondents who answered this question, over half (59.5%) answered “yes, DEN has been able to help.” 85 respondents (40.5%) answered that “no, DEN has not been able to help” with this problem. The 125 respondents who answered that DEN was able to help with their problem were asked, “How has DEN helped you address this challenge? Please be specific and provide examples.” The 85 respondents who answered that DEN was not able to help with their problem were asked, “In what ways could DEN help you with this challenge?” Getting “Buy-in” Of the 88 respondents who had said that “getting buy in” from others was their greatest challenge, 55 respondents (62.5% of those 88) said that the DEN was, in fact, able to help them with this challenge. • 24 respondents said that it was the high quality of DEN’s resources that helped them get buy- in from others. They complimented the resources as being “easy to use” and “appealing” and said that the grounded easy-to use examples help them make the case to their peers. o “Given me simple ideas that even technically challenged teachers can replicate.” • Other responses included “DEN has provided a good pitch” for their colleagues, said that they acquired good ideas for buy-in from “other members of DEN”, and that DEN offered good incentives. Over one-third of the leaders (37.5%) said that DEN was not able to help with their “buy-in” problems. The largest number (12) of these respondents said that there was nothing DEN could do, that it was a local or institutional problem. The remaining respondents had a diverse number of recommendations, including hosting a local “Day of Discovery” perhaps focused on administrators and providing specific professional development sessions (e.g. webinars, networking opportunities) that dealt with this particular problem. Connecting technology to curriculum Of the 26 respondents who said that connecting technology to the curriculum was the biggest challenge, 17 (65%) said that DEN was able to help them by either “providing exciting lessons” and other resources, or by reaching out to other members of DEN to get ideas for good ways to connect the technology to the curriculum: o “Being able to ask for advice and they guide you or give you a great tip to push that teacher over to being a facilitator of learning.” 34    
  • 39.
    The remaining nine(34.6%) leaders said that DEN was not able to help them connect technology to the curriculum. Five respondents had no suggestion as to how DEN could help. Two respondents recommended targeted webinars to address the issue, and one recommended creating more “standards- based, technology rich lessons”. Access Issues Of the 19 respondents who said that “access issues” were their biggest challenge, only six (31.5%) said that it was a challenge DEN had helped with. Answers about how DEN had helped included the fact that the resources provided by Discovery Education had made it easy to make a pitch for change, that DEN had personally leant a hand to resolve the issue, and that the DEN community had provided “way arounds” for some of the blocks. The remaining two-thirds of the leaders said that DEN was not able to help with their issue. Six said that there was nothing that DEN could do, it was a local issue. Two respondents recommended specific training for Administrators to address the issue, two suggested that DEN develop a simple way to make the case that is backed up with research, and three suggested providing other ways to get to relevant material (embedded on the site, through Facebook, or on mobile devices that kids could access at home.) Other challenges In talking about how DEN had successfully helped with other technological issues, many respondents explained that DEN’s resources, including grounded examples, had been essential in helping them deal with the challenge. Good resources had helped respondents deal with limitations of time and organization. Many respondents explained that the fact that DEN was a single location that they could go to for multiple needs, saved them a lot of time, and helped keep them organized. The fact that there were so many free resources had also proven to be very helpful. o “DEN has tons of ideas for lesson plans and ways to use technology and other resources in the classroom.” o “Seeing what other DEN members do is always inspiring and saves a lot of time. Many of the tools that are showcased in blog posts, at in-person events, and at the virtual conferences are free so money is not really the biggest factor.” This second quote touched on another common theme: that respondents had usually been able to find tips, suggestions, and solutions from the other members of the DEN network. Of the 33 respondents who had other kinds of technological issues that they said DEN had not been able to help them with (including a lack of expertise with tools, very specific technical issues), over half (57.6%, 19 respondents) had no ideas about how DEN could help. Most of the suggested remedies were creating training videos and online resources to address common troubleshooting issues, creating more 35    
  • 40.
    easily accessible databasesof information, and providing more “ready to go” lesson plans and resources that could be put into practice immediately. Respondents were then asked one final question about their use of technology, “What other challenges regarding technology in your work might DEN be able to help you with?” Of the 210 respondents who answered this question, 77 respondents (36.7%) had “no suggestion” or “no idea” what else could be done. As with similar answers to other questions, these responses were peppered with compliments to DEN and requests to “keep it up.” o “The DEN needs to keep doing what they do! They are very supportive and always reachable. I have made some very close friends within the DEN community and they have been there every step of my journey in this tech-developing world.” o “I feel that if something were to come up, the DEN will be the first place that I go to for assistance and advice.” o “I'm very happy...but I know the DEN will continue to improve and give me even more The remaining comments clustered around two major concerns. Participants mentioned needing • Additional resources for technology • More assistance with outreach Additional Resources Thirty-three respondents (15.7%) had suggestions for different types of resources and content that would be helpful to them in regards to technology. 10 respondents asked for new technology integration ideas, 5 wanted more examples and lessons that could be put into use immediately. Other requests included calls for more resources to integrate technology into the teaching of STEM and other core subjects and requests for materials to be targeted at specific grades. o “More tips and tricks rather than big major lessons and projects.” o “Providing more examples of student produced content at all levels.” o “Would it be possible for the DEN to offer workshops let's say using web 2.0 or 8 Ways to Use DE streaming for K-2, 3-5, 6-8, 9-12? Then, get into some real examples of work created within these grade levels using these tools” More Assistance with Outreach Thirty respondents (14.3%) wanted more assistance with reaching out to administrators, other teachers, and other peers and superiors in their districts. They asked for more help in getting others on board with technology in school and with DEN in particular. 36    
  • 41.
    o “Getting qualitytech information out to more people. Sometimes I am not sure if the other staff in my district are getting newsletters that I get. I hope that they do get some correspondence from Discovery - maybe on a monthly or quarterly basis. I think that many staff do not want a weekly message but they would look at something received less often.” o “Training the public, teachers, students, and administrators on what you have to offer.” o “Reach out to administrators and even our legislators to stress the importance of 21st century learning skills.” Finally, the participants mentioned a few other ways that DEN could help with technology, each mentioned by fewer than 10% of the respondents. These included: • Funding (n=17) Respondents specifically asked for assistance with funding and other issues related to the cost of materials. Nine of these were requests for more free resources, and the wish to make access to Discovery less expensive. Eight respondents suggested that DEN could create resources to help members seek out funding and grants for technology use. o “Finding grants and other ways to fund technology.” • Help with staying current (n=14). Respondents stressed that they wanted DEN to continue helping them stay current with new technologies, new trends, and new ideas for use in their work. • Local support (n=13) Respondents requested more local support and in-person events. • Resources for mobile devices (n=6) Respondents wanted more DEN materials for IPads and other mobile devices. Summary of technology use Respondents to this survey reported that, in general, DEN had a major impact on the way they used technology in their work. Nearly all respondents (96.7%) reported that their use of technology had improved and increased in some way as a result of their involvement with DEN. Respondents specifically mentioned improvement with specific products like video integration, or social media; an increased understanding of how to smoothly and usefully integrate technology into their work; and an overall improvement in instructional practice leading to a more “student centered” classroom. Many respondents pointed out that they had become “tech leaders” in their school communities. Almost all respondents (96.2%) reported facing challenges in terms of using technology in their work. The top challenges were getting “buy-in” from other members of the school district that using technology was beneficial, connecting technology to the curriculum in a meaningful way, and dealing with access issues. More than half of respondents (59.5%) said that DEN was able to help them with 37    
  • 42.
    their challenges, mostlythrough high-quality resources and access to a helpful network of colleagues. Less than half of the respondents (40.5%) said that DEN was not able to help with their challenges, mostly because they were outside of DEN’s sphere of influence. In completing the survey, respondents were asked to “Please add any additional comments that you want to share about your DEN experience.” Nearly all respondents used this as a final opportunity to praise DEN. Comments included: o “I cannot stress enough how indebted I am to the DEN for the support and encouragement that the DEN team has offered me as an educator. I feel as if they have been the light that has helped me to stay inspired as a teacher. I am very fearful that this, like so many cuts in education, will also end leaving me to depend on the offerings in tech locally, which are hard to find, expensive and not supported by my district. THANK YOU DEN!” o “I can't imagine still being a teacher in the 21st Century without being a member of the DEN. It's not an option.” o “Thank you for treating us like professionals! You are the only ones who do.” o “DEN has been an awesome experience. I just hope that Discovery realizes the gem that they have. I know it's probably hard to justify the money without hard data. They are truly making a difference for teachers! It's easy to recruit others for the DEN because they see how my face lights up when I talk about it. Thanks Discovery!” Discussion and Recommendations Four guiding questions were generated in conceptualizing this study. These questions informed the development of the survey and now become the focus of discussion of the results. The questions were: What resources, services and products do DEN members use? How do DEN members use those resources, services, and products? How has DEN affected their professional growth? How has DEN affected how they use technology in their work? What Resources, services, and products do DEN members use? Overall, this study found that Leadership Council members were extremely active in DEN and committed to using its resources, services and products. The fact that 84.7% of the respondents invited to this survey completed it is itself a testament to that commitment. The participants regularly availed themselves of nearly every resource and service that DEN had to offer. The most heavily used and the 38    
  • 43.
    most appreciated resourcewas the Weekly Update. Three-fourths of the respondents read the Update as often as possible, every week. The participants also valued their interaction with peers and appreciated how DEN facilitated these learning opportunities. Over two-thirds interacted with DEN through some form of social media at least once a month and half interacted over distance at least once a week. Although all forms of social media were utilized, blogs and Facebook were preferred. Many respondents discussed the value-added of being able to collaborate and share information via social media through DEN. The Update and social media were not the only heavily used resources and services used by the Leadership Council members. Over one–third of the respondents attended webinars at least monthly. Although exact information about the amount of general usage of the Resource Library was not gathered through this survey, respondents indicated that they both uploaded and downloaded materials from the Library and found the resource to be useful. Notably, however, one third of these leaders had never uploaded a resource to the Library. Overall, the participants from the Educator’s Leadership Council were highly involved in DEN and heavily utilized all of its resources, services, and products. They were dedicated to participating in DEN and interacted with the network at least on a weekly basis. They found their interactions to be very useful to their professional lives. How do DEN members use those resources, services, and products? Members used the resources, services, and products in a variety of ways. They were very interested in keeping up with current trends in education. . They found interaction with DEN through social media and the Weekly Update to be great sources of information for learning about the “cutting edge” issues and educational technology. The leaders were also committed to finding resources to use in their work. Participants reported finding a plethora of practical tools that they could implement from DEN resources like the webinars, Resource Library, and Weekly Update. Access to grounded, easy-to-use resources that could be applied very quickly to the school environment motivated leaders to turn to DEN. Requests for more such “turn key” “classroom ready” resources were common. Finally, leaders turned to DEN to provide avenues for collaborations and opportunities to learn from colleagues. They recognized that one of the greatest values of DEN was the membership itself. They looked for ways to share ideas and support one another. How has DEN affected their professional growth? Overall, respondents reported that DEN had a major effect on their professional growth. Approximately nine out of ten respondents (89.2%) said that DEN had contributed either “very much” or “tremendously” to their professional growth. There was a very strong correlation between what 39    
  • 44.
    respondents said wasnecessary for their professional development and the ways in which they said DEN had helped them grow professionally. One-third of respondents (32.9%) said that developing an understanding how to integrate technology into their work was a very important part of professional growth. Many respondents (21.1%) mentioned that this was exactly the kind of service that DEN had provided for them. Respondents clearly saw other DEN members as an invaluable resource. One-quarter of the respondents (25.2%) mentioned that a “network of like-minded colleagues” was key to professional development and over half of the respondents (51.6%) stated that this kind of “network” was exactly what DEN had provided for them. Additionally, members frequently mentioned the fact that they could look to their DEN community for help and support. DEN participants especially appreciated the opportunities DEN provided for interaction with colleagues. Overall, when asked to rate the resources that DEN provided in terms of how they assisted with professional growth, in-person events and opportunities to network consistently ranked higher than online events and specific product-related resources. Respondents indicated that not only has DEN helped them grow professionally, it has helped transform their practice. There were multiple mentions of DEN being “more valuable” than a Master’s degree, and of how DEN had transformed respondents into “leaders.” How has DEN affected how they use technology in their work? In general, respondents reported that their involvement in DEN has had a tremendous positive impact on their use of technology in their work. Nearly all respondents (96.7%) reported that their use of technology had not only increased but improved in some way as a result of their involvement with DEN, with many respondents reporting that DEN had been “transformative” for them. Respondents who were “technology novices” prior to their involvement in DEN reported becoming “leaders in their schools”. Respondents who already used a lot of technology prior to their involvement in DEN reported transformative growth as well. Almost two-thirds of respondents (62.9%), said that DEN had specifically helped them learn how to use specific kinds of technology to integrate into their work. Respondents mentioned video integration, web 2.0 resources, music, webinars, and many other types of technological tools that DEN had helped them master. Respondents also mentioned that DEN had helped them with technology integration on a more fundamental level, helping them enrich their curriculum and using technology to make their classrooms more “student centered.” The vast majority of respondents (96.2%) explained that they faced some kind of technological challenge in their work. The most common challenge faced by respondents was getting other members of their staff and district to accept that technology could make a significant and important contribution to their work. Other challenges included a concern for making sure technology was richly connected to curriculum rather than simply an “add on” and also access issues, such as district firewalls. 40    
  • 45.
    More than halfof respondents (59.5%) said that DEN was able to help them with their challenges, mostly through high-quality resources and access to a helpful network of colleagues. Less than half of the respondents (40.5%) said that DEN was not able to help with their challenges, usually stating that it was because of forces outside of DEN’s control. Additional Thoughts and Recommendations • Since the respondents to this survey were such an extremely active and involved group, it would be worth considering doing a similar, but smaller survey of other types of DEN members (Stars and general members). Such as study would allow DEN to compare those responses of those of the members of the leadership council. Questions from this survey instrument could be used to conduct focus groups, seminars, and other surveys. • Since the responses of Administrators did not always reflect those of the other respondents, further study on how DEN impacts Administrators is recommended. Throughout the survey there are multiple mentions of Administrators needing more support and resources. Additionally, because numerous other professionals mentioned a need to reach out to Administrators to get more “buy in” for using DEN in their schools, more research on how Administrators experience DEN could be very beneficial to the community as a whole. • The respondents to this survey were extremely knowledgeable about DEN, its services, and how it operates. Due to the number of specific suggestions, there were simply too many good ideas in the survey data to include in this report. Therefore, it would definitely be worthwhile for DEN staff to look at the raw, open-response data that was collected in this survey. Particular attention should be given to the recommendations for the Weekly Update, the recommendations for further professional development services, and the recommendations for how to help with challenges presented by the use of technology in respondents’ work. Conclusion The responses to this survey revealed that the members of the Leadership Council were incredibly involved in and dedicated to DEN. They interacted regularly through all possible channels, using all of DEN’s resources. The Discovery Education Network has had an incredible impact on the professional development of its members. Discovery has connected educators from all around the country, has provided exceptional professional development, and has increased and improved the use of technology in the classroom. As mentioned by numerous respondents, Discovery has done all of this during a time when budgets are being cut and districts are becoming less friendly to experimentation in the classroom. Probably the best way to sum up all of this is with the voice of one of DEN’s members: 41    
  • 46.
    “I have saidthis before, and I will say it again - Thank you so very much to the DEN for providing exciting ways to be a great teacher!!!! Teachers are constantly asking me, ‘Where did you learn that?’ My response, ‘The Discovery Educator Network! You should join it.’” 42    
  • 47.
    Appendices Appendix A Complete ratingsof social media to interact with DEN. 1 – Not Number 2 – Not 3– 4– 5 - Very Rating at all of useful Neutral Useful useful Average useful Responses Blogs 2 4 21 77 121 4.38 225 Facebook 12 9 64 71 68 3.78 224 Twitter 24 4 61 60 75 3.71 224 Edmodo 27 17 87 63 27 3.21 221 LinkedIn 42 25 112 36 2 2.68 217 43