MICROECONOMICS
Microeconomics is thestudy of how households and
firms behave and how they interact in the market. The
interaction of households and firms moves the market
towards towards equilibrium and determines the price
and quantity of goods and services.
More specifically, microeconomics deals with the study
of market forces that allocate resources – demand and
supply. Demand is rooted in the decisions of
households while supply is based on the decisions
firms.
Learning
Objectives
■Define demand
■Explain thelaw of demand
■Identify the factors that affect demand
■Know the difference between movement
along the demand curve and shift of the
demand curve.
3
4.
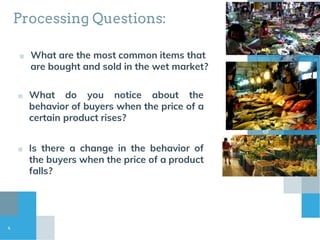
Processing Questions:
■ Whatare the most common items that
are bought and sold in the wet market?
■ What do you notice about the
behavior of buyers when the price of a
certain product rises?
4
■ Is there a change in the behavior of
the buyers when the price of a product
falls?
5.
Demand
■ It indicatesa willingness to buy
a particular good or service.
■ It refers to the quantity of a
commodity in the market that an
individual wants to purchase in a
given period of time
5
6.
6
Ceteris Paribus
It isa Latin phrase that means “all
other factor held constant.”
Without this assumption, it will be difficult
to isolate the effects on market outcome
of individual factors. When ceteris
paribus is indicated, this means that the
only factor that changes is the one being
discussed.
7.
Law of Demand
Accordingto this law, an increase in
price will lead to a decrease in the
quantity demanded of the good, other
factors remaining constant. Conversely,
a price decrease will lead to an
increase in the quantity demanded.
8.
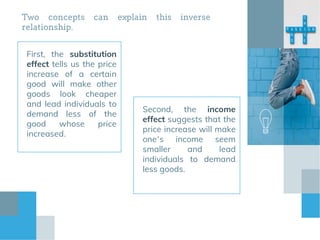
Two concepts canexplain this inverse
relationship.
First, the substitution
effect tells us the price
increase of a certain
good will make other
goods look cheaper
and lead individuals to
demand less of the
good whose price
increased.
Second, the income
effect suggests that the
price increase will make
one’s income seem
smaller and lead
individuals to demand
less goods.
9.
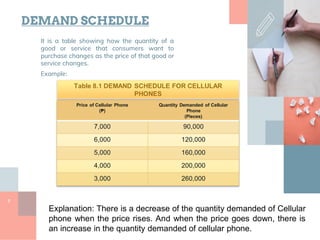
DEMAND SCHEDULE
It isa table showing how the quantity of a
good or service that consumers want to
purchase changes as the price of that good or
service changes.
Example:
9
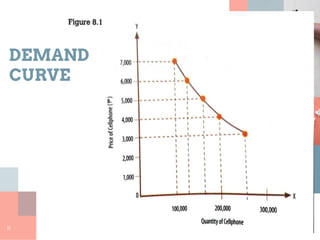
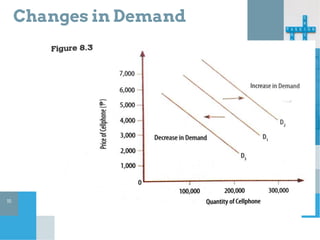
Table 8.1 DEMAND SCHEDULE FOR CELLULAR
PHONES
Price of Cellular Phone
(₱)
Quantity Demanded of Cellular
Phone
(Pieces)
7,000 90,000
6,000 120,000
5,000 160,000
4,000 200,000
3,000 260,000
Explanation: There is a decrease of the quantity demanded of Cellular
phone when the price rises. And when the price goes down, there is
an increase in the quantity demanded of cellular phone.
10.
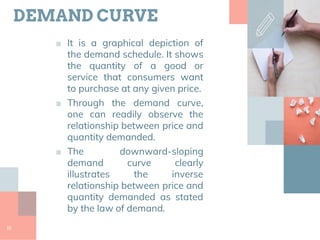
DEMAND CURVE
■ Itis a graphical depiction of
the demand schedule. It shows
the quantity of a good or
service that consumers want
to purchase at any given price.
■ Through the demand curve,
one can readily observe the
relationship between price and
quantity demanded.
■ The downward-sloping
demand curve clearly
illustrates the inverse
relationship between price and
quantity demanded as stated
by the law of demand.
10
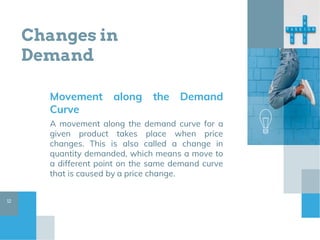
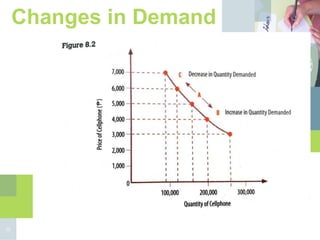
Movement along theDemand
Curve
A movement along the demand curve for a
given product takes place when price
changes. This is also called a change in
quantity demanded, which means a move to
a different point on the same demand curve
that is caused by a price change.
Changes in
Demand
12
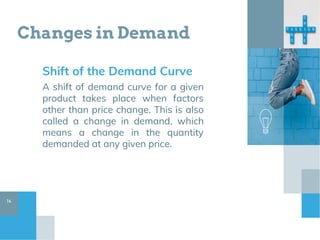
Changes in Demand
Shiftof the Demand Curve
A shift of demand curve for a given
product takes place when factors
other than price change. This is also
called a change in demand, which
means a change in the quantity
demanded at any given price.
14
Five Main Non-Price
ReasonsWhy the Demand
Curve Shifts
■ Changes in Income
■ Changes in the Price of Related Goods
■ Change in Taste and Preferences
■ Change in Expectations
■ Change in the number of buyers
16
17.
1. Change inIncome
Example: As household incomes rise, demand shifts away from
charcoal-powered stove and towards a more convenient LPG-
powered stove.
2. Changes in the Prices of
Related Goods
Substitute goods. A decrease in the price of one
leads to a decrease in the demand for the other.
Example: coffee and tea, desktop and laptop
computers, pork and beef
Complementary goods. A decrease in the price of
one good leads to an increase in the demand for
another.
Example: Coffee and sugar, printer and ink
cartridge, car and gasoline.
3. Change in Taste and
Preferences
Example: It is expected that the
demand for cellular phones will
decline as demand for smartphones
soars.
17
4. Change in
Expectations
Demand for a good or service
today is affected by expectations
about the future. An expected
increase in future income will
increase willingness to pend
current savings.
5. Change in the numbers
of buyers
Example: The demand for cellular
phones may rise if there is an increase
in the number of people with high-
paying jobs.