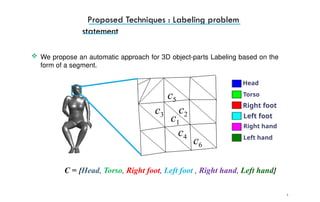
The document discusses a hybrid deep learning network (CNN-SVM) for 3D mesh segmentation presented at an international conference. It proposes an automatic approach for labeling parts of 3D objects based on shape characteristics and employs a graph cut technique for refinement. The experiments demonstrate improved segmentation accuracy compared to existing methods, showcasing effective local feature extraction and high-level learning processes.


![4
[Kraevoy et al.
2007]
Shuffler
[Dai et al. 2018]
Joint segmentation
[Jun Yang 2016]
Consistent segmentation
[Xu et al. 2010]
Style separation
[Kalogerakis et al. 2010]
Supervised segmentation
[van Kaick et al. 2011]
Supervised correspondence
Related work: 3D Mesh Segmentation](https://image.slidesharecdn.com/385-241109192502-d38812f1/85/Deep-learning-CNN-SVM-for-3D-mesh-segmentation-pptx-4-320.jpg)
![6
Proposed Techniques : Features extraction
Shape Analysis
Local Shape Properties
Curvature
Shape Diameter Function
Diffusion Distance
Shape contexts
Geodesic distance
Spin images
[Shapira et al. 2008]
[Rusinkiewicz 2004]
[de Goes et al. 2008]](https://image.slidesharecdn.com/385-241109192502-d38812f1/85/Deep-learning-CNN-SVM-for-3D-mesh-segmentation-pptx-6-320.jpg)
![7
Learning process : CNN-SVM Architecture
Concatenate and re-organize the extracted features to form a 20×30 [Guo and
al. 2015] feature matrix.
Learn the deep model to predict the probability distribution function.
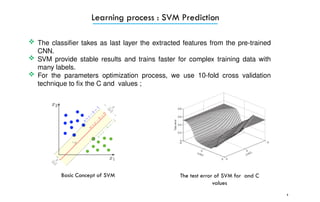
Using the SVM classifier with a linear kernel as a last layer to assign the good
face label
Refined using contextual information through graph cut post process](https://image.slidesharecdn.com/385-241109192502-d38812f1/85/Deep-learning-CNN-SVM-for-3D-mesh-segmentation-pptx-7-320.jpg)

![10
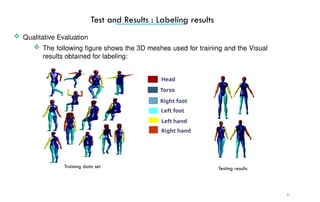
Test and Results : Dataset
19 classes each composed of 20 meshes from the Princeton Shape Benchmark
[ Shilane et al. 2007] Using the ground-truth labeling created by Kalogerakis et al.
[2010].
SHREC’07: Generic 3D Watertight Meshes
Giorgi et al. 2007](https://image.slidesharecdn.com/385-241109192502-d38812f1/85/Deep-learning-CNN-SVM-for-3D-mesh-segmentation-pptx-10-320.jpg)