Download as PDF, PPTX


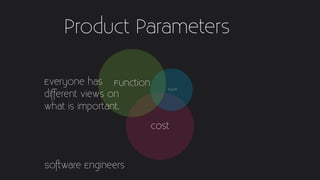

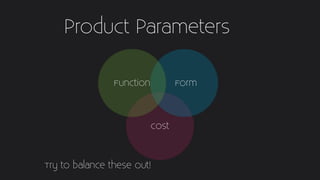


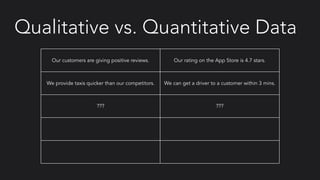


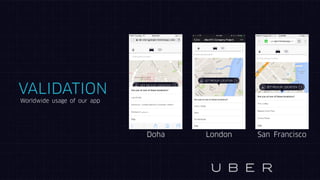
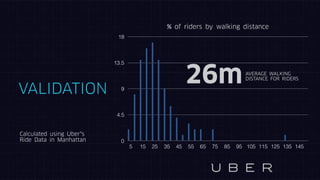

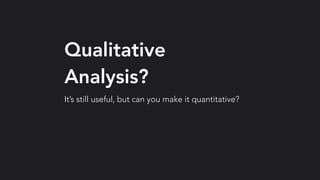
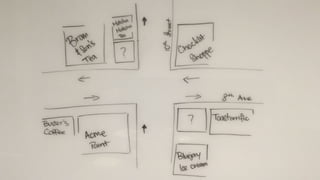


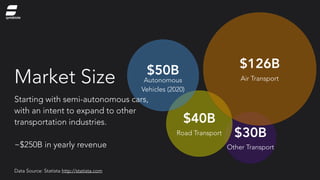
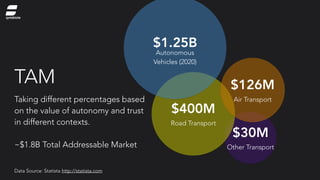

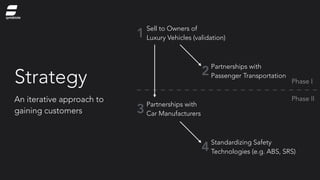


The document outlines a lecture by Zaid Haque from Carnegie Mellon Qatar, focusing on decision-making in product design, particularly in mobility technologies like Uber. It discusses the balance between cost and user experience, the importance of quantitative data for validating design choices, and strategies for improving rider experiences. Additionally, it highlights the market potential for semi-autonomous vehicles and the competitive landscape for the company Symbiote, which aims to develop intuitive interfaces for future mobility solutions.


![UX in Asia - Japan [UXHK2012 Presentation]](https://cdn.slidesharecdn.com/ss_thumbnails/20120215uxinasiajapan-120301220429-phpapp02-thumbnail.jpg?width=640&height=640&fit=bounds)


