Download to read offline


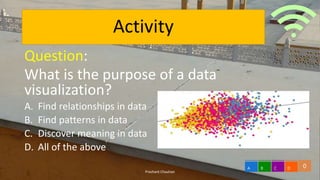
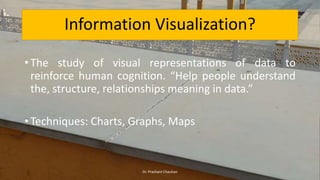
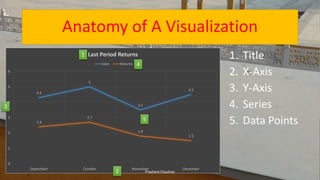
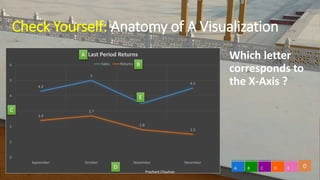

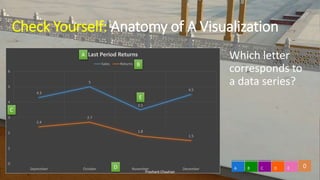


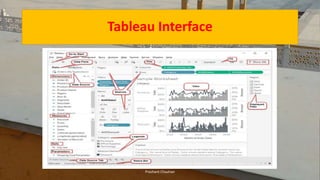


The document provides an introduction to data visualization and Tableau. It discusses the purpose of data visualization as finding relationships, patterns, and discovering meaning in data. Key concepts covered include the anatomy of a visualization using an example chart, how to use Tableau Desktop and Tableau Server for interactive data visualization, and the benefits of collaboration using Tableau Server.


