Download to read offline

![What Happened to Napoleon’s troops?
Minard’s Plot[1]
JULY 20, 2018 ©SEJI OH PAGE 4](https://image.slidesharecdn.com/datavisualization-regressionanalysispraticesejiohjuly202018-191028152204/75/Data-visualization-regression-analysis-pratice-sejioh-july20_2018-4-2048.jpg)
![What Happened to Napoleon’s troops?
Dataset: Napoleon’s March[2]
JULY 20, 2018 ©SEJI OH PAGE 5](https://image.slidesharecdn.com/datavisualization-regressionanalysispraticesejiohjuly202018-191028152204/75/Data-visualization-regression-analysis-pratice-sejioh-july20_2018-5-2048.jpg)
![What Happened to Napoleon’s troops?
Let’s draw Minard’s plot using R, especially with the package
‘ggplot2’.[3]
JULY 20, 2018 ©SEJI OH PAGE 6](https://image.slidesharecdn.com/datavisualization-regressionanalysispraticesejiohjuly202018-191028152204/75/Data-visualization-regression-analysis-pratice-sejioh-july20_2018-6-2048.jpg)
![What Can We Do With Game Log Data?
Visualizing StarCraft with R[4][5]
JULY 20, 2018 ©SEJI OH PAGE 7](https://image.slidesharecdn.com/datavisualization-regressionanalysispraticesejiohjuly202018-191028152204/75/Data-visualization-regression-analysis-pratice-sejioh-july20_2018-7-2048.jpg)
![What Can We Do With Game Log Data?
Visualizing StarCraft with R[4][5]: colored by unitID
JULY 20, 2018 ©SEJI OH PAGE 8](https://image.slidesharecdn.com/datavisualization-regressionanalysispraticesejiohjuly202018-191028152204/75/Data-visualization-regression-analysis-pratice-sejioh-july20_2018-8-2048.jpg)
![refrences
[1] Wikipedia, Charles Joseph Minard
https://en.wikipedia.org/wiki/Charles_Joseph_Minard
[2] The Grammar of Graphics, 2ED, Leland Wilkinson, SPSS Inc.
[3] A Layered Grammar of Graphics, Hadley WICKHAM
http://vita.had.co.nz/papers/layered-grammar.pdf
JULY 20, 2018 ©SEJI OH PAGE 19](https://image.slidesharecdn.com/datavisualization-regressionanalysispraticesejiohjuly202018-191028152204/75/Data-visualization-regression-analysis-pratice-sejioh-july20_2018-19-2048.jpg)
![refrences
[4] Visualizing Professional StarCraft with R
https://towardsdatascience.com/visualizing-professional-starcraft-
with-r-598b5e7a82ac
[5] StarCraftMining, Github
https://github.com/bgweber/StarCraftMining
JULY 20, 2018 ©SEJI OH PAGE 20](https://image.slidesharecdn.com/datavisualization-regressionanalysispraticesejiohjuly202018-191028152204/75/Data-visualization-regression-analysis-pratice-sejioh-july20_2018-20-2048.jpg)

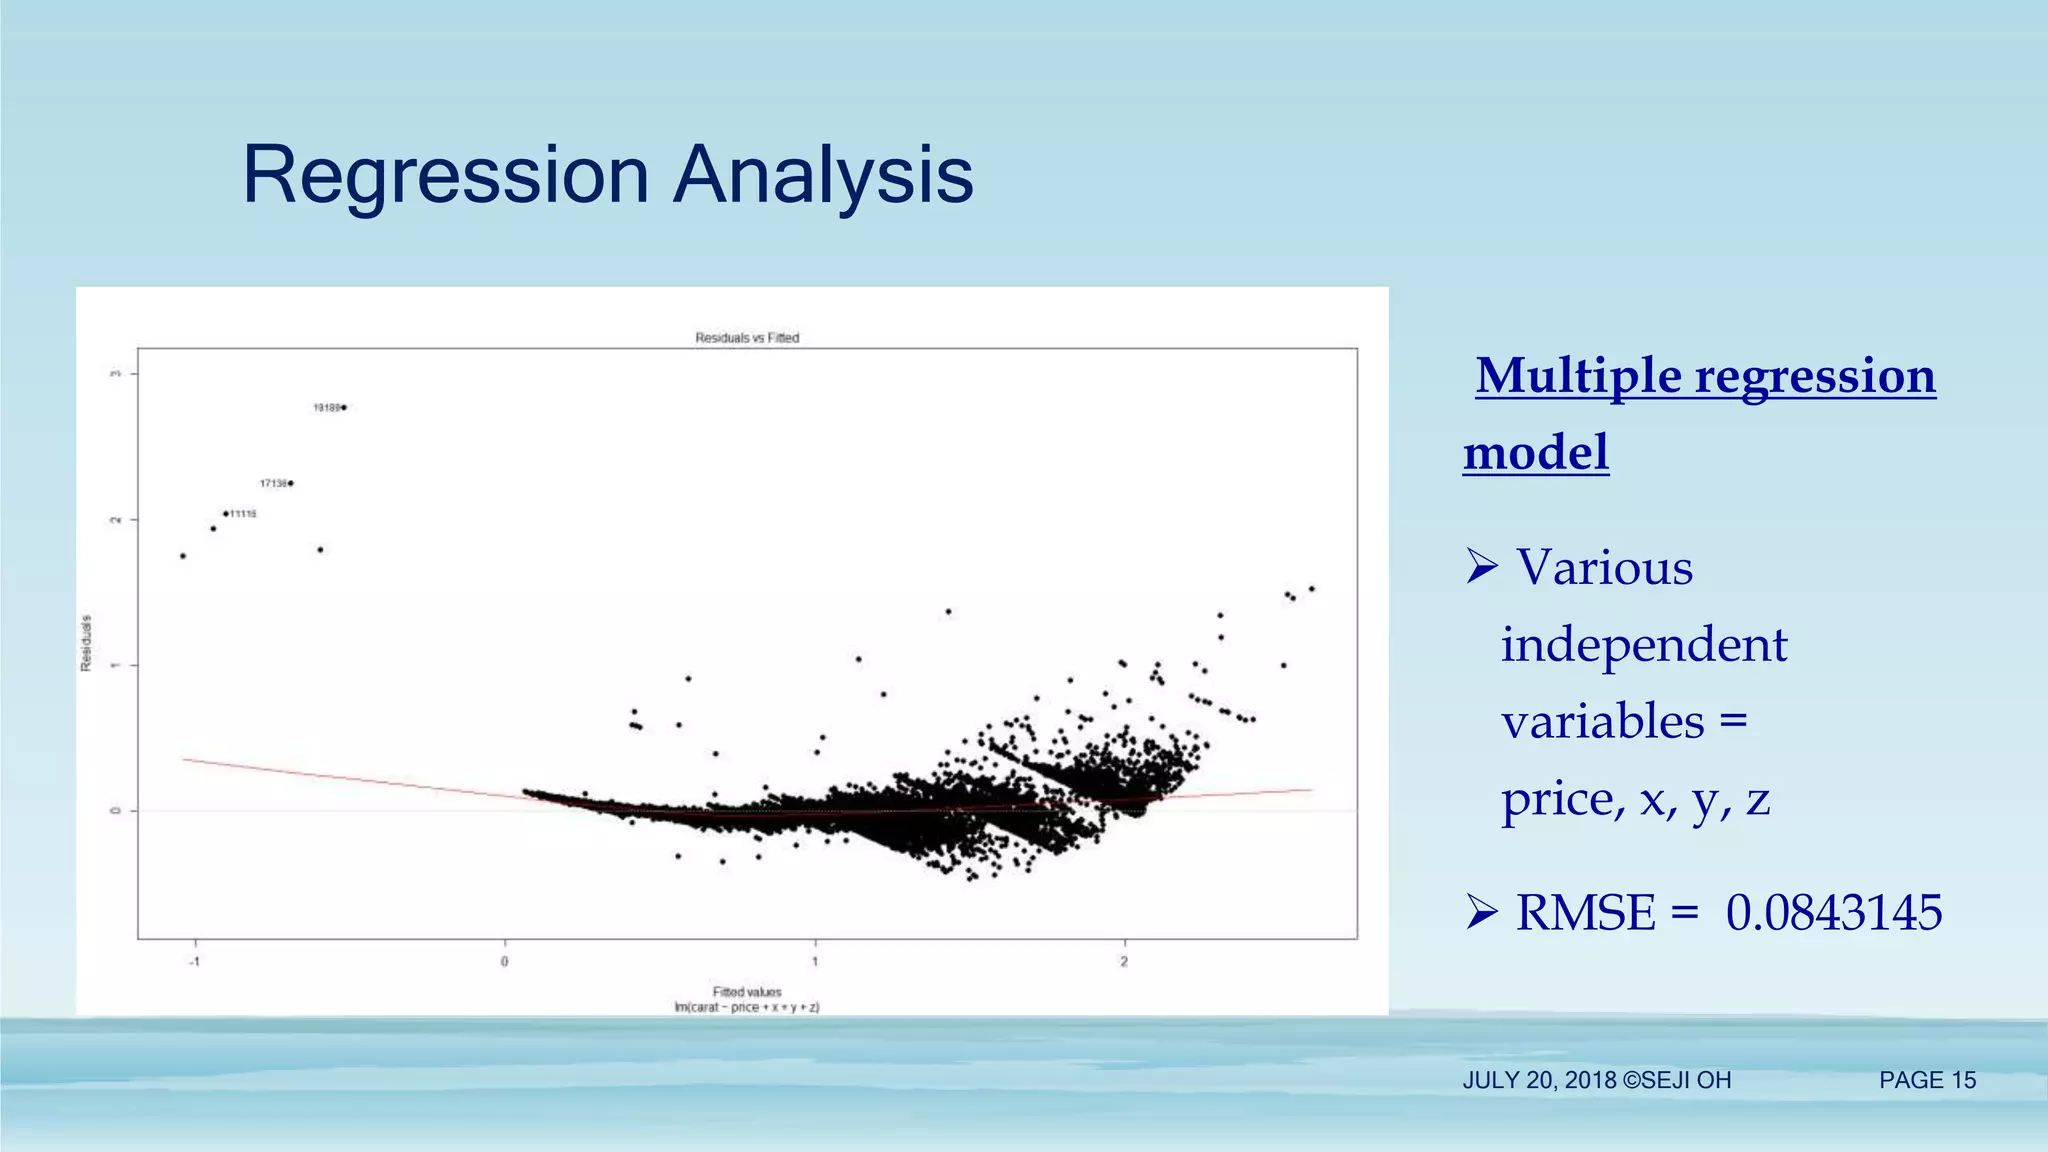
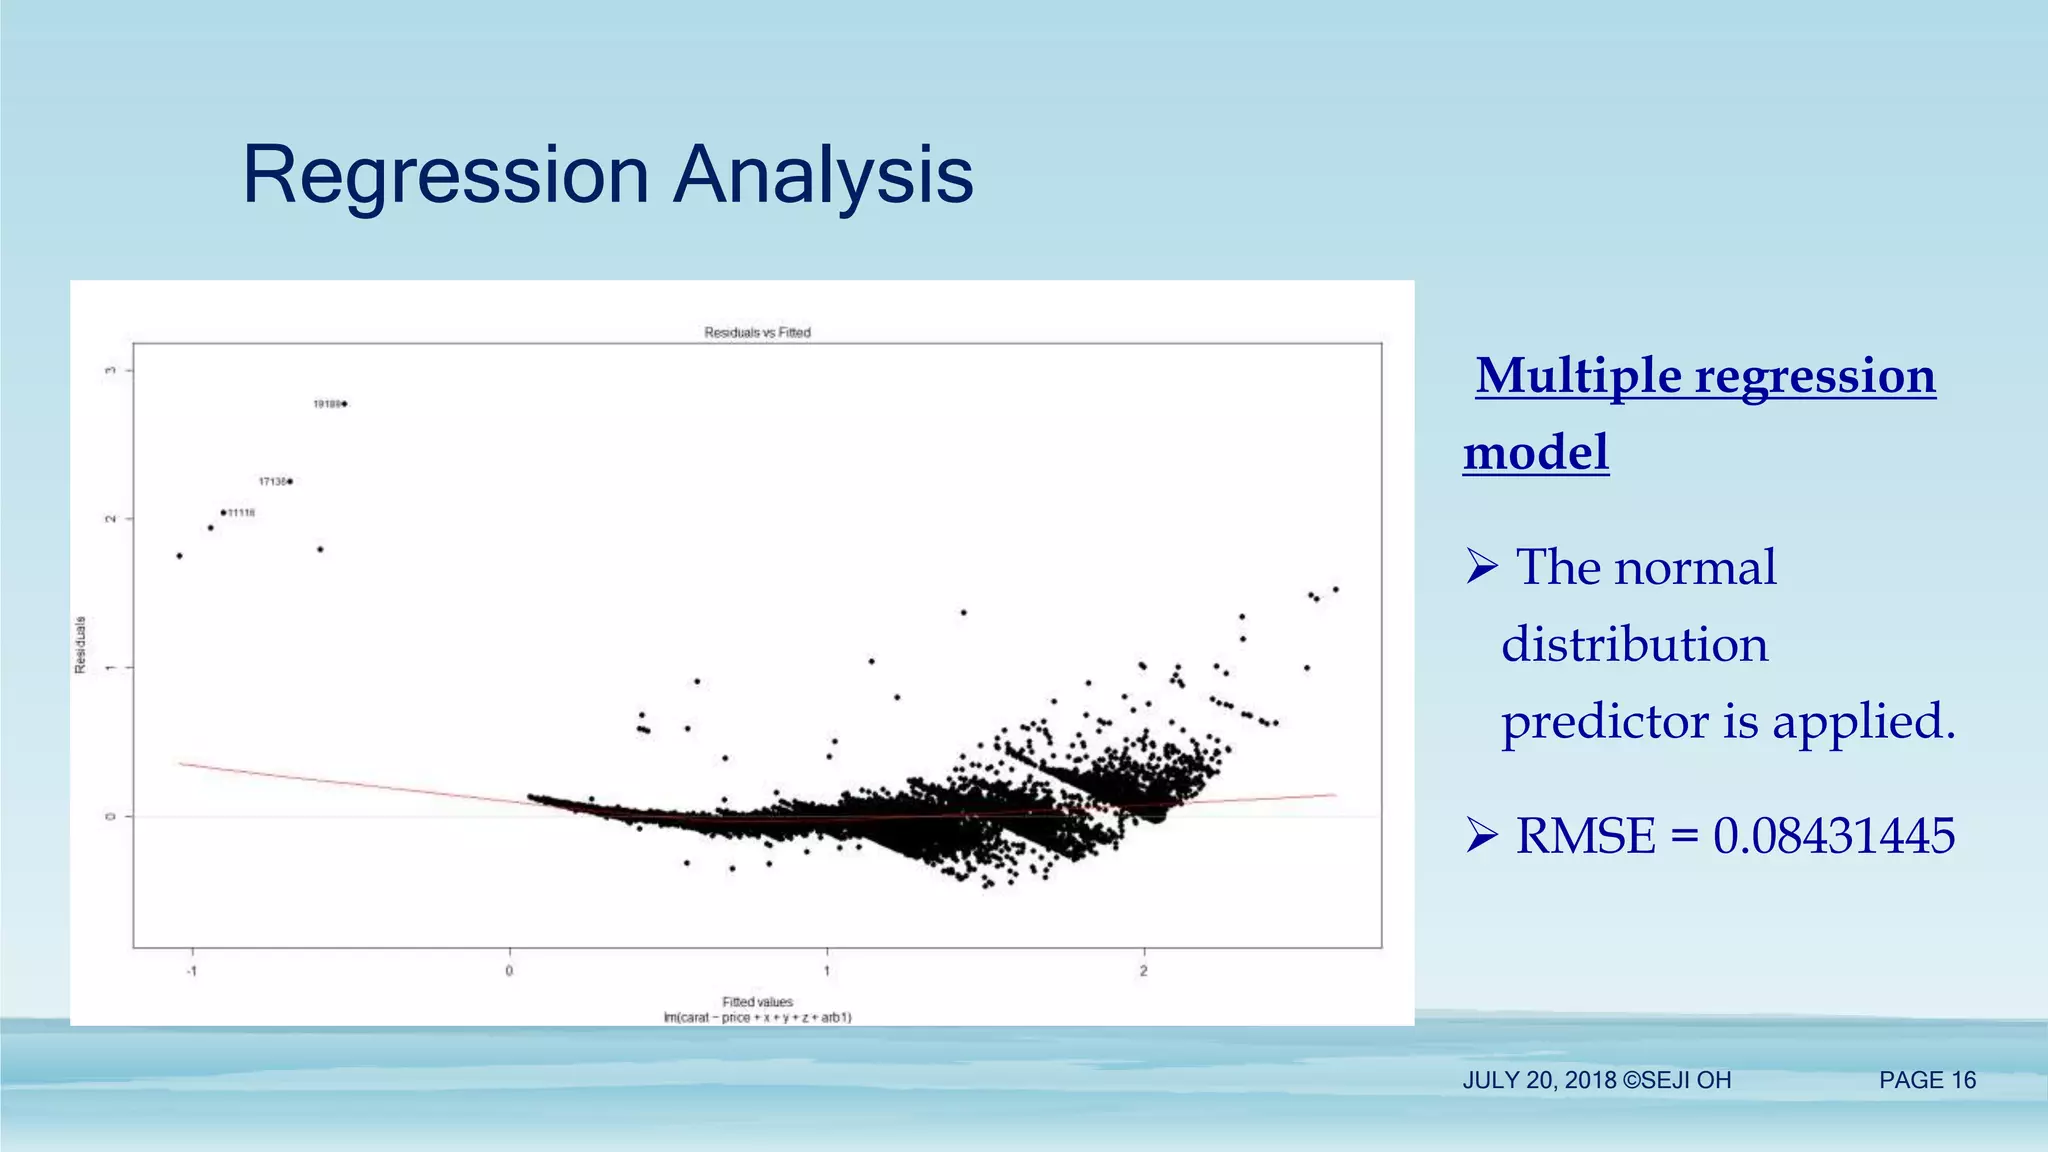
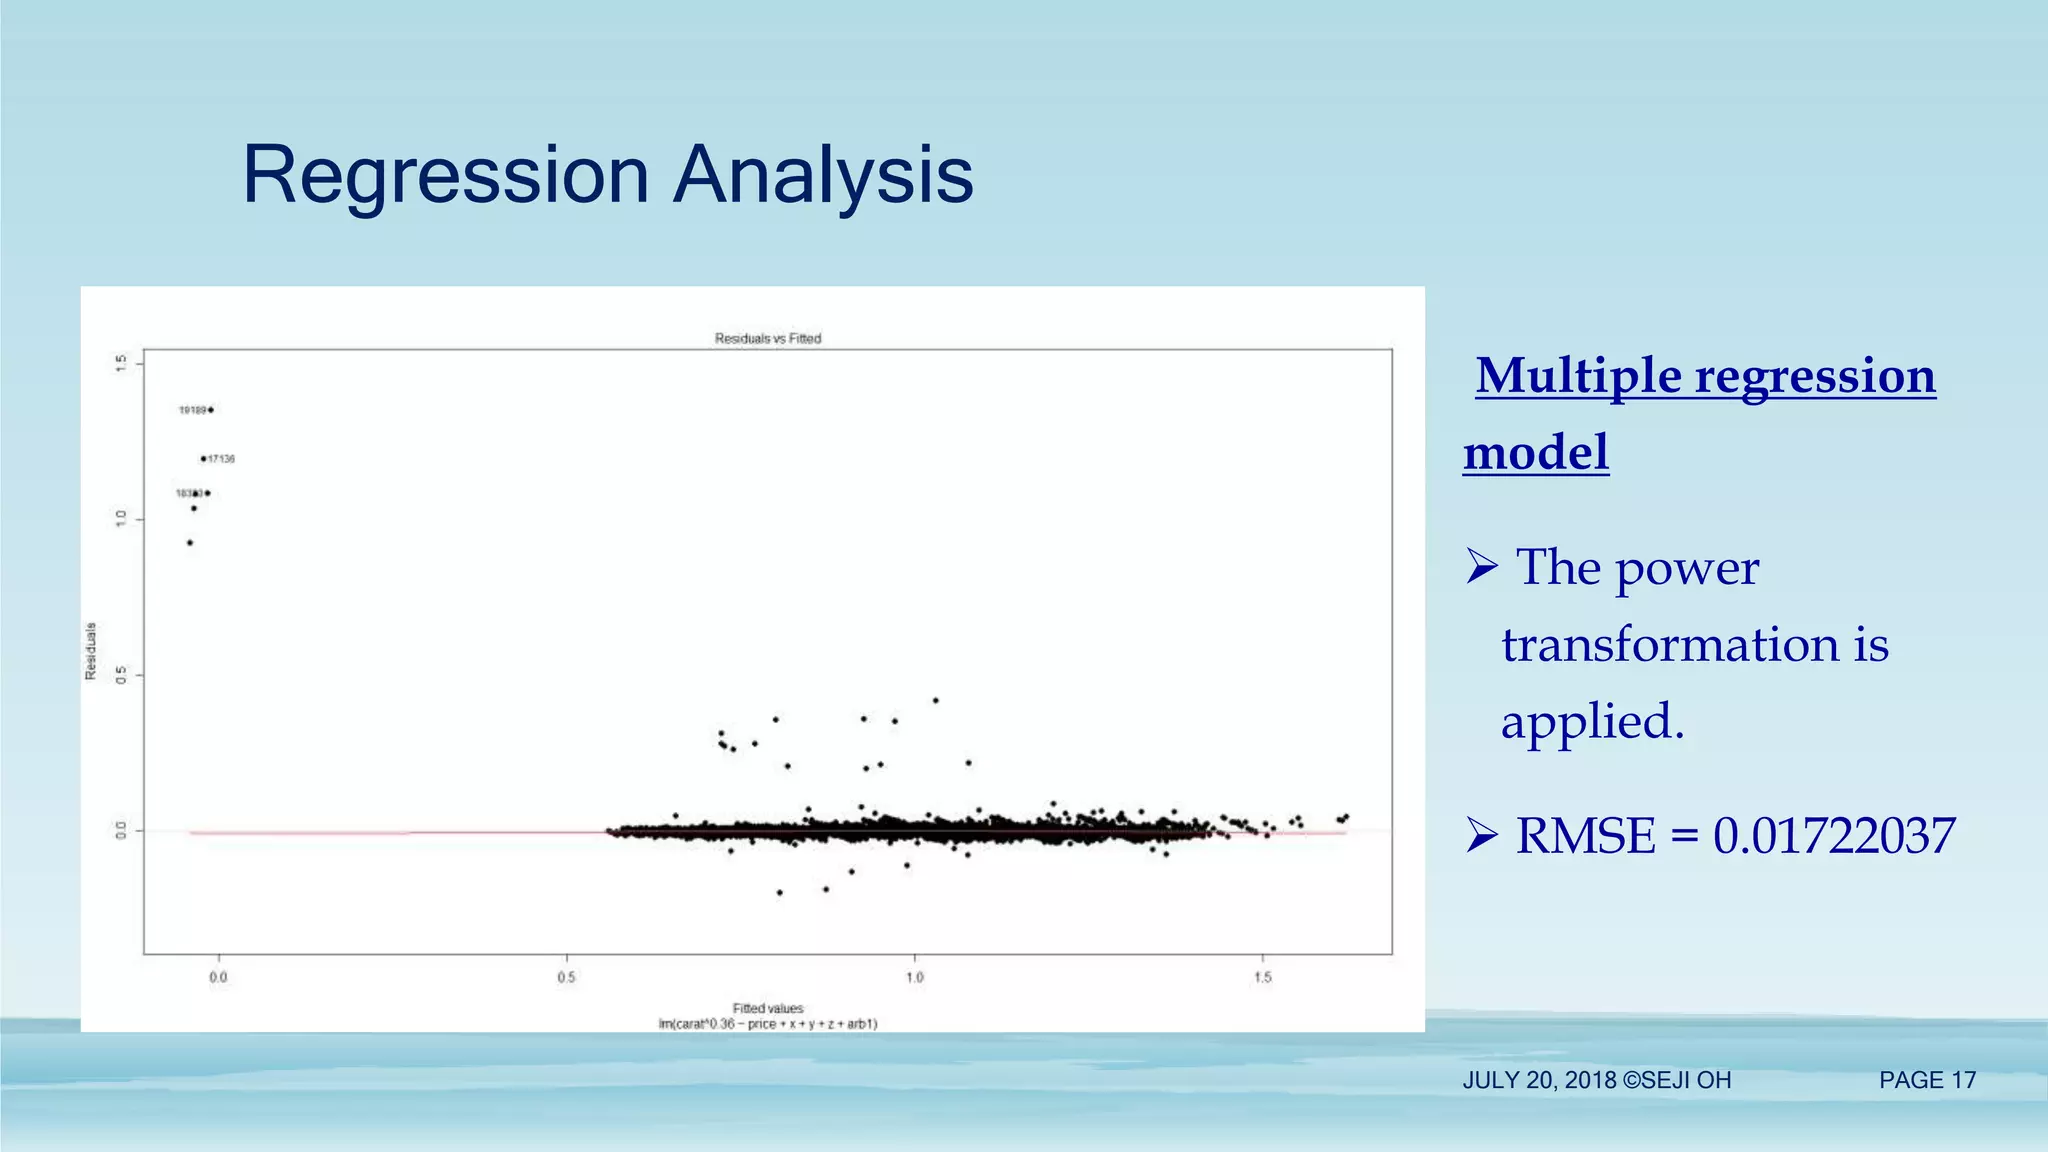
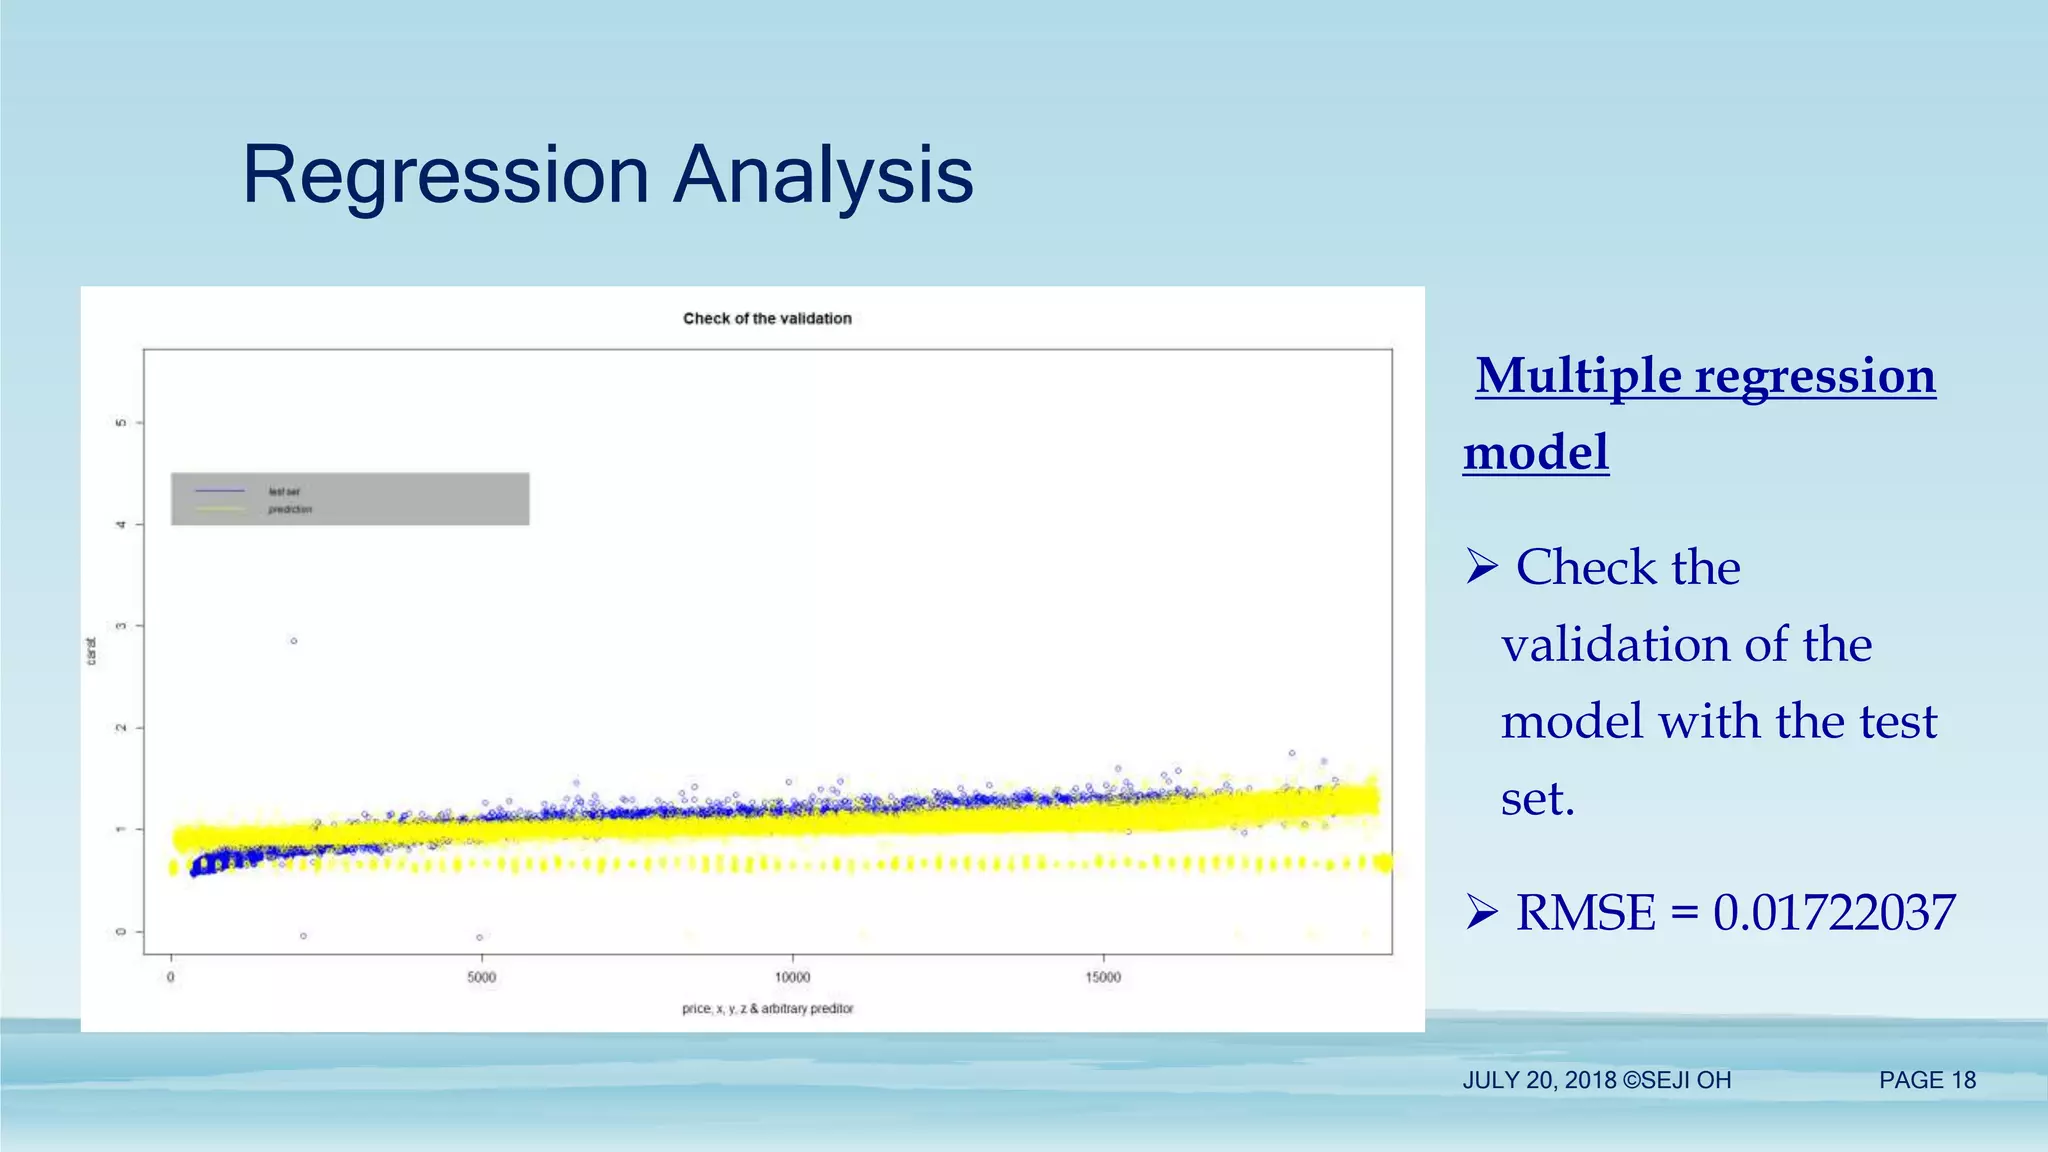
The document discusses data visualization techniques, including Minard's plot of Napoleon’s troops and visualizing game log data from Starcraft using R. It also presents a regression analysis with datasets, detailing simple and multiple regression models, validation techniques, and the use of ggplot2 and tidyverse packages. References to external sources and guides related to the discussed topics are provided.


![[DSC Europe 25] Dobrica Cosic - Savings by the Second: How Dynamic Pricing an...](https://cdn.slidesharecdn.com/ss_thumbnails/znp09f3smtqz3w2sq6wn-1-dobrica-cosic-savings-by-the-second-how-dynamic-pricing-and-smart-data-are-bu-251208151905-26e6f41e-thumbnail.jpg?width=640&height=640&fit=bounds)
![[DSC Europe 25] Imai Jen-La Plante - The New Generation: AI and the Future of...](https://cdn.slidesharecdn.com/ss_thumbnails/kxi8t2l5rggivgcenyba-1-jenlaplante-dsc-251208152532-d1e076c2-thumbnail.jpg?width=640&height=640&fit=bounds)
![[DSC Europe 25] Branko Urosevic -Rethinking Financial Talent: Integrating Cod...](https://cdn.slidesharecdn.com/ss_thumbnails/8jjrus8ttko6qj64f58f-3-251212103250-642c6374-thumbnail.jpg?width=640&height=640&fit=bounds)
![[DSC Europe 25] Branko Dzakula - From Defense to Attack: How AI Redefines Cyb...](https://cdn.slidesharecdn.com/ss_thumbnails/80bdzdxpr3ky2g0qvyk9-8-251211083048-ce5fc1ee-thumbnail.jpg?width=640&height=640&fit=bounds)
![[DSC Europe 25] Dragana Ilic - AI for Big Data in Astronomy.pptx](https://cdn.slidesharecdn.com/ss_thumbnails/8palya86qaatvjhva1ms-2-dragana-ilic-ai-ilic-251208151906-652b819c-thumbnail.jpg?width=640&height=640&fit=bounds)
![[DSC Europe 25] Hans Kleinsman - The Compliance Gearbox: How Tax Tech Mediate...](https://cdn.slidesharecdn.com/ss_thumbnails/dxdytie1toel0hr90bjs-2-251212103250-174fdbe7-thumbnail.jpg?width=640&height=640&fit=bounds)


![[DSC Europe 25] Kaja Kandare - LLM as a judge.pptx](https://cdn.slidesharecdn.com/ss_thumbnails/arxyccaxsdsd1ba99wjw-7-251212104007-2b4e3f64-thumbnail.jpg?width=640&height=640&fit=bounds)
![[DSC Europe 25] Debmalya Biswas - Agentification: the art of transforming man...](https://cdn.slidesharecdn.com/ss_thumbnails/r5azlggvtqiaiiusrqdr-4-251212103249-5a12c89b-thumbnail.jpg?width=640&height=640&fit=bounds)


![[DSC Europe 25] Aleksandra Dragicevic - AI-Boosted Research in Healthcare: Fr...](https://cdn.slidesharecdn.com/ss_thumbnails/iqwngszurf2r7pi1lnnj-4-aleksandra-dragicevic-ad-dsc-europe-conference-20-251208151905-37c3238a-thumbnail.jpg?width=640&height=640&fit=bounds)
![[DSC Europe 25] Ivan Peric - Intelligence Swarm Logic and Techno-Functional M...](https://cdn.slidesharecdn.com/ss_thumbnails/7my7c97fsduiccadgavw-2-251212103249-5a03f7c6-thumbnail.jpg?width=640&height=640&fit=bounds)
