Download to read offline

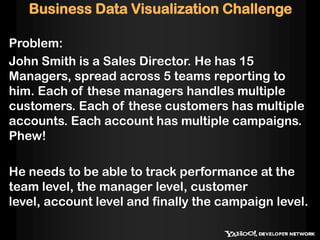


John Smith needs to track performance across multiple levels of his business. A possible solution is a multi-level drill-down tree-map/heatmap visualization that allows viewing performance at the team, manager, customer, account, and campaign levels. This could be built using the YUI and D3 JavaScript libraries.


