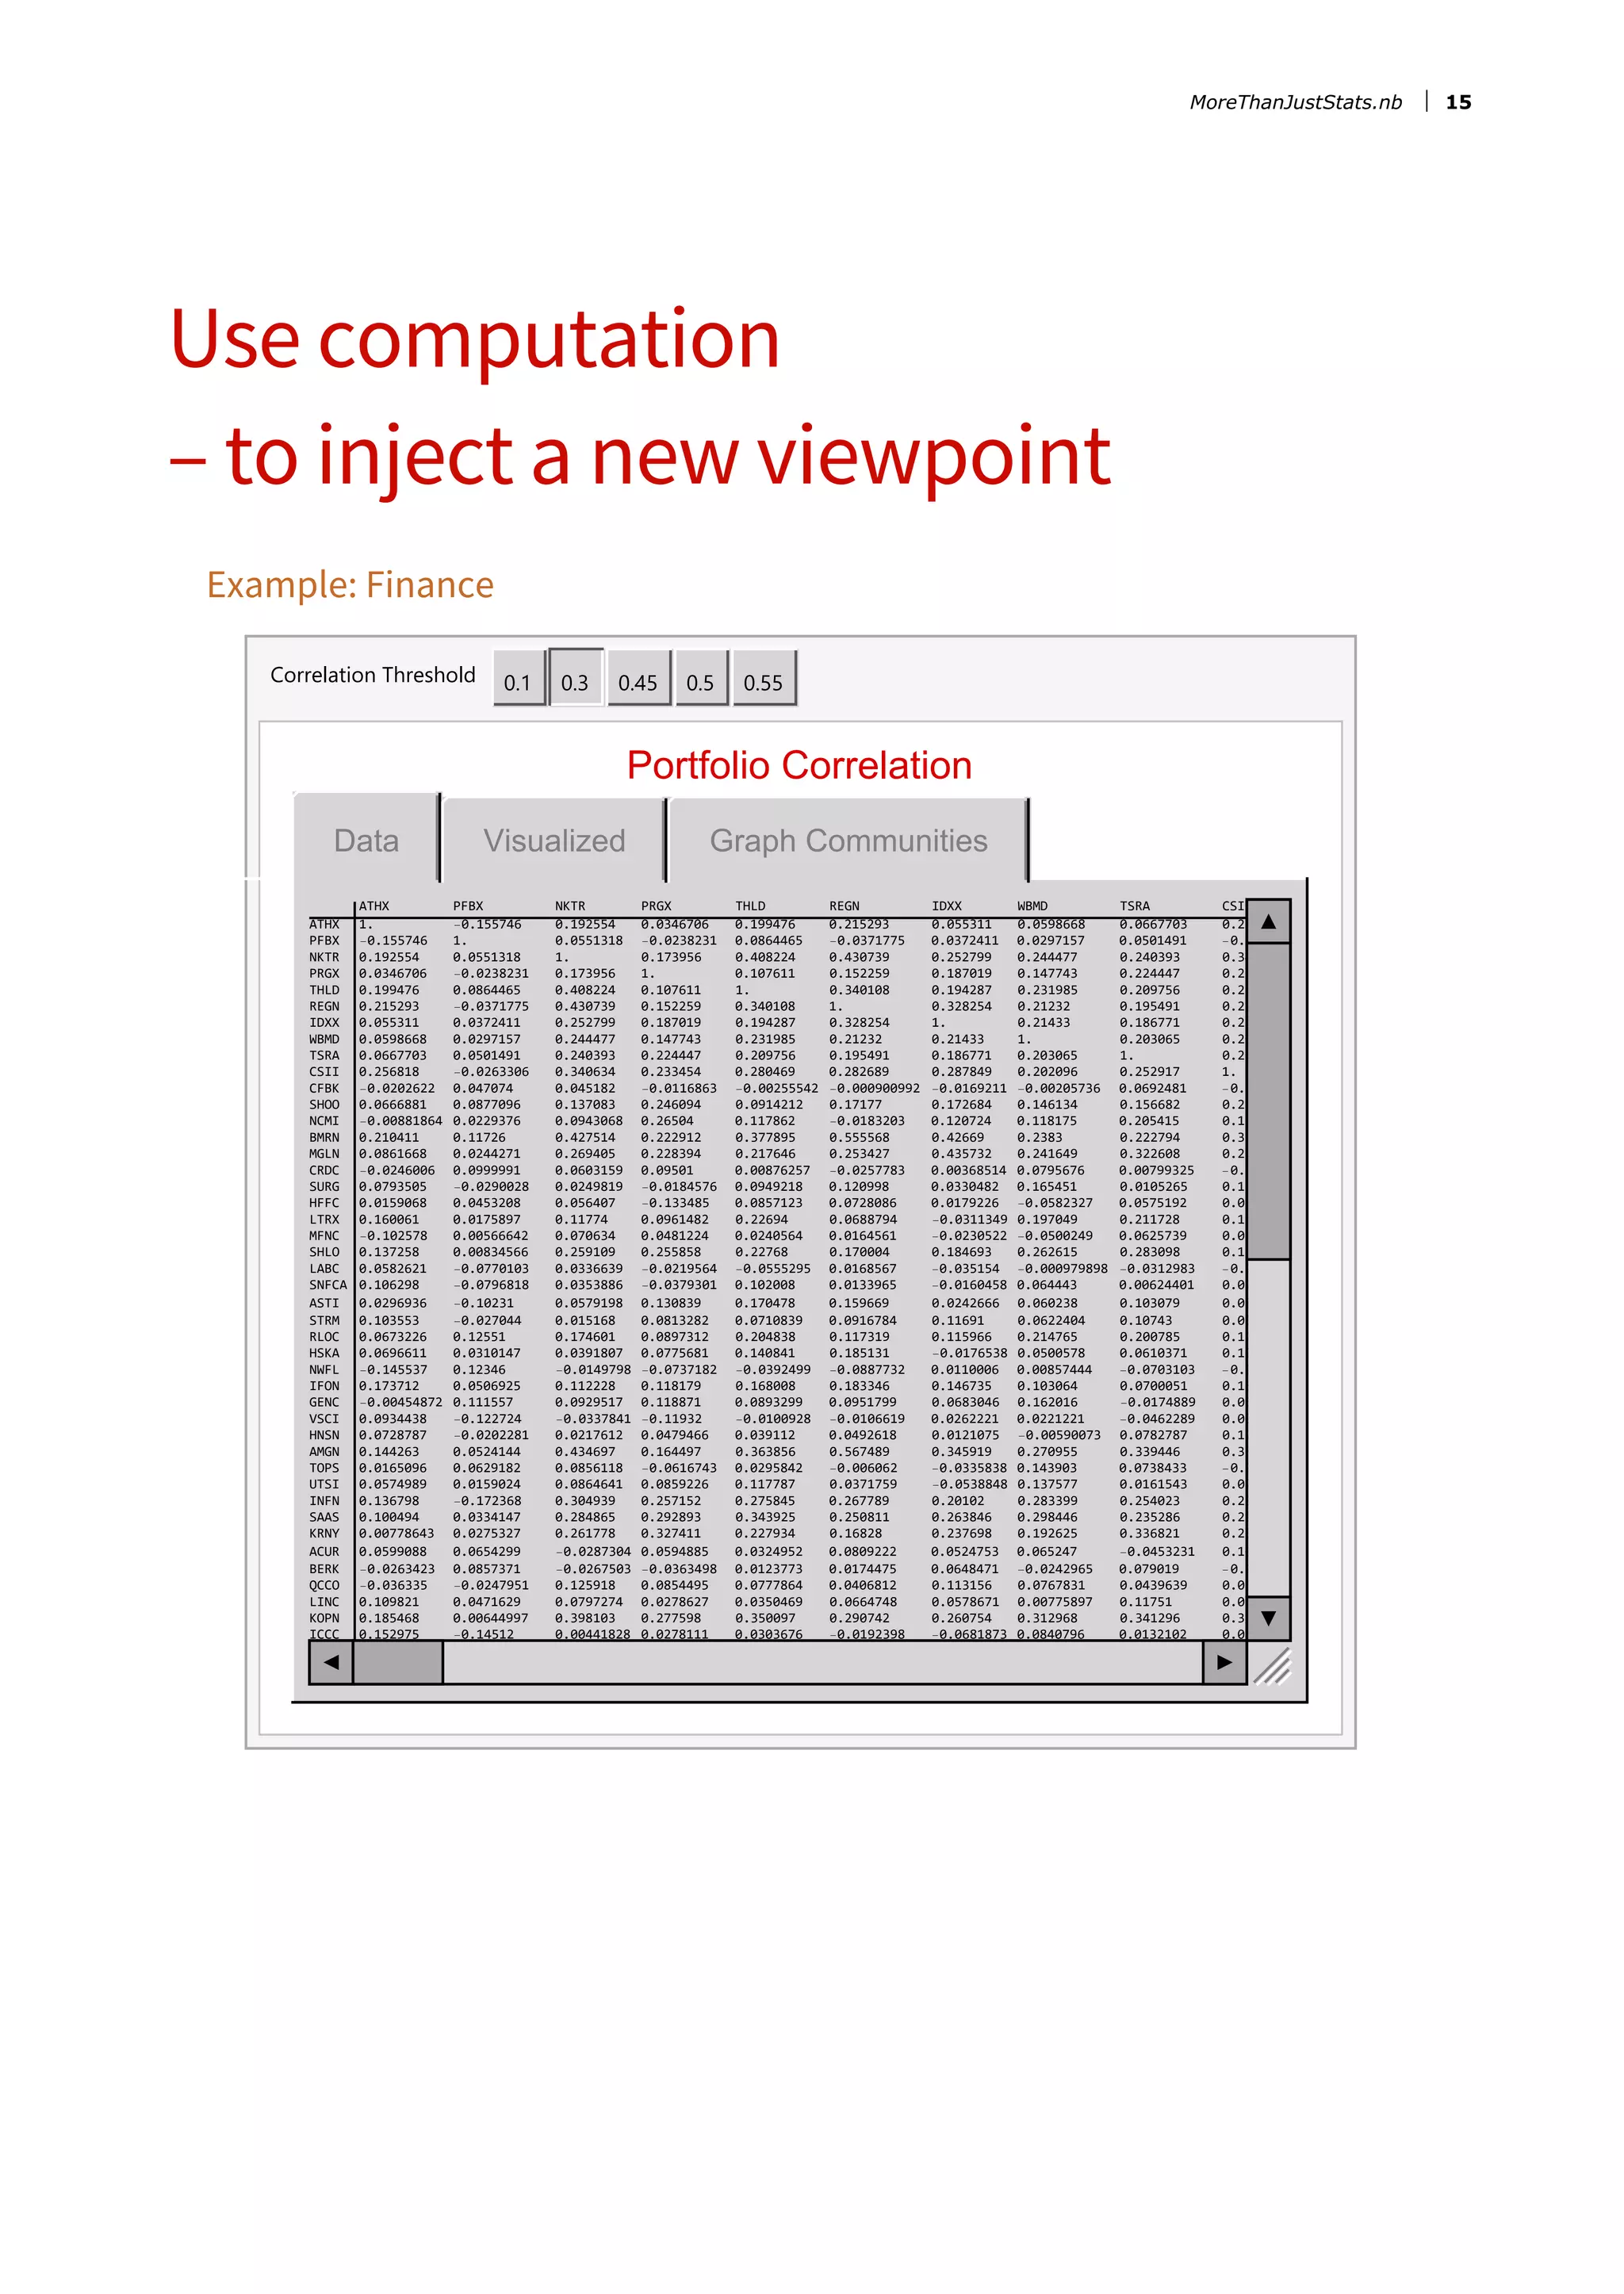
This document discusses how data science involves more than just statistics. It provides examples of how computation can be used to find things to count in text and images, inject context using data from London bike stations and car accident data, change viewpoints such as analyzing data from a supersonic car, and inject new viewpoints like exploring finance portfolio correlations. Computation is a key part of data science that involves techniques beyond just statistics like machine learning, visualization, and other domains.


![Use computation
– to find things to count
Example: Text
Out[ ]=
Word frequency in Lord of the Flies
In[ ]:= MaximalBy[TextSentences[lotf], Classify["Sentiment", #, {"Probability", "Positive"}] &]
Out[ ]= {We are going to have fun on this island!}
MoreThanJustStats.nb 5](https://image.slidesharecdn.com/71500wolfram-180502064735/75/Data-Science-Is-More-Than-Just-Statistics-5-2048.jpg)
![Out[ ]=
Example: Images
In[1]:= image =
6 MoreThanJustStats.nb](https://image.slidesharecdn.com/71500wolfram-180502064735/75/Data-Science-Is-More-Than-Just-Statistics-6-2048.jpg)
![In[2]:= TabView
"Blobs" → i = Image[Rasterize[Graphics[{Disk[], Disk[{0.7, 0}, 1]}]]],
"Distances" → i2 = ImageAdjust@DistanceTransform[ColorNegate@i],
"Maxima" → Dilation[MaxDetect[i2], 2]
Out[2]=
Blobs Distances Maxima
In[4]:= Showimage, GraphicsText[Style["×", FontColor → White], #] & /@
idata = DeleteDuplicates[Last /@ ComponentMeasurements[
MaxDetect[DistanceTransform[DistanceTransform[DeleteSmallComponents[
ColorNegate[DeleteSmallComponents[Binarize[image]]], 100]]]],
"Centroid"], EuclideanDistance[##] < 6 &]
Out[4]=
×
××
× ××
×
×
×
× ×× ×× × ×× × ×× × ×× × ××
× ×
×
MoreThanJustStats.nb 7](https://image.slidesharecdn.com/71500wolfram-180502064735/75/Data-Science-Is-More-Than-Just-Statistics-7-2048.jpg)
![In[5]:= SmoothHistogram3D[idata, BoxRatios → {3, 2, 1}]
Out[5]=
8 MoreThanJustStats.nb](https://image.slidesharecdn.com/71500wolfram-180502064735/75/Data-Science-Is-More-Than-Just-Statistics-8-2048.jpg)
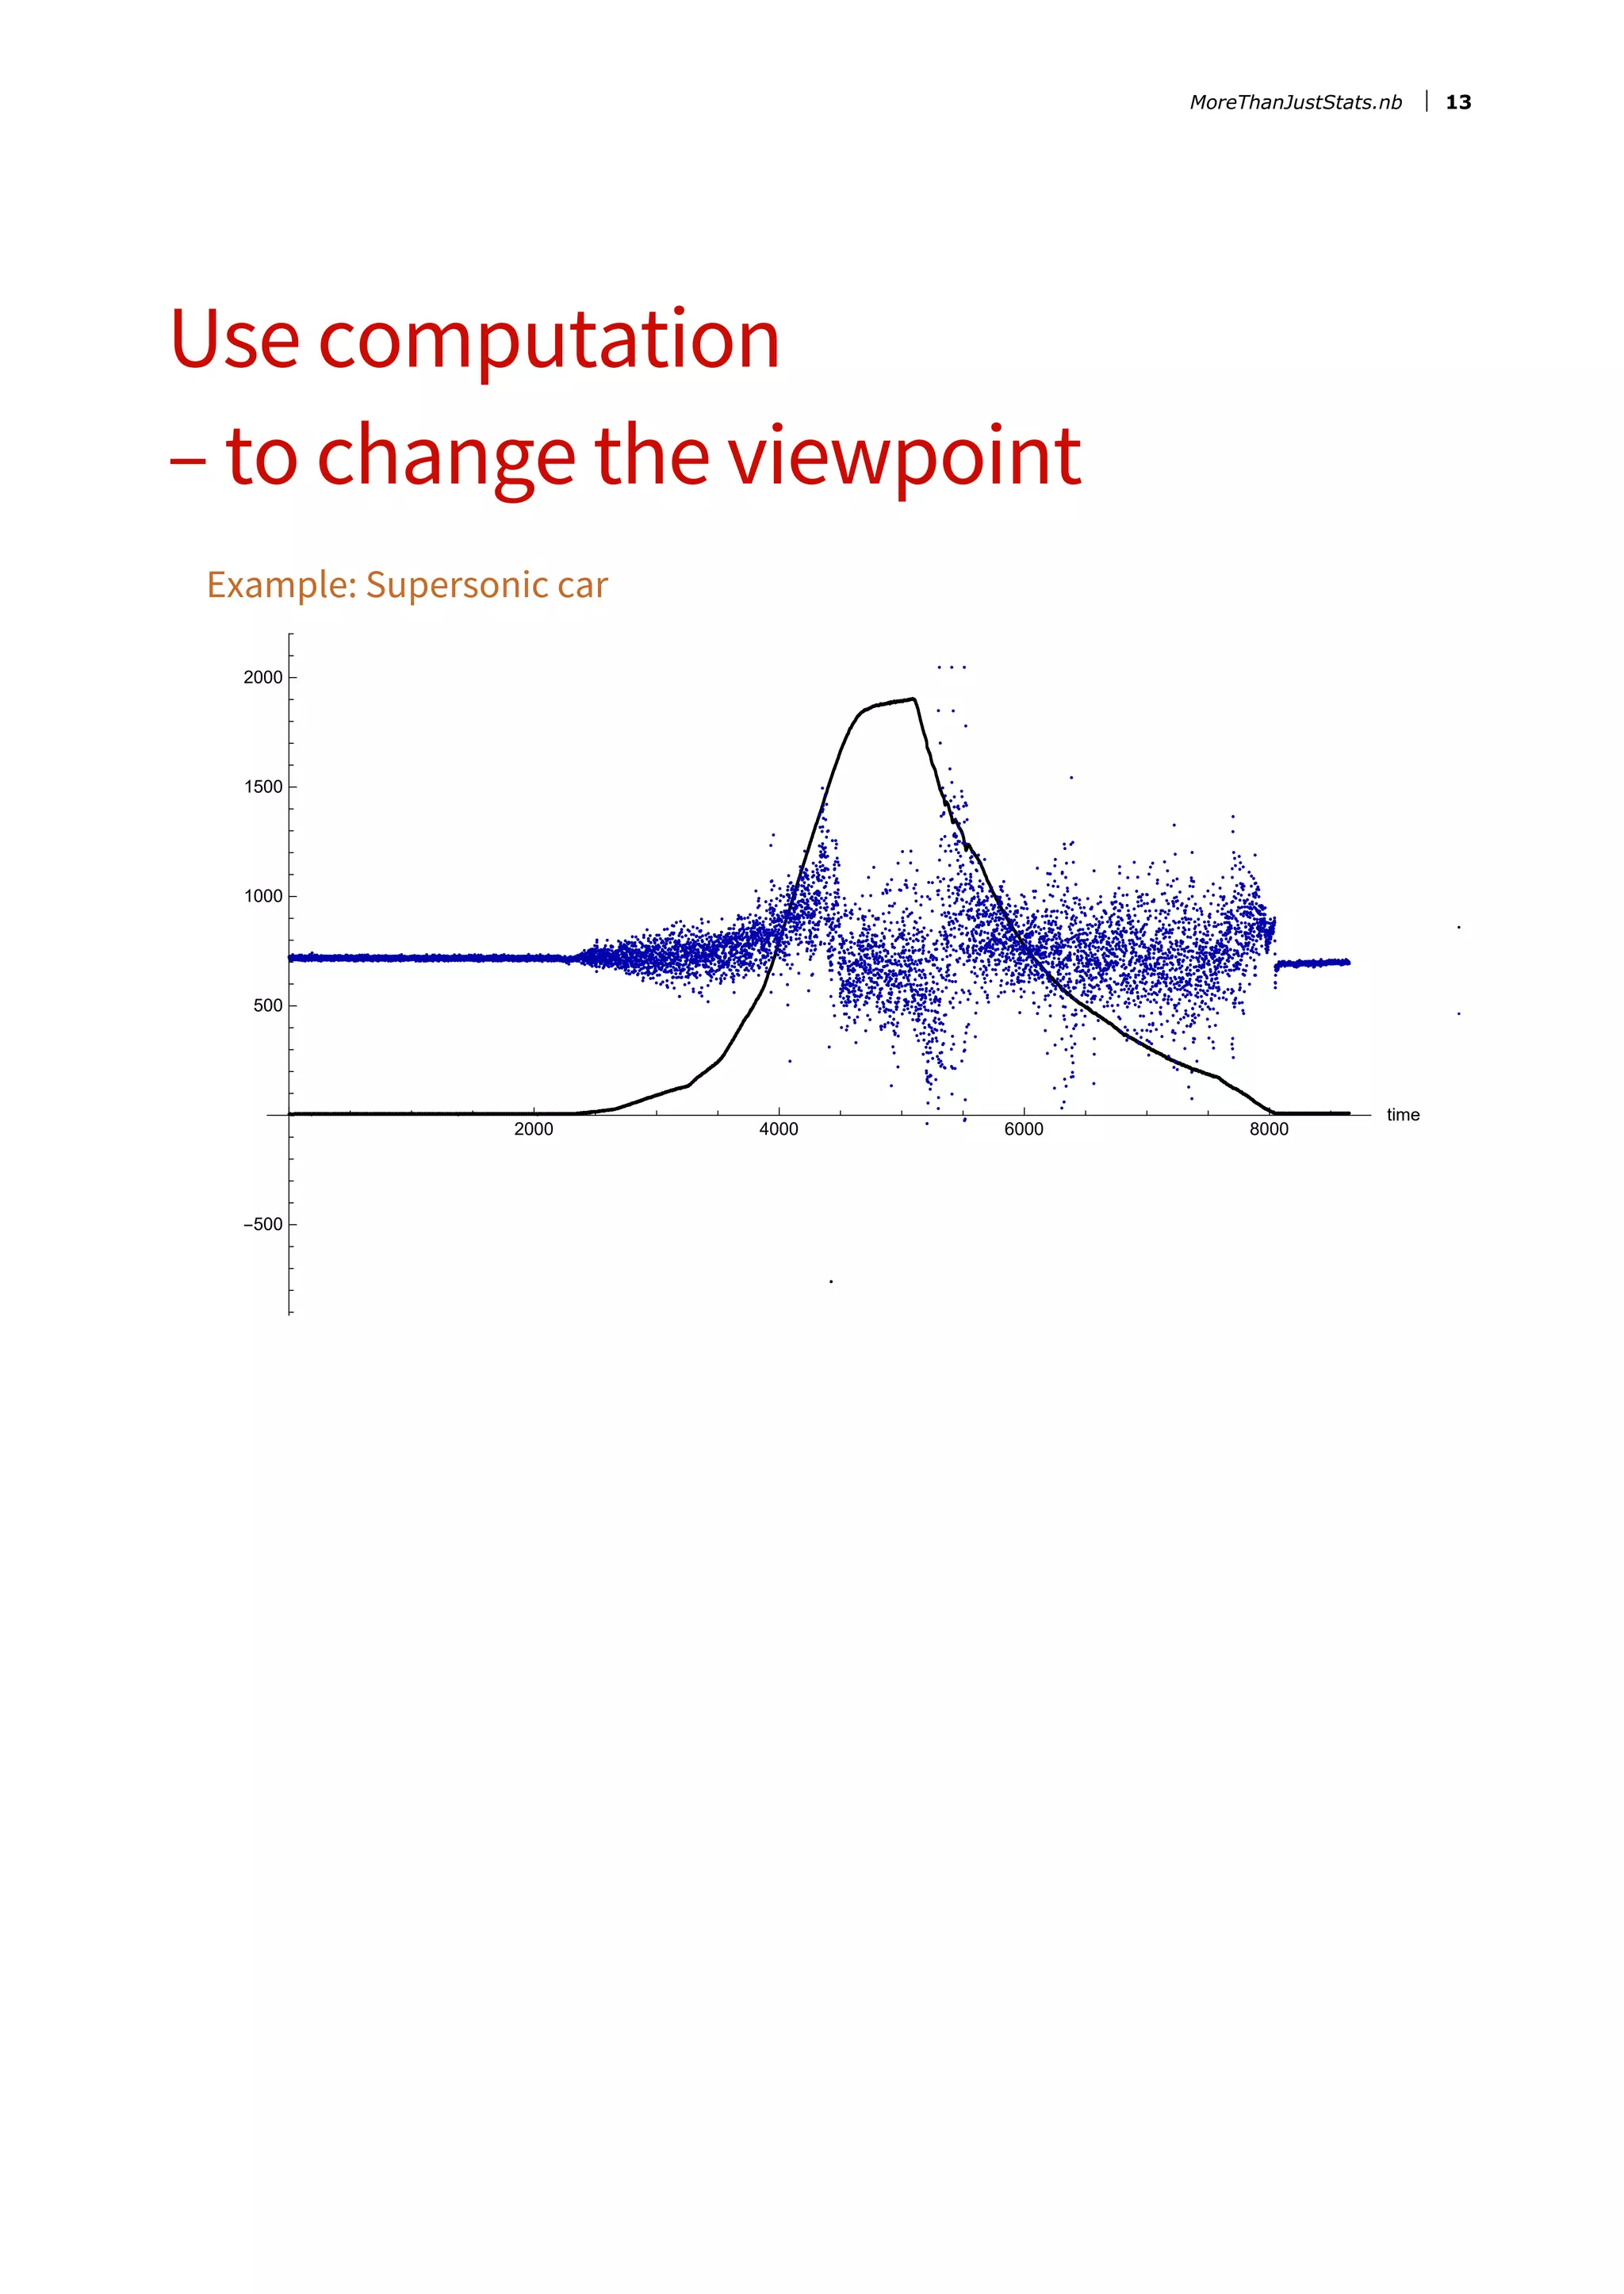
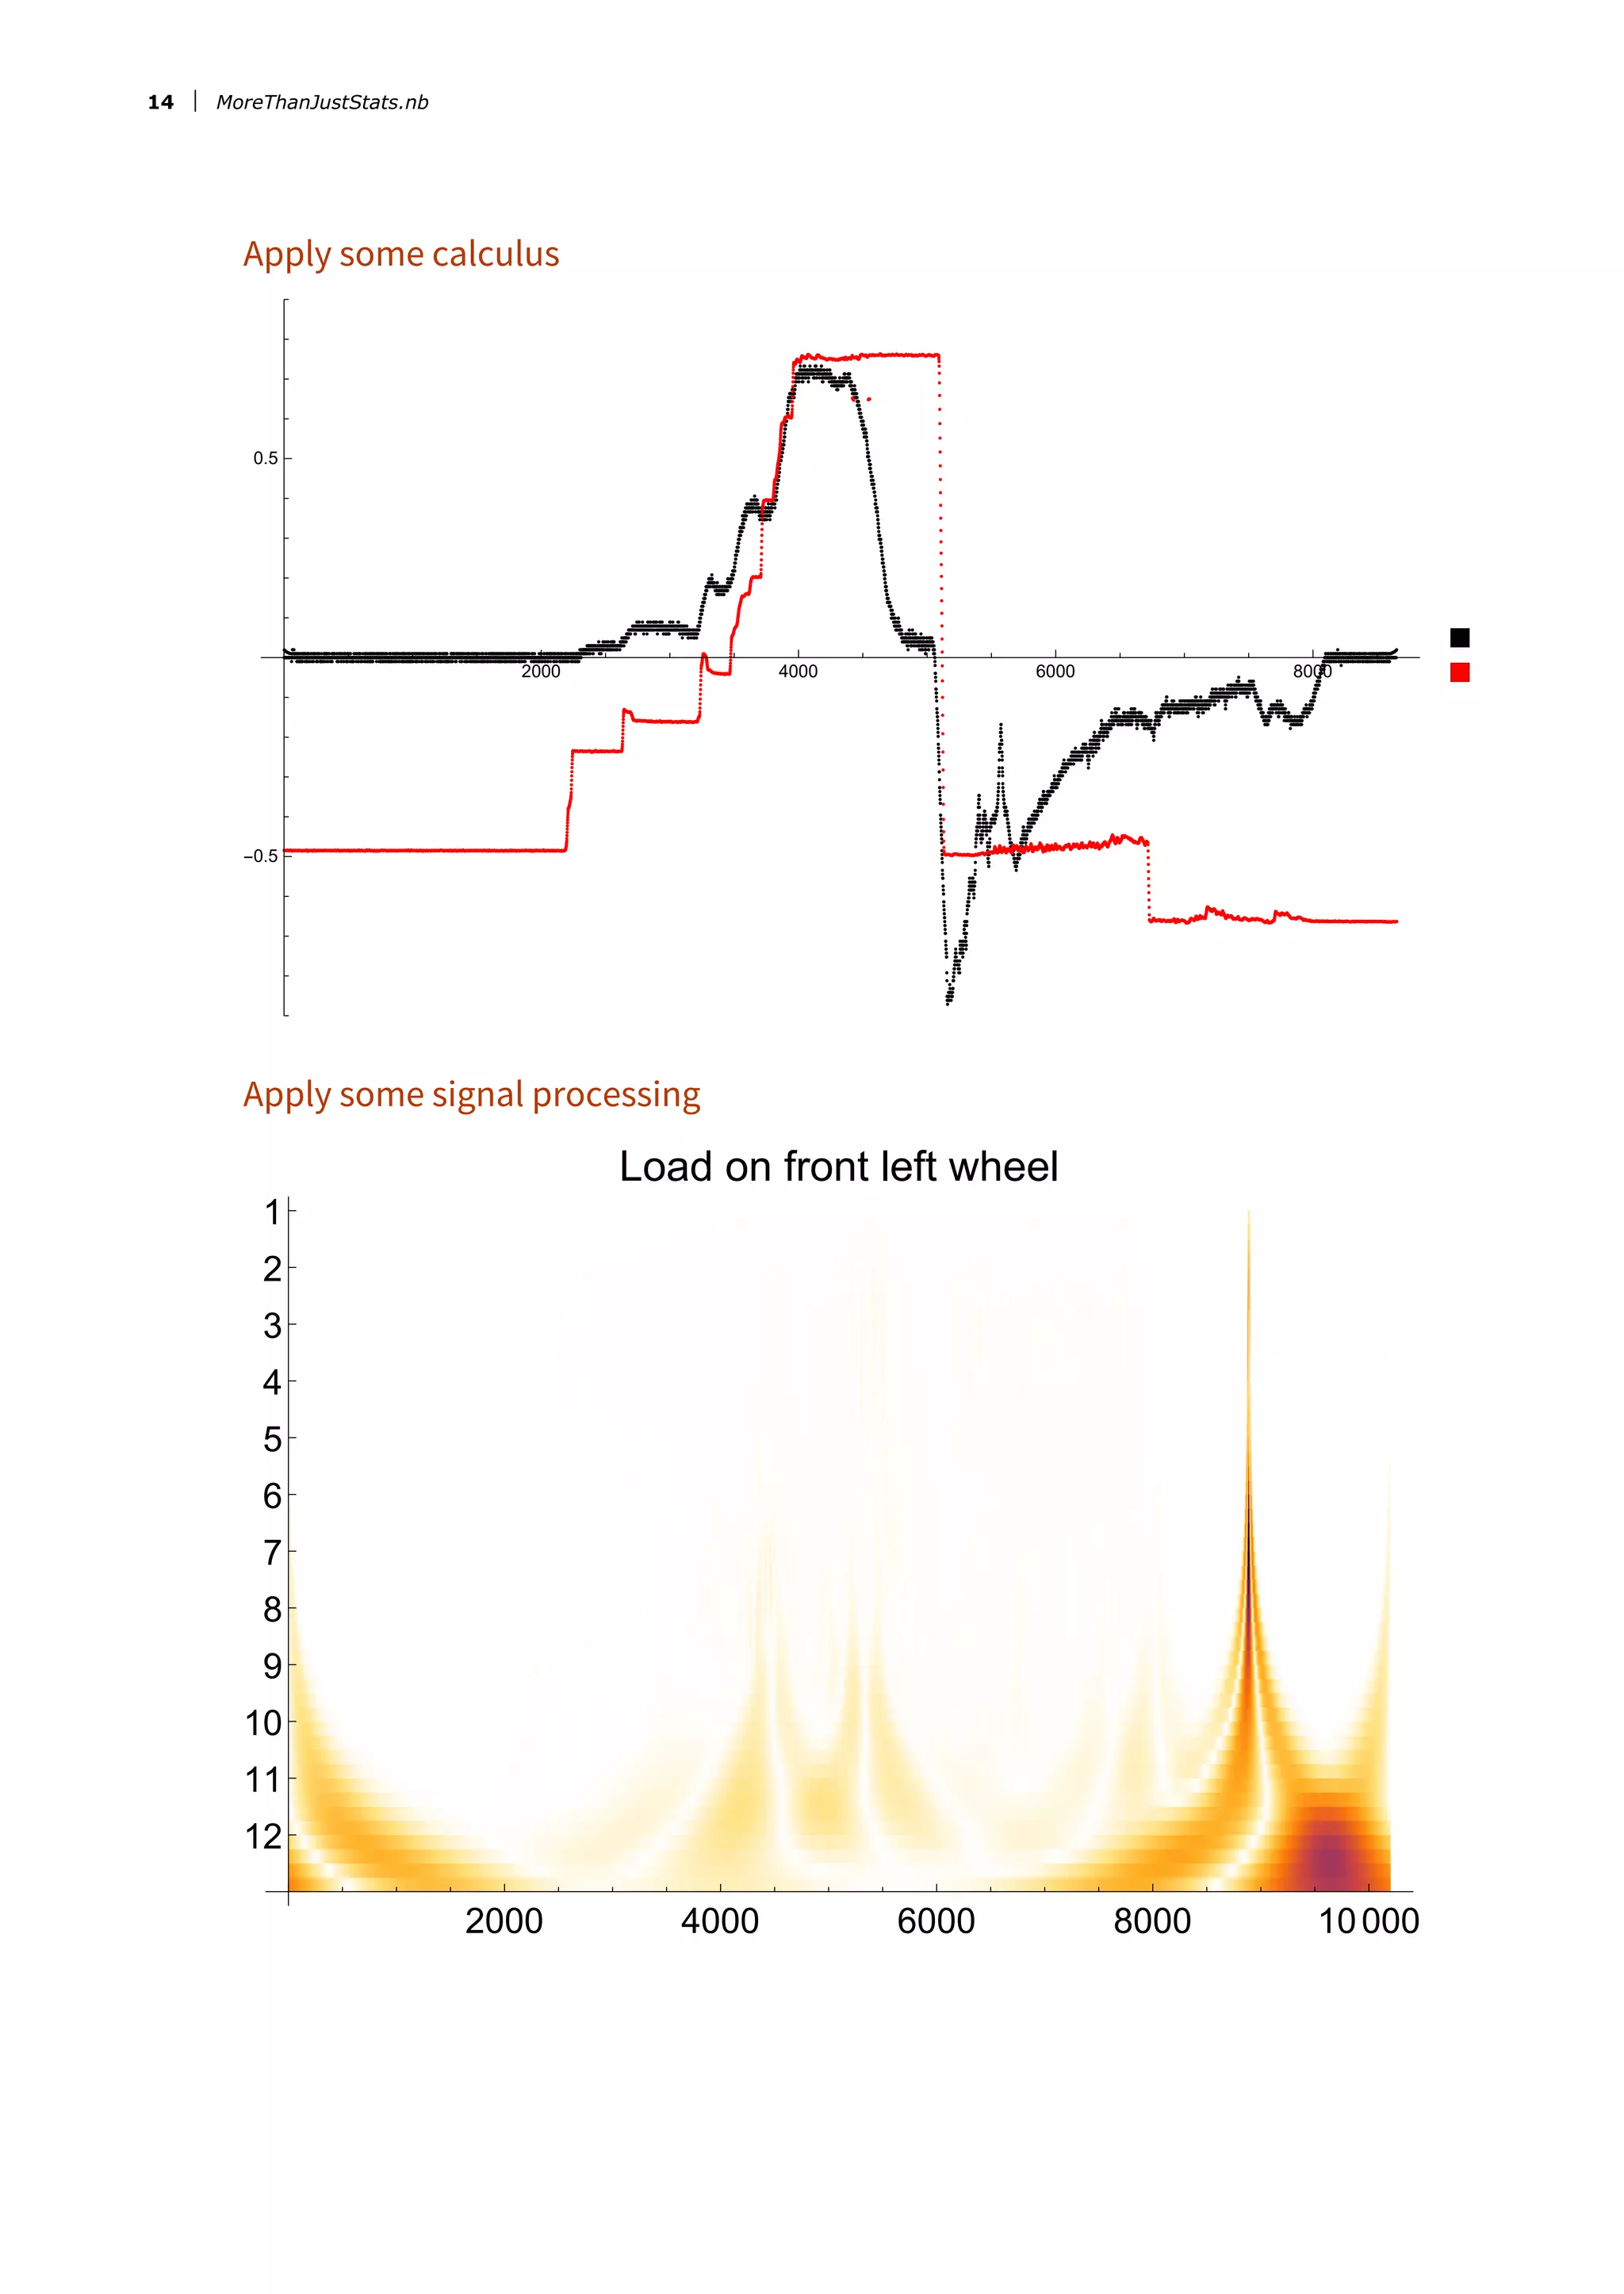
![Use computation
– to inject context
Example: London bikes
In[15]:= currentBikeData = Import["http://api.citybik.es/barclays-cycle-hire.json"];
In[16]:= currentBikeData[[1]]
Out[16]= {bikes → 10, name → 000989 - Murray Grove , Hoxton, idx → 0, lat → 51 530 890,
timestamp → 2018-04-25T12:11:42.632000Z, lng → -89 782, id → 0, free → 17, number → 63}
In[13]:= Dataset[Association /@ currentBikeData]
Out[13]=
△
▽
bikes name idx
10 000989 - Murray Grove , Hoxton 0
8 200069 - Knaresborough Place, Earl's Court 1
0 300057 - Westbourne Park Road, Portobello 2
29 000981 - British Museum, Bloomsbury 3
8 001083 - Commercial Street, Shoreditch 4
8 001027 - Warwick Avenue Station, Maida Vale 5
25 000971 - Godliman Street, St. Paul's 6
27 000974 - Guilford Street , Bloomsbury 7
6 001060 - Torrens Street, Angel 8
9 001038 - Harrington Square 1, Camden Town 9
1 001070 - Bricklayers Arms, Borough 10
12 001047 - Falkirk Street, Hoxton 11
0 001041 - Westbourne Grove, Bayswater 12
18 001042 - Woodstock Street, Mayfair 13
14 001049 - Finsbury Leisure Centre, St. Luke's 14
4 001037 - Park Lane , Hyde Park 15
15 001050 - Park Road (Baker Street), The Regent's Park 16
7 000973 - Bethnal Green Road, Shoreditch 17
17 001053 - Clerkenwell Green, Clerkenwell 18
9 001078 - Lambeth Road, Vauxhall 19
showing 1–20 of 784
MoreThanJustStats.nb 9](https://image.slidesharecdn.com/71500wolfram-180502064735/75/Data-Science-Is-More-Than-Just-Statistics-9-2048.jpg)
![In[14]:= Legended
GeoGraphicsAbsolutePointSize[10], ColorData["DarkRainbow"]
#1[[2]] 0.001 + #1[[2]] + #1[[3]], Point[#[[1]]] & /@
QuietGeoPosition{"lat", "lng"} 1 000 000., "bikes", "free" /.
currentBikeData, PlotLabel → "Availability of bicycles in London",
ImageSize → 600, BarLegend[{"DarkRainbow", {0, 35}}]
Out[14]=
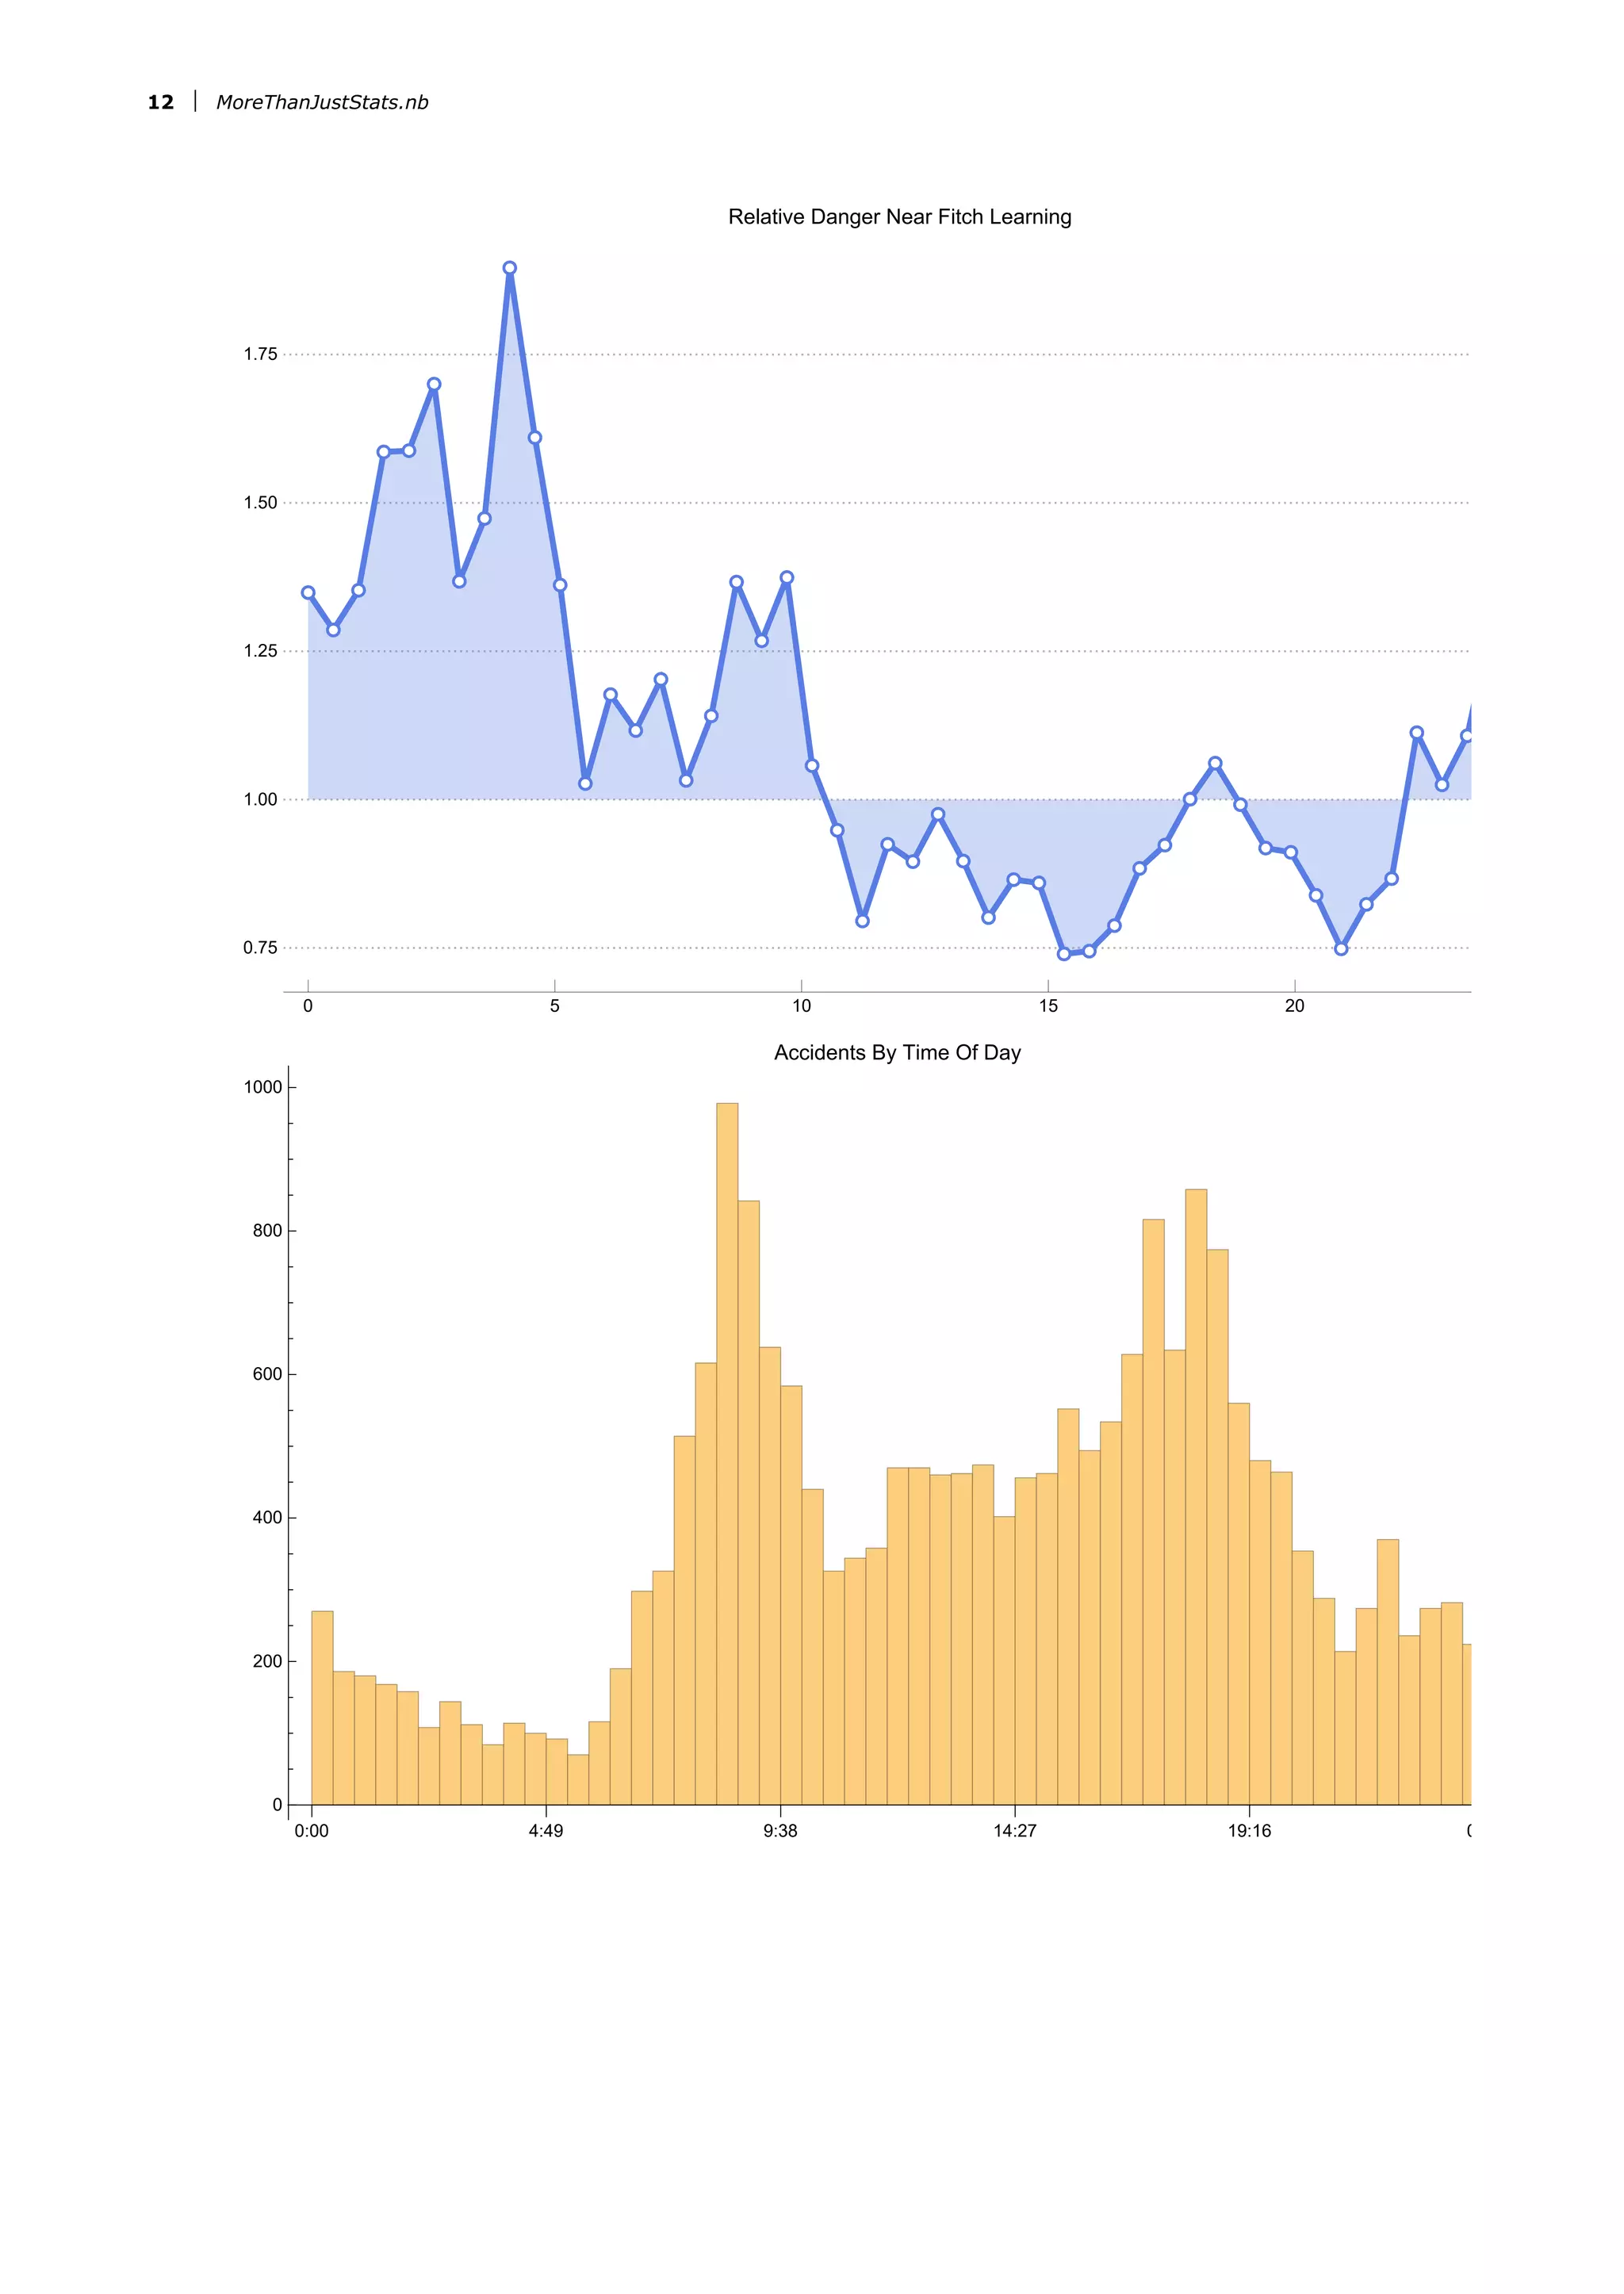
Example: Accidents
Data Local density Local points All density
10 MoreThanJustStats.nb](https://image.slidesharecdn.com/71500wolfram-180502064735/75/Data-Science-Is-More-Than-Just-Statistics-10-2048.jpg)


![The role of automation
– making computation easier
Example: Titanic
In[ ]:= Short[tData = ExampleData[{"MachineLearning", "Titanic"}, "Data"]]
Out[ ]//Short= {{1st, 29., female} → survived,
{1st, 0.9167, male} → survived, 1306, {3rd, 29., male} → died}
In[ ]:= titanicSurvival = Classify[tData]
Out[ ]= ClassifierFunction
Input type: {Nominal, Numerical, Nominal}
Classes: died, survived
In[ ]:= titanicSurvival[{"1st", 46, "male"}]
Out[ ]= died
In[ ]:= Plot[titanicSurvival[{"1st", age, "male"}, {"Probability", "died"}], {age, 0, 60}]
Out[ ]=
10 20 30 40 50 60
0.4
0.5
0.6
0.7
MoreThanJustStats.nb 21](https://image.slidesharecdn.com/71500wolfram-180502064735/75/Data-Science-Is-More-Than-Just-Statistics-21-2048.jpg)
![Example: Day & night
In[ ]:= daynight = Classify
→ "Night", → "Day", → "Night", → "Night", → "Day",
→ "Night", → "Day", → "Day", → "Night", → "Night",
→ "Day", → "Night", → "Night", → "Day", → "Night",
→ "Night", → "Day", → "Day", → "Day", → "Day",
→ "Night", → "Night", → "Day", → "Night", → "Night",
→ "Day", → "Day", → "Day", → "Night", → "Day"
Out[ ]= ClassifierFunction
Input type: Image
Classes: Day, Night
In[ ]:= daynight , , ,
, ,
Out[ ]= {Day, Night, Day, Night, Night, Night}
22 MoreThanJustStats.nb](https://image.slidesharecdn.com/71500wolfram-180502064735/75/Data-Science-Is-More-Than-Just-Statistics-22-2048.jpg)
![Example: No supervision - “Hands off the wheel”
Dogs
In[ ]:= Dataset[dogs]
Out[ ]=
24 MoreThanJustStats.nb](https://image.slidesharecdn.com/71500wolfram-180502064735/75/Data-Science-Is-More-Than-Just-Statistics-24-2048.jpg)
![In[ ]:= FeatureSpacePlot[Take[dogs, 60], LabelingSize → 70]
Out[ ]=
In[ ]:= nearestDog = FeatureNearest[dogs]
Out[ ]= NearestFunction
Input type: Image
Output property: Element
Unable to store data in notebook.
In[ ]:= Grid[{testDogs, First /@ nearestDog[testDogs]}]
Out[ ]=
MoreThanJustStats.nb 25](https://image.slidesharecdn.com/71500wolfram-180502064735/75/Data-Science-Is-More-Than-Just-Statistics-25-2048.jpg)


![The role of automation
– after the computation
Deployment
Firewall
App deployment
bikeApp = DynamicModule
{url = "http://api.citybik.es/barclays-cycle-hire.json", city = "London"},
ColumnActionMenu"Choose city", SortBy"city" ⧴ city = "city";
url = "url" /.
Import["http://api.citybik.es/networks.json", "JSON"], First,
DynamicDataset[Association /@ Import[url, "JSON"]]
Legended[GeoGraphics[#, ImageSize → 600,
PlotLabel → "Availability of bicycles in " <> city],
BarLegend[{"DarkRainbow", {0, 100}}]] &,
AbsolutePointSize[10], ColorData["DarkRainbow"]#bikes #bikes + #free,
PointGeoPosition{#lat, #lng} 1 000 000. &,
SynchronousUpdating → False, TrackedSymbols ⧴ {url, city}
CloudDeploy[bikeApp, Permissions → "Public"]
28 MoreThanJustStats.nb](https://image.slidesharecdn.com/71500wolfram-180502064735/75/Data-Science-Is-More-Than-Just-Statistics-28-2048.jpg)
![API deployment
In[ ]:= CloudDeploy[
APIFunction[{"class" → "String", "age" → "Number", "sex" → "String"},
Function[titanicSurvival[{#class, #age, #sex}]],
AllowedCloudExtraParameters → All],
"TitanicPredictor",
Permissions → "Public"
]
Out[ ]= CloudObjecthttps://www.wolframcloud.com/objects/jonm/TitanicPredictor
In[ ]:= EmbedCode[%, "Java"]
Out[ ]=
Embeddable Code
Use the code below to call the Wolfram Cloud function from Java:
Code
Copy to Clipboard
if (_conn.getResponseCode() != 200) {
throw new IOException(_conn.getResponseMessage());
}
BufferedReader _rdr = new BufferedReader(new
InputStreamReader(_conn.getInputStream()));
StringBuilder _sb = new StringBuilder();
String _line;
while ((_line = _rdr.readLine()) != null) {
_sb.append(_line);
}
_rdr.close();
_conn.disconnect();
return _sb.toString();
}
}
MoreThanJustStats.nb 29](https://image.slidesharecdn.com/71500wolfram-180502064735/75/Data-Science-Is-More-Than-Just-Statistics-29-2048.jpg)


![Vibe Coding vs. Spec-Driven Development [Free Meetup]](https://cdn.slidesharecdn.com/ss_thumbnails/vibecodingvsspecdrivendevelopment-251209105622-43f455e7-thumbnail.jpg?width=640&height=640&fit=bounds)


