Downloaded 10 times
![ed in two cat-
egories: supervised and unsupervised [1]. The two approaches dier in the data
5](https://image.slidesharecdn.com/data-mining-for-prediction-of-aircraft-component-replacement2710-140909094826-phpapp01/75/Data-mining-for-prediction-of-aircraft-component-replacement-14-2048.jpg)
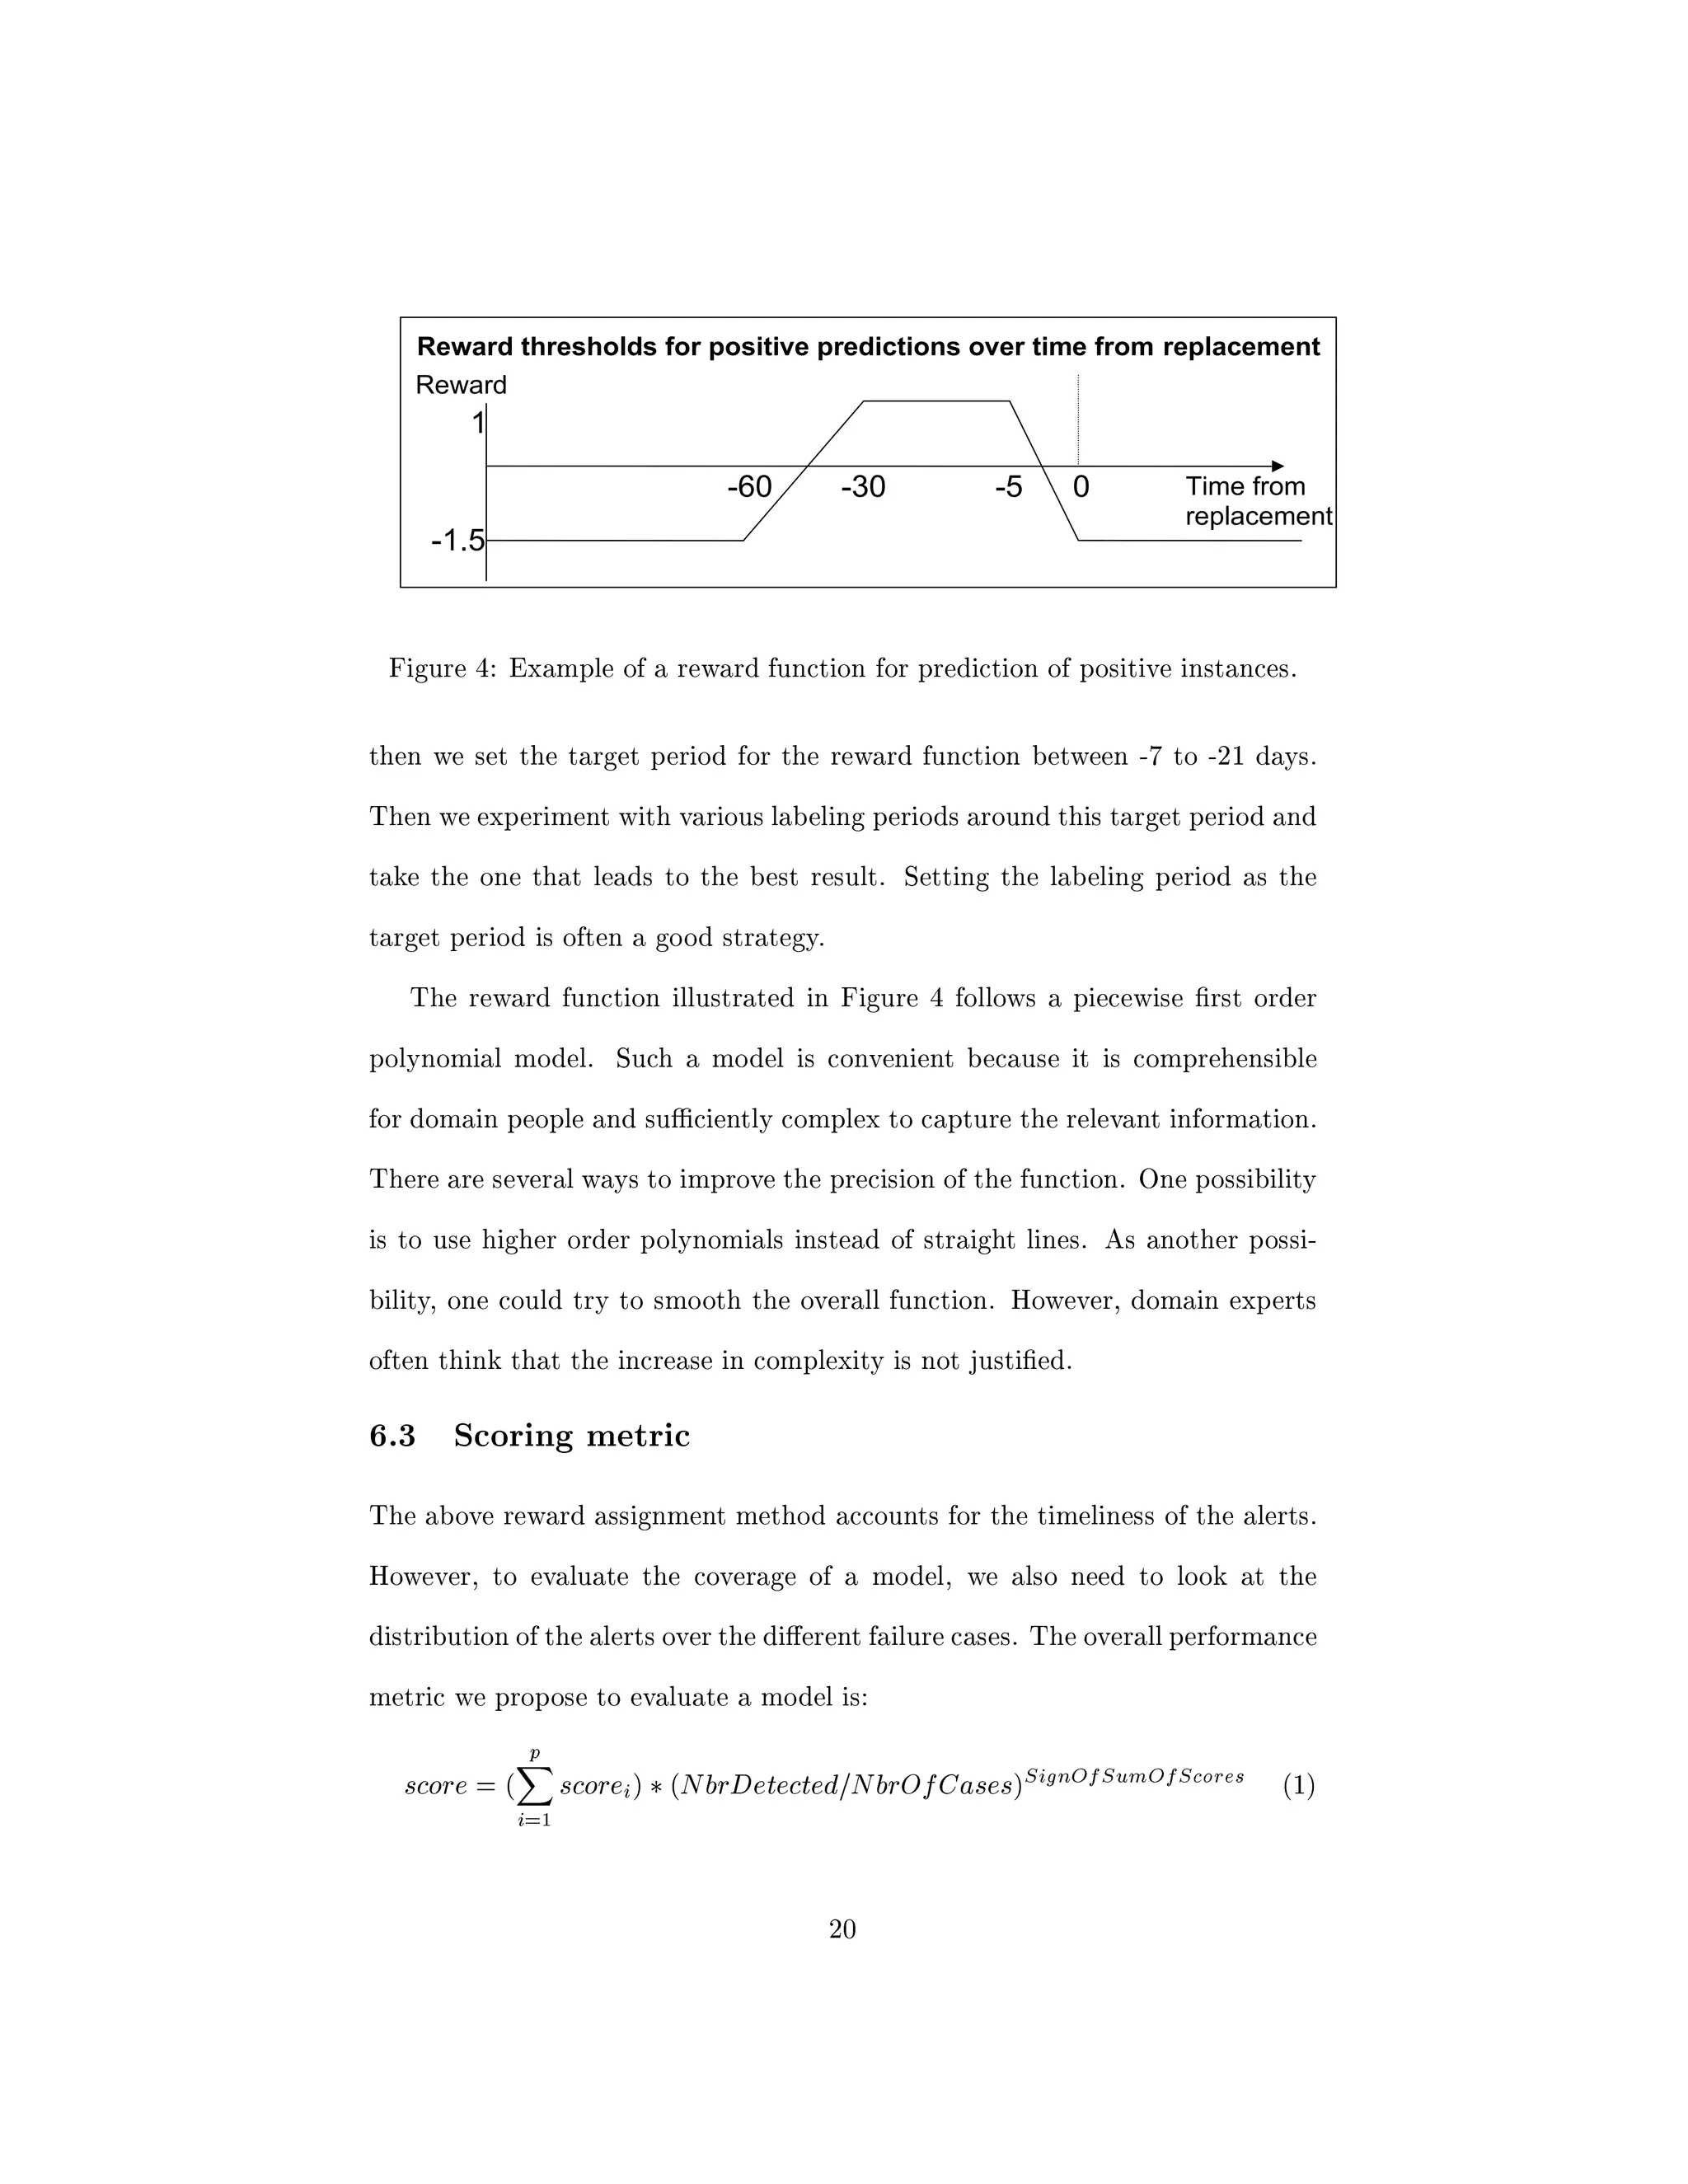

The document presents an approach to using data mining techniques to build predictive models for predicting the need to replace aircraft components using data collected from aircraft sensors. It addresses four key challenges: selecting relevant data from the multiple datasets generated by aircraft, automatically labeling examples with classification values, evaluating models while accounting for dependencies between examples, and combining results from models built on different datasets. The approach was applied to predict problems for various aircraft components using over 3 years of data from 34 aircraft.