Who will collectthe data?
▹ Principal researcher
▹ Other people outside the
research team
▹ data collectors are paid for
their services
3
4.
4
When will thedata be
collected?
▹ Determine the month, day, and
sometimes even the hour for data
collection
▹ Include how long the data collection will
take
▹ If questionnaires will be used, they
should be pretested with people similar
to the potential research participants, to
determine the length of time for
completion of the instrument.
5.
5
Where will thedata be
collected?
▹ Optimum conditions should be sought.
▹ If the participants happen to be tired or
the room is too hot or too cold, the
answers that are provided may not be
valid.
▹ If questionnaires are being used
■ respondents can complete the
questionnaire while the researcher
remains in the same immediate or
general area
■ Respondents can complete the
6.
6
What data willbe collected?
▹ This question calls for a
decision to be made about the
type of data being sought.
▹ For example, if the researcher
is concerned with the way
crises affect people
“what” > persons’ behaviors or
responses in crises
7.
7
How will thedata be
collected?
▹ Research instrument
■ self-report questionnaire
■ Sophisticated physiological
instruments
■ Observation
■ Interviews
■ Scales
8.
8
Data Collection
Instruments
▹ Researchinstruments – facilitates the
observation and measurement of the
variables of interest
▹ Example:
■ physiological data- physiological
instrument
■ Observational data-
observational checklist
9.
9
Use of existinginstruments
▹ helps connect the present study with
the existing body of knowledge on
the variables
▹ Advantage:
■ Discussion on the validity and
reliability of the tool is available
■ Tested and widely used by
previous studies
10.
10
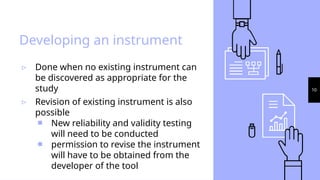
Developing an instrument
▹Done when no existing instrument can
be discovered as appropriate for the
study
▹ Revision of existing instrument is also
possible
■ New reliability and validity testing
will need to be conducted
■ permission to revise the instrument
will have to be obtained from the
developer of the tool
11.
11
Pilot studies
▹ pretesta newly designed instrument
▹ a small-scale trial run of the actual
research project
▹ A group of individuals similar to the
proposed study subjects should be
tested in conditions similar to those
that will be used in the actual study
▹ Assess: readability, accuracy and
comprehensibility
▹ Browne10
cites a general flat rule to
12.
12
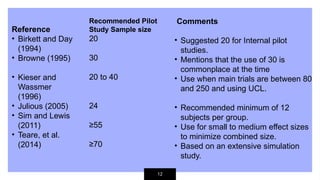
Reference
• Birkett andDay
(1994)
• Browne (1995)
• Kieser and
Wassmer
(1996)
• Julious (2005)
• Sim and Lewis
(2011)
• Teare, et al.
(2014)
Comments
• Suggested 20 for Internal pilot
studies.
• Mentions that the use of 30 is
commonplace at the time
• Use when main trials are between 80
and 250 and using UCL.
• Recommended minimum of 12
subjects per group.
• Use for small to medium effect sizes
to minimize combined size.
• Based on an extensive simulation
study.
Recommended Pilot
Study Sample size
20
30
20 to 40
24
≥55
≥70
13.
13
Practicality of the
Instrument
▹The practicality of an instrument concerns its
cost and appropriateness for the study
population.
How much will the instrument cost?
How long will it take to administer the
instrument? Will the population have the
physical and mental stamina to complete the
instrument?
Are special motor skills or language abilities
required of participants?
Does the researcher require special training to
administer or score the instrument?
14.
14
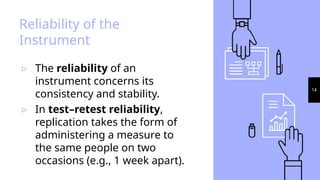
Reliability of the
Instrument
▹The reliability of an
instrument concerns its
consistency and stability.
▹ In test–retest reliability,
replication takes the form of
administering a measure to
the same people on two
occasions (e.g., 1 week apart).
15.
15
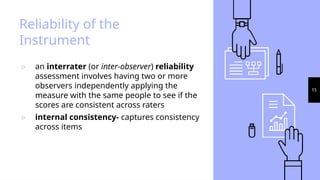
Reliability of the
Instrument
▹an interrater (or inter-observer) reliability
assessment involves having two or more
observers independently applying the
measure with the same people to see if the
scores are consistent across raters
▹ internal consistency- captures consistency
across items
16.
16
Reliability of the
Instrument
▹reliability yield coefficients that summarize
how reliable a measure is
▹ The reliability coefficients normally range in
value from 0.0 to 1.0, with higher values
being especially desirable.
■ .80 or higher are considered desirable
17.
17
Validity
▹ the degreeto which an instrument is
measuring the construct it purports
to measure
▹ Example:
When researchers develop a scale to
measure resilience, they need to be sure
that the resulting scores validly reflect
this construct and not something else,
such as self-efficacy or perseverance.
18.
18
Face Validity
▹ refersto whether the instrument
looks like it is measuring the target
construct
▹ The face validity of an instrument can
be examined through the use of
experts in the content area, or
through the use of individuals who
have characteristics similar to those
of the potential research participants.
19.
19
Content Validity
▹ definedas the extent to which an
instrument’s content adequately
captures the construct
▹ Content validity is usually assessed
by having a panel of experts rate the
scale items for relevance to the
construct and comment on the need
for additional items
20.
20
Construct Validity
▹ concernedwith the degree to
which an instrument measures
the construct it is supposed to
measure
▹ 2 methods:
■ Known-groups procedure
■ Factor analysis
21.
21
Known-groups procedure
▹ theinstrument under consideration is
administered to two groups of people
whose responses are expected to differ on
the variable of interest
▹ Example: tool measuring depression
■ a group of supposedly depressed
subjects
■ a group of supposedly happy subjects
Outcome: you would expect the two
groups to score quite differently on the
tool
22.
22
Factor analysis
▹ amethod used to identify clusters of
related items on an instrument or
scale
▹ helps the researcher determine
whether the tool is measuring only
one construct or several constructs
▹ Correlational procedures are used to
determine if items cluster together.
23.
23
Distribution of
Questionnaires
▹ one-to-onecontact
▹ Questionnaires also may be placed in
a container in a given location where
potential respondents can take one if
they so desire
▹ Using online software program like
google forms or SurveyMonkey
24.
24
Data collection methods
▹Interviews
▹ Observation
▹ Attitude Scales
▹ Physiological and
Psychological Measures
What is statistics
-is a range of procedures for
gathering, organizing, analyzing
and presenting quantitative data
27.
27
Objectives of Statistics
▹Descriptive
■ To summarize and describe sets of
observations
▹ Inferential
■ To make an inference (determine
significant differences, relationships
between sets of observations)
▹ Exploratory
■ Artificial classification of sets of
observations
28.
28
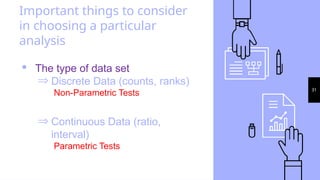
Variables
▹ Discrete
■ Measurementsuses whole
units or numbers with no
possible values between
adjacent units
■ Counted not measured
■ E.g. Family size: 2, 4, 5
29.
29
Variables
▹ Continuous
■ Aremeasured, not counted
■ Measurements uses smaller
increments of units
■ E.g. height, temperature,
distance, age
The type of data
set is one of the
determinants in
choosing the
appropriate
analysis
30.
30
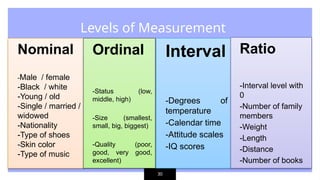
Levels of Measurement
Nominal
-Male/ female
-Black / white
-Young / old
-Single / married /
widowed
-Nationality
-Type of shoes
-Skin color
-Type of music
Ordinal
-Status (low,
middle, high)
-Size (smallest,
small, big, biggest)
-Quality (poor,
good, very good,
excellent)
Interval
-Degrees of
temperature
-Calendar time
-Attitude scales
-IQ scores
Ratio
-Interval level with
0
-Number of family
members
-Weight
-Length
-Distance
-Number of books
31.
31
Important things toconsider
in choosing a particular
analysis
· The type of data set
Þ Discrete Data (counts, ranks)
Non-Parametric Tests
Þ Continuous Data (ratio,
interval)
Parametric Tests
32.
32
Statistical Analysis
▹ Determinewhat needs to be
done based on the problem or
specific objective of the study
To summarize or describe data:
Descriptive Statistics
34
Descriptive Statistics
▹ Todetermine dispersion or variation
of data:
■ Range (minimum and maximum
values
■ Standard Deviation (measure of
precision: “how close are your
measurements”)
■ Confidence Interval (measure of
accuracy: “how close are you to the
true value”)
35.
35
Statistical Analysis
Tomake comparisons or
determine relationships
between variables:
Inferential Statistics
36.
36
Inferential Statistics
· Significantrelationships are
determined by rejecting the
null hypothesis and accepting
the alternative hypothesis
Þ Ho: Variable A = Variable B
Þ H1: Variable A = Variable B
37.
37
Probability
▹ Probability isthe scientific way of stating
the degree of confidence we have in
predicting something
▹ Tossing coins and rolling dice are examples
of probability experiments
38.
38
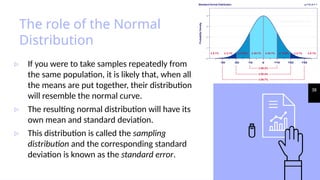
The role ofthe Normal
Distribution
▹ If you were to take samples repeatedly from
the same population, it is likely that, when all
the means are put together, their distribution
will resemble the normal curve.
▹ The resulting normal distribution will have its
own mean and standard deviation.
▹ This distribution is called the sampling
distribution and the corresponding standard
deviation is known as the standard error.
39.
39
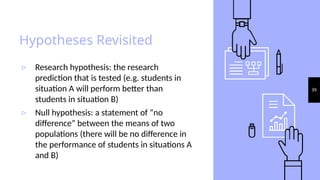
Hypotheses Revisited
▹ Researchhypothesis: the research
prediction that is tested (e.g. students in
situation A will perform better than
students in situation B)
▹ Null hypothesis: a statement of “no
difference” between the means of two
populations (there will be no difference in
the performance of students in situations A
and B)
40.
40
Why do weneed a Null
Hypothesis?
▹ The null hypothesis is a
technical necessity of
inferential statistics
▹ The research hypothesis is
more important than the null
hypothesis when conceiving
and designing research
41.
41
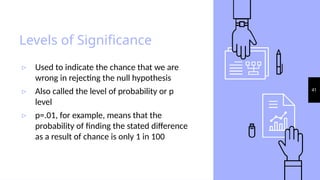
Levels of Significance
▹Used to indicate the chance that we are
wrong in rejecting the null hypothesis
▹ Also called the level of probability or p
level
▹ p=.01, for example, means that the
probability of finding the stated difference
as a result of chance is only 1 in 100
42.
42
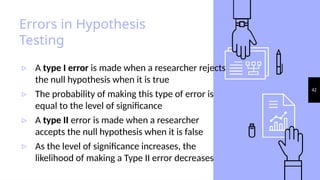
Errors in Hypothesis
Testing
▹A type I error is made when a researcher rejects
the null hypothesis when it is true
▹ The probability of making this type of error is
equal to the level of significance
▹ A type II error is made when a researcher
accepts the null hypothesis when it is false
▹ As the level of significance increases, the
likelihood of making a Type II error decreases
43.
43
Interpreting Levels of
Significance
▹Researchers generally look for
levels of significance equal to
or less than .05
▹ If the desired level of
significance is achieved, the
null hypothesis is rejected and
we say that there is a
statistically significant
difference in the means
44.
44
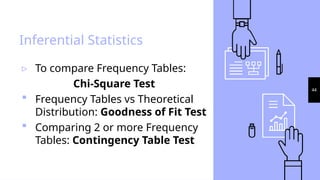
Inferential Statistics
▹ Tocompare Frequency Tables:
Chi-Square Test
Frequency Tables vs Theoretical
Distribution: Goodness of Fit Test
Comparing 2 or more Frequency
Tables: Contingency Table Test
45.
45
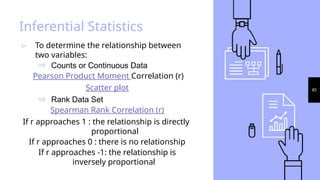
Inferential Statistics
▹ Todetermine the relationship between
two variables:
Þ Counts or Continuous Data
Pearson Product Moment Correlation (r)
Scatter plot
Þ Rank Data Set
Spearman Rank Correlation (r)
If r approaches 1 : the relationship is directly
proportional
If r approaches 0 : there is no relationship
If r approaches -1: the relationship is
inversely proportional
46.
46
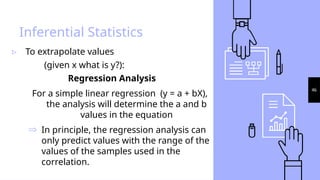
Inferential Statistics
▹ Toextrapolate values
(given x what is y?):
Regression Analysis
For a simple linear regression (y = a + bX),
the analysis will determine the a and b
values in the equation
Þ In principle, the regression analysis can
only predict values with the range of the
values of the samples used in the
correlation.
47.
47
Inferential Analysis
▹ Todetermine significant differences:
1. Compare 2 variables:
Parametric Test (Continuous data or
Discrete Data with N>40)
t-test
T-test: Mean vs Standard
Pooled estimate of variance t-test
(independent population)
Paired t-test (Dependent Population)
48.
48
Inferential Statistics
Non-ParametricTests (Discrete
Data):
Wilcoxon Rank Sum Test:
Independent population
Wilcoxon Signed Rank Test:
Dependent Population, Mean
vs Standard
49.
49
Inferential Statistics
2. ToCompare > 2 variables:
ANOVA (Analysis of Variance)
One-Way ANOVA
used to compare the means
of more than two samples
(M1, M2…MG) in a between-
subjects design
50.
50
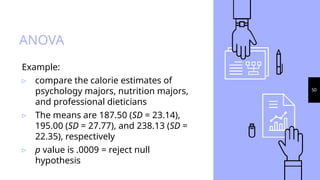
ANOVA
Example:
▹ compare thecalorie estimates of
psychology majors, nutrition majors,
and professional dieticians
▹ The means are 187.50 (SD = 23.14),
195.00 (SD = 27.77), and 238.13 (SD =
22.35), respectively
▹ p value is .0009 = reject null
hypothesis
51.
51
If result ofANOVA is
significant:
▹ Post hoc test:
■ Student Neuman Keuls Test
■ Duncan’s Multiple Range
Test
■ Tukey’s (parametric test)
52.
52
Statistical Analysis
▹ Todetermine patterns or artificial
groupings among the variables:
Exploratory Statistics
Cluster Analysis
develops artificial groupings based
on an index of dissimilarity
generated from the occurrence or
weight of attributes in the variables
being studied
#2 There are five important questions to ask when the researcher is in the process of collecting data: Who? When? Where? What? How?
#3 scientific investigations frequently involve a team of researchers
Anytime more than one person is involved, assurances must be made that the data are being gathered in the same manner.
Training will be needed for the data collectors, and checks should be made on the reliability of the collected data.
#4 Duration – the only way to answer this question is through a trial run of the procedure by the researcher
The decision may be made to revise the instrument if it seems to take too long for completion.
#5 Optimum conditions - Having participants fill out questionnaires in the middle of the hallway while leaning against a wall would definitely not provide the optimum setting.
While researcher is present – helps ensure return of the questionnaires
At leisure time - answers may be more accurate but reduction in the return rate of the questionnaires
#7 Choosing a data-collection instrument is a major decision that should be made only after careful consideration of the possible alternatives.
#9 While conducting a review of the literature on the topic of interest, a researcher may discover that an instrument is already available to measure the research variable(s).
Many of the existing instruments are copyrighted. The copyright holder must be contacted to obtain permission to use such an instrument. Sometimes this permission is given without cost, and other times the researcher has to pay for permission to use the instrument or purchase copies of the tool.
Frequently, the only request that will be made is that a copy of the study results and the data, particularly data on the reliability and validity of the instrument, be forwarded to the person who developed the instrument.
#10 Caution must be exercised when this approach to instrument development is used. If any items are altered or deleted, or new items added to an existing instrument, the reliability and validity of the tool might be altered.
#14 Test-retest - The assumption is that for traits that have not changed, any differences in people’s scores on the two testing are the result of measurement error. When score differences across waves are small, reliability is high.
#15 when observers or raters are used in a study, the percentage or rate of agreement may also be used to determine the reliability of their observations or ratings
Internal consistency- In responding to a self-report item, people are influenced not only by the underlying construct but also by idiosyncratic reactions to the words. By combining multiple items with various wordings, item irrelevancies are expected to cancel each other out.
An instrument is said to be internally consistent to the extent that its items measure the same trait. If an instrument is supposed to measure depression, for example, all of the items on the instrument must consistently measure depression.
#18 Although face validity is not considered good evidence of validity, it is helpful for a measure to have face validity if other types of validity have also been demonstrated.
#19 are the number and type of items adequate to measure the concept or construct of interest?
These experts are given copies of the instrument and the purpose and objectives of the study. They then evaluate the instrument, usually individually rather than in a group. Comparisons are made between these evaluations, and the researcher then determines if additions, deletions, or other changes need to be made.
#30 NOMINAL
simplest, lowest, most primitive type
involves classification of events into categories that must be distinct, one-dimensional, mutually exclusive and exhaustive; and the resulting scales are “naming” scales
Characteristics:
It involves nominal categories & is essentially a qualitative and a non-mathematical measurement
It names and classifies data into categories
It doesn’t have a zero point
It cannot be ordered in a continuum of low-high
It produces nominal or categorical data
It assumes no equal units of measurement
It assumes the principle of equivalence
ORDINAL
involves not only categorizing elements into groups but also ordering of data and ranking of variables in a continuum ranging according to magnitude, that is, from the lowest to the highest point
Characteristic:
It refers to ranks based on a clear order of magnitude of low and high signifying that some elements have more value than others
The numbers have actual mathematical meaning as well as having identification properties
It is essentially a quantitative measurement
It shows a relative order of magnitude
INTERVAL
Provides information about the distance between the values, and contains equal intervals, ordering subjects into one of them
Characteristic:
It includes equal units
It is essentially quantitative measurement
It specifies the numerical distance between the categories
It does not have a true zero point
RATIO
includes the other three forms offer, plus the option of an absolute true zero as its lowest value, which in essence indicates absence of the variable in question.
Allows the researcher to make statements about proportions and ratios, that is, to relate one value to stimulus
#44 What is the relationship between year in college (freshman, sophomore, junior, senior) and use of campus counseling services?
Responses to this question will involve a count of how many in each group use the counseling service
#47 Parametric test used when the researcher can assume that the population values are normally distributed, variances are equal
Two (or more) samples are called independent if the members chosen for one sample do not determine which individuals are chosen for a second sample. Two (or more) samples are called dependent if the members chosen for one sample automatically determine which members are to be included in the second sample.
#51 When we reject the null hypothesis in a one-way ANOVA, we conclude that the group means are not all the same in the population. But this can indicate different things. With three groups, it can indicate that all three means are significantly different from each other. Or it can indicate that one of the means is significantly different from the other two, but the other two are not significantly different from each other.
statistically significant one-way ANOVA results are typically followed up with a series of post hoc comparisons of selected pairs of group means to determine which are different from which others