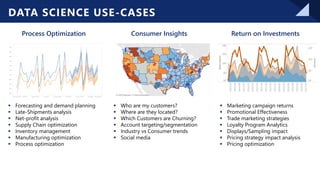
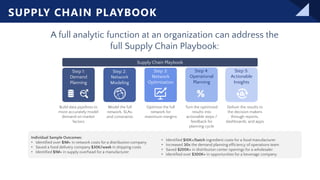
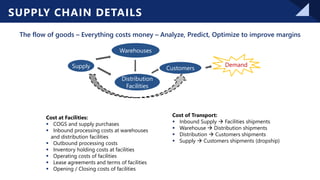
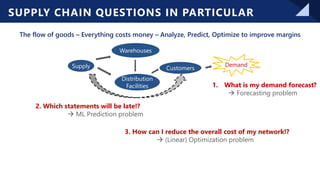
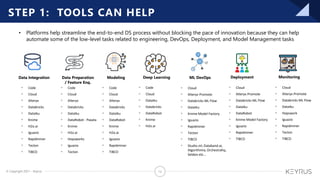
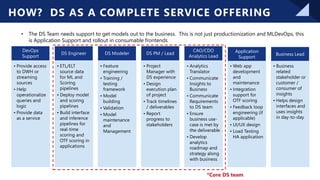
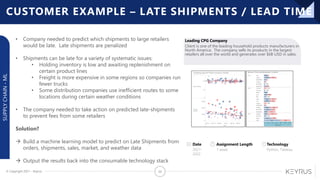
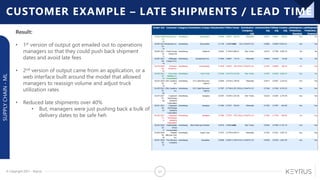
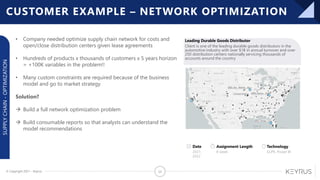
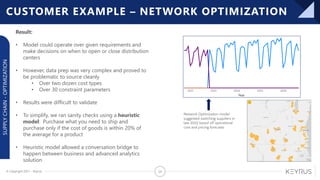
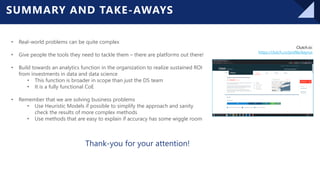
© Copyright 2019 – Keyrus 1
Data
Engineering
Data
Visualizations
Data
Science
Digital
Experience
Strategy and
Transformation
Performance
Management
Innovation
Factory
+3000
Consultants Worldwide
$300 Million
Revenue
+20 Countries
5 Continents
Practical Solutions to Complex
Supply Chain Problems
© Copyright 2019 – Keyrus 2
WE OFFER A FULL STACK OF DATA INTELLIGENCE SERVICES & SOLUTIONS
Data Strategy Data Engineering Data Discovery
Performance
Management
Cloud
Data Science
OUR SERVICES
© Copyright 2019 – Keyrus 3
CPG / Retail Finance
Manufacturing
Utilities
Pharmaceuticals
Nonprofits
OUR VERTICALS
© Copyright 2019 – Keyrus 4
SOME OF OUR PARTNERS
© Copyright 2021 – Keyrus 5
The number of disruptions
up year-over-year due to
manufacturing issues, labor
shortages, and lack of
skilled expertise in
manufacturing
150% The number of shortages
up year-over-year in
products and raw materials
from semiconductors to
cardboard
638% The number of late
deliveries up year-over-
year due to disruptions in
the distribution network of
goods from sea-ports and
lack of shipping containers
85%
Disruptions in the global supply chain network are having an
unprecedented affect on consumers everywhere
https://advisory.kpmg.us/insights/future-supply-chain.html
https://www.scmr.com/article/record_breaking_supply_chain_disruptions_and_supply_shortages
https://www.bboxservices.com/resources/blog/bbns/2021/06/29/backordered-the-impact-of-the-great-2021-supply-chain-disruption
+ + +
STATE OF SUPPLY CHAIN 2021 - 2022
© Copyright 2021 – Keyrus 6
LEADING
COMPANIES ARE
STRUGGLING IN
THEIR EFFORTS
TO SOLVE THEIR
SUPPLY CHAIN
53%
of executives state they aren’t
treating data as a business
asset
93%
of these executives identify
people and process issues as
the obstacle
Source: NewVantage Partners Big Data & AI Executive Survey 2019
© Copyright 2021 – Keyrus 7
THESE PROBLEMS CAN BE EASY TO CALL-OUT, BUT HARD TO ADDRESS AT SCALE
People
• Not having the right skills to work with large volumes of data
or varieties of data systems (database, cloud, etc.). Excel
dependencies.
• Time-to-insights is not competitive because each new ad hoc
question requires an ad hoc application or process to be
created
We need to enable our people with
better tools and processes to help
them accomplish their goals
» Better access to data
» Tools to process the data they need to
answer key questions
» Ensure your Processes build
confidence in the data and analytics
» Use tools that enable your people, not
hinder them with maintaining complex
technical stacks and processes
» Enable organizational structures that
make analytics “stick”
Technologies
• There is a high dependency on IT and Data Science team
often lacks infrastructure and engineering support
• There are no data governance processes making sustained
ROI and maintenance difficult
Processes
• No one has ownership over data processes, or they live in
siloed applications owned by specific individuals
• Teams rely on tribal knowledge or sets of unwritten rules or
information
Challenges Solution
© Copyright 2021 – Keyrus 8
THE GOAL OF
THIS TALK How can we
enable people
practically…
… to solve
complex supply
chain problems?
© Copyright 2021 – Keyrus 9
Process Optimization
▪ Forecasting and demand planning
▪ Late-Shipments analysis
▪ Net-profit analysis
▪ Supply Chain optimization
▪ Inventory management
▪ Manufacturing optimization
▪ Process optimization
Return on Investments
▪ Marketing campaign returns
▪ Promotional Effectiveness
▪ Trade marketing strategies
▪ Loyalty Program Analytics
▪ Displays/Sampling impact
▪ Pricing strategy impact analysis
▪ Pricing optimization
Consumer Insights
▪ Who are my customers?
▪ Where are they located?
▪ Which Customers are Churning?
▪ Account targeting/segmentation
▪ Industry vs Consumer trends
▪ Social media
DATA SCIENCE USE-CASES
© Copyright 2021 – Keyrus 10
A full analytic function at an organization can address the
full Supply Chain Playbook:
Individual Sample Outcomes:
• Identified over $1M+ in network costs for a distribution company
• Saved a food delivery company $30K/week in shipping costs
• Identified $1M+ in supply overhead for a manufacturer
Step 1:
Demand
Planning
Step 2:
Network
Modeling
Step 3:
Network
Optimization
Step 4:
Operational
Planning
Step 5:
Actionable
Insights
Build data pipelines to
more accurately model
demand on market
factors
Model the full
network, SLAs,
and constraints
Optimize the full
network for
maximum margins
Turn the optimized
results into
actionable steps /
feedback for
planning cycle
Deliver the results to
the decision makers
through reports,
dashboards, and apps
Supply Chain Playbook
• Identified $10K+/batch ingredient costs for a food manufacturer
• Increased 30x the demand planning efficiency of operations team
• Saved $200K+ in distribution center openings for a wholesaler
• Identified over $300K+ in opportunities for a beverage company
SUPPLY CHAIN PLAYBOOK
© Copyright 2021 – Keyrus 11
The flow of goods – Everything costs money – Analyze, Predict, Optimize to improve margins
Cost at Facilities:
▪ COGS and supply purchases
▪ Inbound processing costs at warehouses
and distribution facilities
▪ Outbound processing costs
▪ Inventory holding costs at facilities
▪ Operating costs of facilities
▪ Lease agreements and terms of facilities
▪ Opening / Closing costs of facilities
SUPPLY CHAIN DETAILS
Supply
Warehouses
Distribution
Facilities
Customers
Demand
Cost of Transport:
▪ Inbound Supply → Facilities shipments
▪ Warehouse → Distribution shipments
▪ Distribution → Customers shipments
▪ Supply → Customers shipments (dropship)
© Copyright 2021 – Keyrus 12
The flow of goods – Everything costs money – Analyze, Predict, Optimize to improve margins
SUPPLY CHAIN QUESTIONS IN PARTICULAR
Supply
Warehouses
Distribution
Facilities
Customers
Demand
1. What is my demand forecast?
→ Forecasting problem
2. Which statements will be late!?
→ ML Prediction problem
3. How can I reduce the overall cost of my network!?
→ (Linear) Optimization problem
© Copyright 2021 – Keyrus 13
Data Integration
▪ Code
▪ Cloud
▪ Alteryx
▪ Databricks
▪ DataIku
▪ Knime
▪ H2o.ai
▪ Iguazio
▪ Rapidminer
▪ Tecton
▪ TIBCO
Data Preparation
/ Feature Eng.
▪ Code
▪ Cloud
▪ Alteryx
▪ Databricks
▪ DataIku
▪ DataRobot - Paxata
▪ Knime
▪ H2o.ai
▪ Hopsworks
▪ Iguazio
▪ Tecton
Modeling
▪ Code
▪ Cloud
▪ Alteryx
▪ Databricks
▪ DataIku
▪ DataRobot
▪ Knime
▪ H2o.ai
▪ Iguazio
▪ Rapidminer
▪ TIBCO
Deep Learning
▪ Code
▪ Cloud
▪ DataIku
▪ Databricks
▪ DataRobot
▪ Knime
▪ H2o.ai
ML DevOps
▪ Cloud
▪ Alteryx Promote
▪ Databricks ML Flow
▪ DataIku
▪ Knime Model Factory
▪ Iguazio
▪ Rapidminer
▪ Tecton
▪ TIBCO
▪ Studio.ml, Databand.ai,
Algorithmia, Orchestrahq,
Seldon etc…
Deployment
▪ Cloud
▪ Alteryx Promote
▪ Databricks ML Flow
▪ DataIku
▪ DataRobot
▪ Knime Model Factory
▪ Iguazio
▪ Rapidminer
▪ TIBCO
Monitoring
▪ Cloud
▪ Alteryx Promote
▪ Databricks ML Flow
▪ DataIku
▪ Hopswork
▪ Iguazio
▪ Rapidminer
▪ Tecton
▪ TIBCO
• Platforms help streamline the end-to-end DS process without blocking the pace of innovation because they can help
automate some of the low-level tasks related to engineering, DevOps, Deployment, and Model Management tasks
STEP 1: TOOLS CAN HELP
© Copyright 2021 – Keyrus 14
Governance
▪ Compliance
▪ Code Templates / Open Source
▪ Production framework
▪ Model Versioning
▪ Support Services
▪ Permissions & Security
▪ Knowledge Transfer
▪ Sharing and Collaboration
▪ Repeatability
Time to Market
▪ Rapid Prototyping
▪ Validating Results
▪ Built-In Deployment
▪ Built-In ML DevOps
▪ Built-In Monitoring
▪ Collaboration / Social
Scalability
▪ Managed underlying
infrastructure
▪ Less ramp-up time
▪ Offload low-value
tasks like scheduling
and logging
▪ Best Practices are
Built-In
▪ More Models tested
and trialed
▪ Visual paradigms
Precision
▪ Built-In hyper parameter
tuning, cross-validation,
ensemble modeling
▪ Easily accessible testing
tools and methods
▪ Model audit trail
▪ Explainability
• We also need the right processes in place to deliver Rapid Time-to-Market, Scalability, Model Deployment, Sustained ROI
The right platform can also help put the team’s focus where it should be, and help the organization with:
The more these capabilities are baked into the platform and
approach, the less obligation is on the Data Scientist / Engineer
TOOLS / PLATFORMS / FRAMEWORKS → PROCESS
© Copyright 2021 – Keyrus 15
Leading Durable Goods Distributor
SUPPLY
CHAIN
-
FORECASTING
Client is the leading spirits and beverage importers in the world
with over $19B in annual turnover distributing dozens of high-
profile brands to customers all over the world.
CUSTOMER EXAMPLE – GRANULAR FORECASTS
• Business analyst needed demand forecasts for every product line in
every market at a large CPG company (over 1000 forecasts)
• Team was using excel for the top 20 products at the national level
• Business needed to own this process because DS team was ‘busy’,
the Planning Team couldn’t get the data into their tool, and the
process needed to be repeated weekly
• Code based solution wouldn’t have worked because the analyst
needed to pull the data from a portal and cleanse it with specific
business knowledge to avoid double counting. No python skills
Solution?
→ Introduce an analytics platform
→ Train the team on data integration capabilities (~2 weeks)
→ Write a forecast factory function so that the analyst can pull and
prep the data themselves, and then generate forecasts at the
required granularity of product and market
© Copyright 2021 – Keyrus 16
SUPPLY
CHAIN
-
FORECASTING
CUSTOMER EXAMPLE – GRANULAR FORECASTS
Result:
• Forecast Factory allows the analyst to automatically
create 1000’s of forecasts every week (~16hrs run time)
• The Forecast Factory compares several ARIMA and ETS
models against each other and picks the best model for
the given product-market combination
• Forecast accuracy ranged from 2-10%. ROI of 4900%
• Templatized process → Governance & Scalability
© Copyright 2021 – Keyrus 17
Build a full stack around data modeling, including applications around the
models so that Business Users can explore What-If scenarios and impact
the planning process
STEP 2: IMPACT THE DAY-TO-DAY DIRECTLY
© Copyright 2021 – Keyrus 18
HOW? DS AS A COMPLETE SERVICE OFFERING
DevOps
Support
• Provide access
to DWH or
streaming
sources
• Help
operationalize
queries and
logic
• Provide data
as a service
DS Engineer
• ETL/ELT
source data
for ML and
Scoring
pipelines
• Deploy model
and scoring
pipelines
• Build interface
and inference
pipelines for
real-time
scoring and
OTF scoring in
applications
DS Modeler
• Feature
engineering
• Training /
testing
framework
• Model
building
• Validation
• Model
maintenance
and
Management
DS PM / Lead
• Project
Manager with
DS experience
• Design
execution plan
of project
• Track timelines
/ deliverables
• Report
progress to
stakeholders
CAO/CDO
Analytics Lead
• Analytics
Translator
• Communicate
Insights to
Business
• Communicate
Requirements
to DS team
• Ensure
business use-
case is met by
the deliverable
• Develop
analytics
roadmap and
strategy along
with business
Application
Support
• Web app
development
and
maintenance
• Integration
support for
OTF scoring
• Feedback loop
engineering (if
applicable)
• UI/UX design
• Load Testing
HA application
Business Lead
• Business
related
stakeholder or
customer /
consumer of
insights
• Helps design
interfaces and
uses insights
in day-to-day
*Core DS team
• The DS Team needs support to get models out to the business. This is not just productionization and MLDevOps, this
is Application Support and rollout in consumable frontends
© Copyright 2021 – Keyrus 19
BUILD TOWARDS AN ANALYTICS COE
Business Skills
• Business Needs
• Organization and Processes
COE
Analytics Skills
• Business, Statistical and
Process Needs
IT Skills
• Tools, Infra,
Applications and Data
A fully-fledged COE encompasses the following skills and responsibilities
COE Responsibilities
Education & Support
Analytics Program
Management
Data Stewardship Advanced Analysis
End-user support Ad hoc & Prototyping Quality Assurance Data Mining
Training, Development
& Implementation
Intake & Prioritization Business Metadata Data Preparation
Communication,
newsletters & User
groups
Requirements Data Governance Statistical Modelling
User skills & Support
Program and Marketing
Program Management
Data stewardship & Architecture
Data Management
Advanced Techniques
Define
Vision
Control
Funding
Establish
Standards
Build
Technology
Blueprint
Organize
Methodology
Leadership
Develop User
Skills
Manage
Programs
© Copyright 2021 – Keyrus 20
Leading CPG Company
SUPPLY
CHAIN
-
ML
Client is one of the leading household products manufacturers in
North America. The company sells its products in the largest
retailers all over the world and generates over $6B USD in sales.
Date
2021-
2022
Assignment Length
1 week
Technology
Python, Tableau
CUSTOMER EXAMPLE – LATE SHIPMENTS / LEAD TIME
• Company needed to predict which shipments to large retailers
would be late. Late shipments are penalized
• Shipments can be late for a variety of systematic issues:
• Holding inventory is low and awaiting replenishment on
certain product lines
• Freight is more expensive in some regions so companies run
fewer trucks
• Some distribution companies use inefficient routes to some
locations during certain weather conditions
• The company needed to take action on predicted late-shipments
to prevent fees from some retailers
Solution?
→ Build a machine learning model to predict on Late Shipments from
orders, shipments, sales, market, and weather data
→ Output the results back into the consumable technology stack
© Copyright 2021 – Keyrus 21
SUPPLY
CHAIN
-
ML
CUSTOMER EXAMPLE – LATE SHIPMENTS / LEAD TIME
Result:
• 1st version of output got emailed out to operations
managers so that they could push back shipment
dates and avoid late fees
• 2nd version of output came from an application, or a
web interface built around the model that allowed
managers to reassign volume and adjust truck
utilization rates
• Reduced late shipments over 40%
• But, managers were just pushing back a bulk of
delivery dates to be safe heh
© Copyright 2021 – Keyrus 22
A less accurate model that people can understand is more useful than a
perfect but complex model that is hard to explain
STEP 3: SOLVE PROBLEMS THAT PEOPLE UNDERSTAND
© Copyright 2021 – Keyrus 23
Leading Durable Goods Distributor
SUPPLY
CHAIN
-
OPTIMIZATION
Client is one of the leading durable goods distributors in the
automotive industry with over $1B in annual turnover and over
250 distribution centers nationally servicing thousands of
accounts around the country
Date
2021-
2022
Assignment Length
8 week
Technology
GLPK, Power BI
CUSTOMER EXAMPLE – NETWORK OPTIMIZATION
• Company needed optimize supply chain network for costs and
open/close distribution centers given lease agreements
• Hundreds of products x thousands of customers x 5 years horizon
= +100K variables in the problem!!
• Many custom constraints are required because of the business
model and go to market strategy
Solution?
→ Build a full network optimization problem
→ Build consumable reports so that analysts can understand the
model recommendations
© Copyright 2021 – Keyrus 24
SUPPLY
CHAIN
-
OPTIMIZATION
CUSTOMER EXAMPLE – NETWORK OPTIMIZATION
Result:
• Model could operate over given requirements and
make decisions on when to open or close distribution
centers
• However, data prep was very complex and proved to
be problematic to source cleanly
• Over two dozen cost types
• Over 30 constraint parameters
• Results were difficult to validate
• To simplify, we ran sanity checks using a heuristic
model: Purchase what you need to ship and
purchase only if the cost of goods is within 20% of
the average for a product
• Heuristic model allowed a conversation bridge to
happen between business and advanced analytics
solution
Network Optimization model
suggested switching suppliers in
late 2022 based off operational
cost and pricing forecasts
© Copyright 2021 – Keyrus 25
SUMMARY AND TAKE-AWAYS
Clutch.io:
https://clutch.co/profile/keyrus
• Real-world problems can be quite complex
• Give people the tools they need to tackle them – there are platforms out there!
• Build towards an analytics function in the organization to realize sustained ROI
from investments in data and data science
• This function is broader in scope than just the DS team
• It is a fully functional CoE
• Remember that we are solving business problems
• Use Heuristic Models if possible to simplify the approach and sanity
check the results of more complex methods
• Use methods that are easy to explain if accuracy has some wiggle room
Thank-you for your attention!

Data Con LA 2022 - Practical Solutions to Complex Supply Chain Problems

  • 1.
    © Copyright 2019– Keyrus 1 Data Engineering Data Visualizations Data Science Digital Experience Strategy and Transformation Performance Management Innovation Factory +3000 Consultants Worldwide $300 Million Revenue +20 Countries 5 Continents Practical Solutions to Complex Supply Chain Problems
  • 2.
    © Copyright 2019– Keyrus 2 WE OFFER A FULL STACK OF DATA INTELLIGENCE SERVICES & SOLUTIONS Data Strategy Data Engineering Data Discovery Performance Management Cloud Data Science OUR SERVICES
  • 3.
    © Copyright 2019– Keyrus 3 CPG / Retail Finance Manufacturing Utilities Pharmaceuticals Nonprofits OUR VERTICALS
  • 4.
    © Copyright 2019– Keyrus 4 SOME OF OUR PARTNERS
  • 5.
    © Copyright 2021– Keyrus 5 The number of disruptions up year-over-year due to manufacturing issues, labor shortages, and lack of skilled expertise in manufacturing 150% The number of shortages up year-over-year in products and raw materials from semiconductors to cardboard 638% The number of late deliveries up year-over- year due to disruptions in the distribution network of goods from sea-ports and lack of shipping containers 85% Disruptions in the global supply chain network are having an unprecedented affect on consumers everywhere https://advisory.kpmg.us/insights/future-supply-chain.html https://www.scmr.com/article/record_breaking_supply_chain_disruptions_and_supply_shortages https://www.bboxservices.com/resources/blog/bbns/2021/06/29/backordered-the-impact-of-the-great-2021-supply-chain-disruption + + + STATE OF SUPPLY CHAIN 2021 - 2022
  • 6.
    © Copyright 2021– Keyrus 6 LEADING COMPANIES ARE STRUGGLING IN THEIR EFFORTS TO SOLVE THEIR SUPPLY CHAIN 53% of executives state they aren’t treating data as a business asset 93% of these executives identify people and process issues as the obstacle Source: NewVantage Partners Big Data & AI Executive Survey 2019
  • 7.
    © Copyright 2021– Keyrus 7 THESE PROBLEMS CAN BE EASY TO CALL-OUT, BUT HARD TO ADDRESS AT SCALE People • Not having the right skills to work with large volumes of data or varieties of data systems (database, cloud, etc.). Excel dependencies. • Time-to-insights is not competitive because each new ad hoc question requires an ad hoc application or process to be created We need to enable our people with better tools and processes to help them accomplish their goals » Better access to data » Tools to process the data they need to answer key questions » Ensure your Processes build confidence in the data and analytics » Use tools that enable your people, not hinder them with maintaining complex technical stacks and processes » Enable organizational structures that make analytics “stick” Technologies • There is a high dependency on IT and Data Science team often lacks infrastructure and engineering support • There are no data governance processes making sustained ROI and maintenance difficult Processes • No one has ownership over data processes, or they live in siloed applications owned by specific individuals • Teams rely on tribal knowledge or sets of unwritten rules or information Challenges Solution
  • 8.
    © Copyright 2021– Keyrus 8 THE GOAL OF THIS TALK How can we enable people practically… … to solve complex supply chain problems?
  • 9.
    © Copyright 2021– Keyrus 9 Process Optimization ▪ Forecasting and demand planning ▪ Late-Shipments analysis ▪ Net-profit analysis ▪ Supply Chain optimization ▪ Inventory management ▪ Manufacturing optimization ▪ Process optimization Return on Investments ▪ Marketing campaign returns ▪ Promotional Effectiveness ▪ Trade marketing strategies ▪ Loyalty Program Analytics ▪ Displays/Sampling impact ▪ Pricing strategy impact analysis ▪ Pricing optimization Consumer Insights ▪ Who are my customers? ▪ Where are they located? ▪ Which Customers are Churning? ▪ Account targeting/segmentation ▪ Industry vs Consumer trends ▪ Social media DATA SCIENCE USE-CASES
  • 10.
    © Copyright 2021– Keyrus 10 A full analytic function at an organization can address the full Supply Chain Playbook: Individual Sample Outcomes: • Identified over $1M+ in network costs for a distribution company • Saved a food delivery company $30K/week in shipping costs • Identified $1M+ in supply overhead for a manufacturer Step 1: Demand Planning Step 2: Network Modeling Step 3: Network Optimization Step 4: Operational Planning Step 5: Actionable Insights Build data pipelines to more accurately model demand on market factors Model the full network, SLAs, and constraints Optimize the full network for maximum margins Turn the optimized results into actionable steps / feedback for planning cycle Deliver the results to the decision makers through reports, dashboards, and apps Supply Chain Playbook • Identified $10K+/batch ingredient costs for a food manufacturer • Increased 30x the demand planning efficiency of operations team • Saved $200K+ in distribution center openings for a wholesaler • Identified over $300K+ in opportunities for a beverage company SUPPLY CHAIN PLAYBOOK
  • 11.
    © Copyright 2021– Keyrus 11 The flow of goods – Everything costs money – Analyze, Predict, Optimize to improve margins Cost at Facilities: ▪ COGS and supply purchases ▪ Inbound processing costs at warehouses and distribution facilities ▪ Outbound processing costs ▪ Inventory holding costs at facilities ▪ Operating costs of facilities ▪ Lease agreements and terms of facilities ▪ Opening / Closing costs of facilities SUPPLY CHAIN DETAILS Supply Warehouses Distribution Facilities Customers Demand Cost of Transport: ▪ Inbound Supply → Facilities shipments ▪ Warehouse → Distribution shipments ▪ Distribution → Customers shipments ▪ Supply → Customers shipments (dropship)
  • 12.
    © Copyright 2021– Keyrus 12 The flow of goods – Everything costs money – Analyze, Predict, Optimize to improve margins SUPPLY CHAIN QUESTIONS IN PARTICULAR Supply Warehouses Distribution Facilities Customers Demand 1. What is my demand forecast? → Forecasting problem 2. Which statements will be late!? → ML Prediction problem 3. How can I reduce the overall cost of my network!? → (Linear) Optimization problem
  • 13.
    © Copyright 2021– Keyrus 13 Data Integration ▪ Code ▪ Cloud ▪ Alteryx ▪ Databricks ▪ DataIku ▪ Knime ▪ H2o.ai ▪ Iguazio ▪ Rapidminer ▪ Tecton ▪ TIBCO Data Preparation / Feature Eng. ▪ Code ▪ Cloud ▪ Alteryx ▪ Databricks ▪ DataIku ▪ DataRobot - Paxata ▪ Knime ▪ H2o.ai ▪ Hopsworks ▪ Iguazio ▪ Tecton Modeling ▪ Code ▪ Cloud ▪ Alteryx ▪ Databricks ▪ DataIku ▪ DataRobot ▪ Knime ▪ H2o.ai ▪ Iguazio ▪ Rapidminer ▪ TIBCO Deep Learning ▪ Code ▪ Cloud ▪ DataIku ▪ Databricks ▪ DataRobot ▪ Knime ▪ H2o.ai ML DevOps ▪ Cloud ▪ Alteryx Promote ▪ Databricks ML Flow ▪ DataIku ▪ Knime Model Factory ▪ Iguazio ▪ Rapidminer ▪ Tecton ▪ TIBCO ▪ Studio.ml, Databand.ai, Algorithmia, Orchestrahq, Seldon etc… Deployment ▪ Cloud ▪ Alteryx Promote ▪ Databricks ML Flow ▪ DataIku ▪ DataRobot ▪ Knime Model Factory ▪ Iguazio ▪ Rapidminer ▪ TIBCO Monitoring ▪ Cloud ▪ Alteryx Promote ▪ Databricks ML Flow ▪ DataIku ▪ Hopswork ▪ Iguazio ▪ Rapidminer ▪ Tecton ▪ TIBCO • Platforms help streamline the end-to-end DS process without blocking the pace of innovation because they can help automate some of the low-level tasks related to engineering, DevOps, Deployment, and Model Management tasks STEP 1: TOOLS CAN HELP
  • 14.
    © Copyright 2021– Keyrus 14 Governance ▪ Compliance ▪ Code Templates / Open Source ▪ Production framework ▪ Model Versioning ▪ Support Services ▪ Permissions & Security ▪ Knowledge Transfer ▪ Sharing and Collaboration ▪ Repeatability Time to Market ▪ Rapid Prototyping ▪ Validating Results ▪ Built-In Deployment ▪ Built-In ML DevOps ▪ Built-In Monitoring ▪ Collaboration / Social Scalability ▪ Managed underlying infrastructure ▪ Less ramp-up time ▪ Offload low-value tasks like scheduling and logging ▪ Best Practices are Built-In ▪ More Models tested and trialed ▪ Visual paradigms Precision ▪ Built-In hyper parameter tuning, cross-validation, ensemble modeling ▪ Easily accessible testing tools and methods ▪ Model audit trail ▪ Explainability • We also need the right processes in place to deliver Rapid Time-to-Market, Scalability, Model Deployment, Sustained ROI The right platform can also help put the team’s focus where it should be, and help the organization with: The more these capabilities are baked into the platform and approach, the less obligation is on the Data Scientist / Engineer TOOLS / PLATFORMS / FRAMEWORKS → PROCESS
  • 15.
    © Copyright 2021– Keyrus 15 Leading Durable Goods Distributor SUPPLY CHAIN - FORECASTING Client is the leading spirits and beverage importers in the world with over $19B in annual turnover distributing dozens of high- profile brands to customers all over the world. CUSTOMER EXAMPLE – GRANULAR FORECASTS • Business analyst needed demand forecasts for every product line in every market at a large CPG company (over 1000 forecasts) • Team was using excel for the top 20 products at the national level • Business needed to own this process because DS team was ‘busy’, the Planning Team couldn’t get the data into their tool, and the process needed to be repeated weekly • Code based solution wouldn’t have worked because the analyst needed to pull the data from a portal and cleanse it with specific business knowledge to avoid double counting. No python skills Solution? → Introduce an analytics platform → Train the team on data integration capabilities (~2 weeks) → Write a forecast factory function so that the analyst can pull and prep the data themselves, and then generate forecasts at the required granularity of product and market
  • 16.
    © Copyright 2021– Keyrus 16 SUPPLY CHAIN - FORECASTING CUSTOMER EXAMPLE – GRANULAR FORECASTS Result: • Forecast Factory allows the analyst to automatically create 1000’s of forecasts every week (~16hrs run time) • The Forecast Factory compares several ARIMA and ETS models against each other and picks the best model for the given product-market combination • Forecast accuracy ranged from 2-10%. ROI of 4900% • Templatized process → Governance & Scalability
  • 17.
    © Copyright 2021– Keyrus 17 Build a full stack around data modeling, including applications around the models so that Business Users can explore What-If scenarios and impact the planning process STEP 2: IMPACT THE DAY-TO-DAY DIRECTLY
  • 18.
    © Copyright 2021– Keyrus 18 HOW? DS AS A COMPLETE SERVICE OFFERING DevOps Support • Provide access to DWH or streaming sources • Help operationalize queries and logic • Provide data as a service DS Engineer • ETL/ELT source data for ML and Scoring pipelines • Deploy model and scoring pipelines • Build interface and inference pipelines for real-time scoring and OTF scoring in applications DS Modeler • Feature engineering • Training / testing framework • Model building • Validation • Model maintenance and Management DS PM / Lead • Project Manager with DS experience • Design execution plan of project • Track timelines / deliverables • Report progress to stakeholders CAO/CDO Analytics Lead • Analytics Translator • Communicate Insights to Business • Communicate Requirements to DS team • Ensure business use- case is met by the deliverable • Develop analytics roadmap and strategy along with business Application Support • Web app development and maintenance • Integration support for OTF scoring • Feedback loop engineering (if applicable) • UI/UX design • Load Testing HA application Business Lead • Business related stakeholder or customer / consumer of insights • Helps design interfaces and uses insights in day-to-day *Core DS team • The DS Team needs support to get models out to the business. This is not just productionization and MLDevOps, this is Application Support and rollout in consumable frontends
  • 19.
    © Copyright 2021– Keyrus 19 BUILD TOWARDS AN ANALYTICS COE Business Skills • Business Needs • Organization and Processes COE Analytics Skills • Business, Statistical and Process Needs IT Skills • Tools, Infra, Applications and Data A fully-fledged COE encompasses the following skills and responsibilities COE Responsibilities Education & Support Analytics Program Management Data Stewardship Advanced Analysis End-user support Ad hoc & Prototyping Quality Assurance Data Mining Training, Development & Implementation Intake & Prioritization Business Metadata Data Preparation Communication, newsletters & User groups Requirements Data Governance Statistical Modelling User skills & Support Program and Marketing Program Management Data stewardship & Architecture Data Management Advanced Techniques Define Vision Control Funding Establish Standards Build Technology Blueprint Organize Methodology Leadership Develop User Skills Manage Programs
  • 20.
    © Copyright 2021– Keyrus 20 Leading CPG Company SUPPLY CHAIN - ML Client is one of the leading household products manufacturers in North America. The company sells its products in the largest retailers all over the world and generates over $6B USD in sales. Date 2021- 2022 Assignment Length 1 week Technology Python, Tableau CUSTOMER EXAMPLE – LATE SHIPMENTS / LEAD TIME • Company needed to predict which shipments to large retailers would be late. Late shipments are penalized • Shipments can be late for a variety of systematic issues: • Holding inventory is low and awaiting replenishment on certain product lines • Freight is more expensive in some regions so companies run fewer trucks • Some distribution companies use inefficient routes to some locations during certain weather conditions • The company needed to take action on predicted late-shipments to prevent fees from some retailers Solution? → Build a machine learning model to predict on Late Shipments from orders, shipments, sales, market, and weather data → Output the results back into the consumable technology stack
  • 21.
    © Copyright 2021– Keyrus 21 SUPPLY CHAIN - ML CUSTOMER EXAMPLE – LATE SHIPMENTS / LEAD TIME Result: • 1st version of output got emailed out to operations managers so that they could push back shipment dates and avoid late fees • 2nd version of output came from an application, or a web interface built around the model that allowed managers to reassign volume and adjust truck utilization rates • Reduced late shipments over 40% • But, managers were just pushing back a bulk of delivery dates to be safe heh
  • 22.
    © Copyright 2021– Keyrus 22 A less accurate model that people can understand is more useful than a perfect but complex model that is hard to explain STEP 3: SOLVE PROBLEMS THAT PEOPLE UNDERSTAND
  • 23.
    © Copyright 2021– Keyrus 23 Leading Durable Goods Distributor SUPPLY CHAIN - OPTIMIZATION Client is one of the leading durable goods distributors in the automotive industry with over $1B in annual turnover and over 250 distribution centers nationally servicing thousands of accounts around the country Date 2021- 2022 Assignment Length 8 week Technology GLPK, Power BI CUSTOMER EXAMPLE – NETWORK OPTIMIZATION • Company needed optimize supply chain network for costs and open/close distribution centers given lease agreements • Hundreds of products x thousands of customers x 5 years horizon = +100K variables in the problem!! • Many custom constraints are required because of the business model and go to market strategy Solution? → Build a full network optimization problem → Build consumable reports so that analysts can understand the model recommendations
  • 24.
    © Copyright 2021– Keyrus 24 SUPPLY CHAIN - OPTIMIZATION CUSTOMER EXAMPLE – NETWORK OPTIMIZATION Result: • Model could operate over given requirements and make decisions on when to open or close distribution centers • However, data prep was very complex and proved to be problematic to source cleanly • Over two dozen cost types • Over 30 constraint parameters • Results were difficult to validate • To simplify, we ran sanity checks using a heuristic model: Purchase what you need to ship and purchase only if the cost of goods is within 20% of the average for a product • Heuristic model allowed a conversation bridge to happen between business and advanced analytics solution Network Optimization model suggested switching suppliers in late 2022 based off operational cost and pricing forecasts
  • 25.
    © Copyright 2021– Keyrus 25 SUMMARY AND TAKE-AWAYS Clutch.io: https://clutch.co/profile/keyrus • Real-world problems can be quite complex • Give people the tools they need to tackle them – there are platforms out there! • Build towards an analytics function in the organization to realize sustained ROI from investments in data and data science • This function is broader in scope than just the DS team • It is a fully functional CoE • Remember that we are solving business problems • Use Heuristic Models if possible to simplify the approach and sanity check the results of more complex methods • Use methods that are easy to explain if accuracy has some wiggle room Thank-you for your attention!