Download as PDF, PPTX


![≠
VARIETY
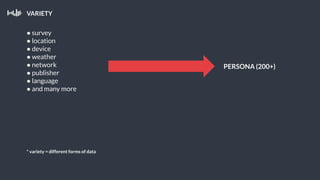
"taxonomy" and "persona" are used
Interchangeably throughout this presentation!
[TAXONOMY = FEATURE ] [PERSONA = COMB. OF FEATURES]](https://image.slidesharecdn.com/dataatpollfish-euangeloslinardos-160111104344/85/Data-at-Pollfish-17-320.jpg)
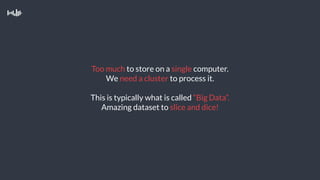


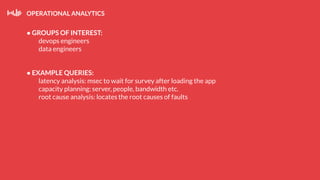


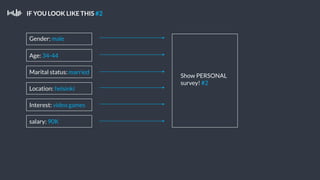
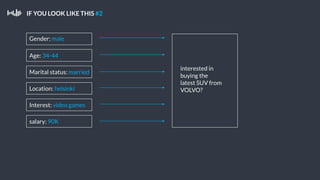
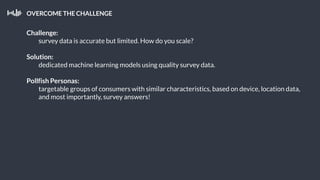
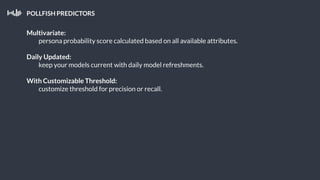

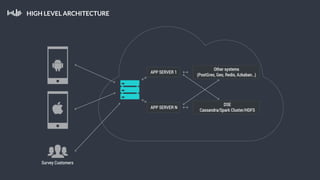

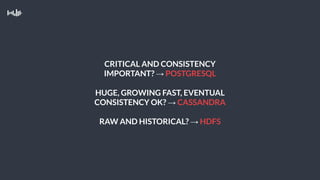


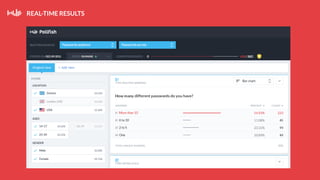
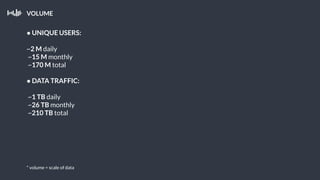
This document summarizes a presentation about Pollfish, a mobile survey platform. It discusses how Pollfish collects data from over 170 million mobile devices worldwide through surveys and device/user information. It handles big data by storing raw data in HDFS and using Cassandra for time-series and user profile data while PostgreSQL stores aggregated data. Spark is used for general cluster computing. Machine learning models use survey data to classify users into personas to personalize surveys. The system architecture includes HDFS, Cassandra, PostgreSQL, Azkaban for workflows, and Spark.


![제 23회 보아즈(BOAZ) 빅데이터 컨퍼런스 - [MBOAX] : ABSA를 활용한 소비자 반응 분석 기반 운영 효율화 대시보드 설계](https://cdn.slidesharecdn.com/ss_thumbnails/3-1boaz23rdconferencemboax-260203102709-9d519923-thumbnail.jpg?width=640&height=640&fit=bounds)


