Data Analytics Using R is a practical and concept-oriented course that introduces learners to data analysis, statistical computing, and visualization using the R programming language. The course covers data manipulation, exploratory data analysis, statistical techniques, and graphical representation of data using R and its libraries.
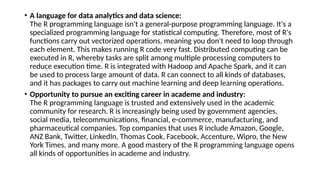
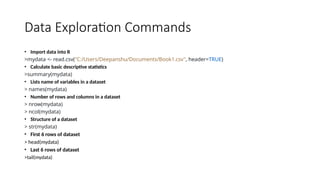
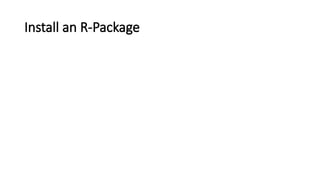
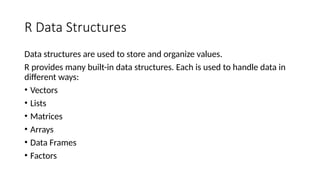
![Get library locations containing R packages
> .libPaths()
[1] "C:/Users/GFG19565/AppData/Local/Programs/R/R-4.3.1/library“
The .libpath() method handles the management of library paths, which are
directories where a program searches for external libraries or modules required for
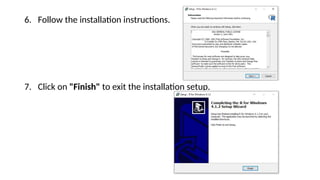
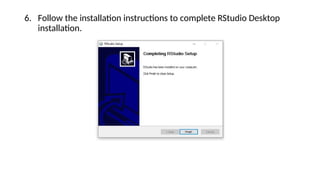
execution.
Get the list of all the R packages installed
> library()
A package is loaded using library(), the functions
and objects in that package become available in
the global environment.
Eg:
> library(dplyr)](https://image.slidesharecdn.com/r-unit1-260119104809-b195d9c6/85/Data-Analytics-and-Statistical-Computing-Using-R-Programming-21-320.jpg)
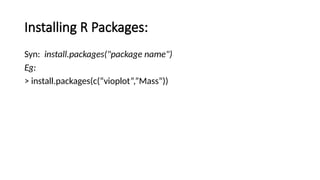
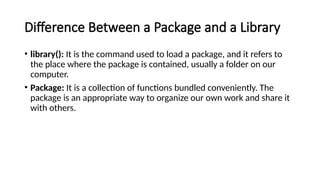
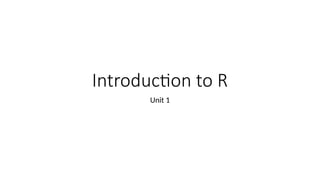
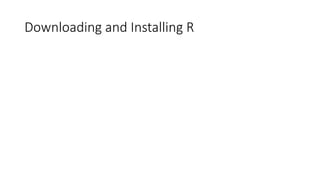
![Working with Directory
• getwd(): The getwd() method is used to gather information about the current working
pathname or default working directory. This function has no arguments. It returns an
absolute pathname. It returns NULL in case there is not any working directory.
> getwd()
[1] "C:/Users/STUDENT/Documents "
• setwd(): This method is used to set the specified pathname as the current working
space directory of the R console.
• Syntax: setwd(dir)
> setwd("..")
> getwd()
[1] "C:/Users/STUDENT"](https://image.slidesharecdn.com/r-unit1-260119104809-b195d9c6/85/Data-Analytics-and-Statistical-Computing-Using-R-Programming-27-320.jpg)
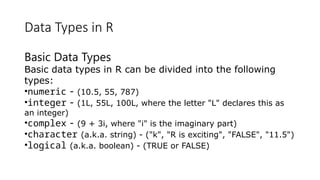
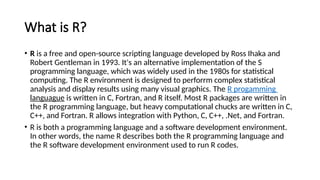
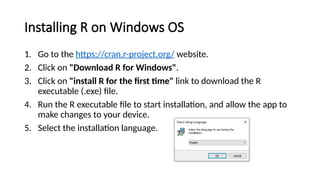
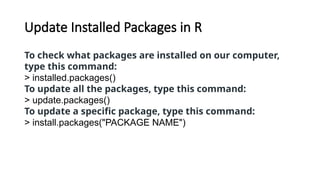
![Factors
Factors are used to categorize data. Examples of factors are:
• Demography: Male/Female
• Music: Rock, Pop, Classic, Jazz
• Training: Strength, Stamina
# Create a factor
music_genre <- factor(c("Jazz", "Rock", "Classic", "Classic", "Pop", "Jazz", "Rock", "Jazz"))
# Print the factor
music_genre
Result:
[1] Jazz Rock Classic Classic Pop Jazz Rock Jazz
Levels: Classic Jazz Pop Rock](https://image.slidesharecdn.com/r-unit1-260119104809-b195d9c6/85/Data-Analytics-and-Statistical-Computing-Using-R-Programming-35-320.jpg)