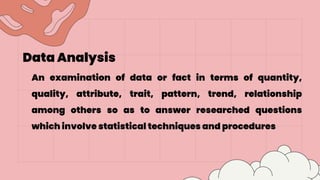
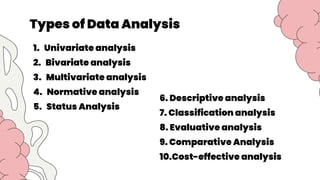
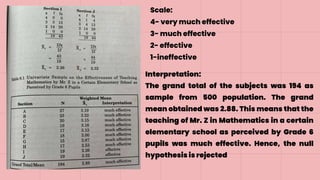
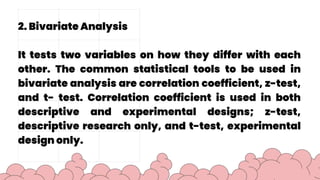
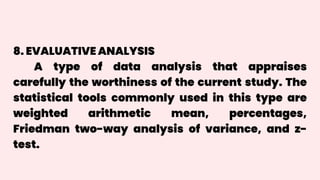
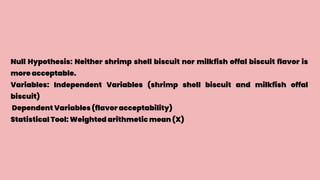
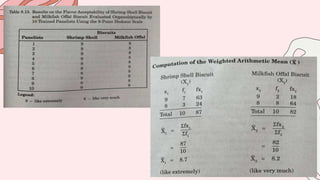
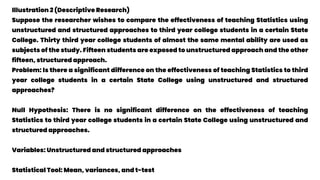
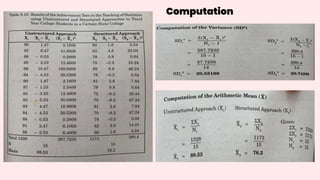
GROUP 8
Data Analysis
and
Interpretation
Data Analysis
An examination of data or fact in terms of quantity,
quality, attribute, trait, pattern, trend, relationship
among others so as to answer researched questions
which involve statistical techniques and procedures
Types of Data Analysis
1. Univariate analysis
2. Bivariate analysis
3. Multivariate analysis
4. Normative analysis
5. Status Analysis
6. Descriptive analysis
7. Classification analysis
8. Evaluative analysis
9. Comparative Analysis
10.Cost-effective analysis
1. Univariate Analysis
It tests single variable whether the variable is similar
to the population from which it has been drawn.
For Example: The Researcher wishes to determine the
effectiveness of teaching Mathematics by Mr. Z in a certain
elementary school as perceived by 194 Grade 6 pupils as
sample from a total population of 500.
Scale:
4- very much effective
3- much effective
2- effective
1-ineffective
Interpretation:
The grand total of the subjects was 194 as
sample from 500 population. The grand
mean obtained was 2.88. This means that the
teaching of Mr. Z in Mathematics in a certain
elementary school as perceived by Grade 6
pupils was much effective. Hence, the null
hypothesis is rejected
2. Bivariate Analysis
It tests two variables on how they differ with each
other. The common statistical tools to be used in
bivariate analysis are correlation coefficient, z-test,
and t- test. Correlation coefficient is used in both
descriptive and experimental designs; z-test,
descriptive research only, and t-test, experimental
design only.
Description Design
Example:
Suppose the researcher wishes to determine if there is significant
difference on the job-related problems met by staff nurses in
government and private hospitals in Iloilo City in terms of “lack of
top management support in giving overtime services rendered by
staff nurses beyond the call of duty.” Of the 120 staff nurses in
government hospital, 98 or 81.67 percent chose it as a problem of the
110 staff nurses in private hospitals, 85 or 77.27 percent chose it as a
problem.
Interpretation:
The computed z-value is 0.77 which is not significant
at .01 level of probability. To be significant at 1%
level, the computed z value is equal to or greater
than 2.58. This means that the job-related problems
met by staff nurses in government and private
hospitals in Iloilo City in terms of top management’s
“lack of support in giving overtime services
rendered by staff nurses beyond the call of duty”
are almost the same. Thus, the null hypothesis is
accepted.
Experimental Design
Suppose a researcher wishes to
determine the significant
differences on the mean weight
of grouper cultured in fish
cages using trash fish and
bread meal as supplemental
feeds?
3. Multivariate Analysis
tests of three or more independent variables at a time on
the degree of relationship with the dependent variable.
Experimental Design
1.F-Test or Analysis of Variance (ANOVA)
2.Friedman two-way ANOVA
3. Kruskal-Wallis one-way ANOVA
Descriptive Research
• Chi-square
4. Normative Analysis
is a type of data analysis wherein the results of the
study is compared with the norm or standard.
Statistical Tools to be used in this type
are the the Arithmetic mean and the
Standard deviation
Example: The researcher wishes to conduct a
study on English achievement of fourth year
high school students in certain state college.
Achievement test is the measuring instrument
to gather data. Based on the result of the test,
the researcher compares the result with the
regional or national norm.
7. CLASSIFICATION ANALYSIS
It is usually employed in natural science
subjects such as Botany, Zoology, Biology,
Phycology, Ichthyology, Conchology, Mycology,
and the like. The specimens collected are
classified from phylum to species. Taxonomic
studies of plants and animals are commonly used
in this study.
8. EVALUATIVE ANALYSIS
A type of data analysis that appraises
carefully the worthiness of the current study. The
statistical tools commonly used in this type are
weighted arithmetic mean, percentages,
Friedman two-way analysis of variance, and z-
test.
Illustration:
Suppose the researcher wishes to conduct a study on the evaluation of the implementation of
“War on Wastes (WOW)” in the Division of Iloilo as perceived by district supervisors,
principals/head teachers, and teachers.
PROBLEM: To what extent is “war on wastes” implemented in the Division of Iloilo as perceived by
district supervisors, principals/head teachers, and teachers.
NULL HYPOTHESIS: “War on Wastes (WOW)” in the Division of Iloilo as perceived by district
supervisors, principals/head teachers, and teachers is unsatisfactorily implemented.
VARIABLES: Independent Variable (War on Wastes)
Dependent Variable (Extent of Implementation)
STATISTICAL TOOL: Weighted Arithmetic Mean
RESULT: Table 8.14 presents the weighted mean and extent of the
implementation of “War on Wastes” as perceived by District Supervisors,
Principals/Head Teachers, and Teachers in the Division of Iloilo (Artificial
Data)
INTERPRETATION:
The mean values obtained on the extent of implementation of “War on
Wastes” in the Division of Iloilo as perceived by district supervisors,
principals/head teachers, and teachers ranged from 3.3 to 2.7. These
values are all very satisfactory. This means that the implementation of
“War on Wastes” in the Division of Iloilo is very satisfactory. Hence, the
null hypothesis is rejected.
9. Comparative Analysis
In comparative analysis, the researcher considers at least two entities (not
manipulated) and establishes a formal procedure for obtaining criterion data on
the basis of which he can compare a conclude one is better than the other. The
common statistical tools used in this type are the mean variances, and t-test.
Illustration 1 (Experimental Research)
Suppose the researcher wishes to compare the flavor acceptability of shrimp
shell biscuit and milkfish offal biscuit.
Problem: Which flavor of biscuit is more acceptable, shrimp shell or milkfish
offal?
Null Hypothesis: Neither shrimp shell biscuit nor milkfish offal biscuit flavor is
more acceptable.
Variables: Independent Variables (shrimp shell biscuit and milkfish offal
biscuit)
Dependent Variables (flavor acceptability)
Statistical Tool: Weighted arithmetic mean (X)
Illustration 2 (Descriptive Research)
Suppose the researcher wishes to compare the effectiveness of teaching Statistics using
unstructured and structured approaches to third year college students in a certain State
College. Thirty third year college students of almost the same mental ability are used as
subjects of the study. Fifteen students are exposed to unstructured approach and the other
fifteen, structured approach.
Problem: Is there a significant difference on the effectiveness of teaching Statistics to third
year college students in a certain State College using unstructured and structured
approaches?
Null Hypothesis: There is no significant difference on the effectiveness of teaching
Statistics to third year college students in a certain State College using unstructured and
structured approaches.
Variables: Unstructured and structured approaches
Statistical Tool: Mean, variances, and t-test
Computation
10. Cost-Effective Analysis
Cost effective analysis is applicable in comparing the cost between two or more
variables, and to determine which of the variables is most effective. The
statistical tools commonly used in this type are the arithmetic mean, variance, t-
test, and F-test.
Illustration
Suppose the researcher wishes to determine the acceptability, salability, and profitability
of fish offal quekiam from milkfish, goatfish, and sardines.
Problems : What is the acceptability, salability, and profitability of fish offal quekiam from
milkfish, goatfish, and sardines? Which is most acceptable, salable, profitable, and has the
highest return of investment (ROI)?
Null Hypotheses: Fish offal quekiam from milkfish, goatfish, and sardines are not
acceptable, salable, and profitable. Notone of the fish offal quekiam is most acceptable,
salable, profitable, and has the highest return of Moinvestment (ROI).
Variable: Independent Variables (milkfish offal quekiam, goatfish offal quekiam, and
sardines offal quekiam) Dependent Variables (acceptability, salability, profitability, and
ROI)
Statistical Tool:Weighted arithmetic mean
Thank you for
Listening

Data Analysis and Interpretation.pptx

  • 1.
  • 2.
    Data Analysis An examinationof data or fact in terms of quantity, quality, attribute, trait, pattern, trend, relationship among others so as to answer researched questions which involve statistical techniques and procedures
  • 3.
    Types of DataAnalysis 1. Univariate analysis 2. Bivariate analysis 3. Multivariate analysis 4. Normative analysis 5. Status Analysis 6. Descriptive analysis 7. Classification analysis 8. Evaluative analysis 9. Comparative Analysis 10.Cost-effective analysis
  • 4.
    1. Univariate Analysis Ittests single variable whether the variable is similar to the population from which it has been drawn. For Example: The Researcher wishes to determine the effectiveness of teaching Mathematics by Mr. Z in a certain elementary school as perceived by 194 Grade 6 pupils as sample from a total population of 500.
  • 6.
    Scale: 4- very mucheffective 3- much effective 2- effective 1-ineffective Interpretation: The grand total of the subjects was 194 as sample from 500 population. The grand mean obtained was 2.88. This means that the teaching of Mr. Z in Mathematics in a certain elementary school as perceived by Grade 6 pupils was much effective. Hence, the null hypothesis is rejected
  • 7.
    2. Bivariate Analysis Ittests two variables on how they differ with each other. The common statistical tools to be used in bivariate analysis are correlation coefficient, z-test, and t- test. Correlation coefficient is used in both descriptive and experimental designs; z-test, descriptive research only, and t-test, experimental design only.
  • 8.
    Description Design Example: Suppose theresearcher wishes to determine if there is significant difference on the job-related problems met by staff nurses in government and private hospitals in Iloilo City in terms of “lack of top management support in giving overtime services rendered by staff nurses beyond the call of duty.” Of the 120 staff nurses in government hospital, 98 or 81.67 percent chose it as a problem of the 110 staff nurses in private hospitals, 85 or 77.27 percent chose it as a problem.
  • 11.
    Interpretation: The computed z-valueis 0.77 which is not significant at .01 level of probability. To be significant at 1% level, the computed z value is equal to or greater than 2.58. This means that the job-related problems met by staff nurses in government and private hospitals in Iloilo City in terms of top management’s “lack of support in giving overtime services rendered by staff nurses beyond the call of duty” are almost the same. Thus, the null hypothesis is accepted.
  • 12.
    Experimental Design Suppose aresearcher wishes to determine the significant differences on the mean weight of grouper cultured in fish cages using trash fish and bread meal as supplemental feeds?
  • 15.
    3. Multivariate Analysis testsof three or more independent variables at a time on the degree of relationship with the dependent variable. Experimental Design 1.F-Test or Analysis of Variance (ANOVA) 2.Friedman two-way ANOVA 3. Kruskal-Wallis one-way ANOVA Descriptive Research • Chi-square
  • 22.
    4. Normative Analysis isa type of data analysis wherein the results of the study is compared with the norm or standard. Statistical Tools to be used in this type are the the Arithmetic mean and the Standard deviation
  • 23.
    Example: The researcherwishes to conduct a study on English achievement of fourth year high school students in certain state college. Achievement test is the measuring instrument to gather data. Based on the result of the test, the researcher compares the result with the regional or national norm.
  • 35.
    7. CLASSIFICATION ANALYSIS Itis usually employed in natural science subjects such as Botany, Zoology, Biology, Phycology, Ichthyology, Conchology, Mycology, and the like. The specimens collected are classified from phylum to species. Taxonomic studies of plants and animals are commonly used in this study.
  • 37.
    8. EVALUATIVE ANALYSIS Atype of data analysis that appraises carefully the worthiness of the current study. The statistical tools commonly used in this type are weighted arithmetic mean, percentages, Friedman two-way analysis of variance, and z- test.
  • 38.
    Illustration: Suppose the researcherwishes to conduct a study on the evaluation of the implementation of “War on Wastes (WOW)” in the Division of Iloilo as perceived by district supervisors, principals/head teachers, and teachers. PROBLEM: To what extent is “war on wastes” implemented in the Division of Iloilo as perceived by district supervisors, principals/head teachers, and teachers. NULL HYPOTHESIS: “War on Wastes (WOW)” in the Division of Iloilo as perceived by district supervisors, principals/head teachers, and teachers is unsatisfactorily implemented. VARIABLES: Independent Variable (War on Wastes) Dependent Variable (Extent of Implementation) STATISTICAL TOOL: Weighted Arithmetic Mean
  • 39.
    RESULT: Table 8.14presents the weighted mean and extent of the implementation of “War on Wastes” as perceived by District Supervisors, Principals/Head Teachers, and Teachers in the Division of Iloilo (Artificial Data)
  • 40.
    INTERPRETATION: The mean valuesobtained on the extent of implementation of “War on Wastes” in the Division of Iloilo as perceived by district supervisors, principals/head teachers, and teachers ranged from 3.3 to 2.7. These values are all very satisfactory. This means that the implementation of “War on Wastes” in the Division of Iloilo is very satisfactory. Hence, the null hypothesis is rejected.
  • 41.
    9. Comparative Analysis Incomparative analysis, the researcher considers at least two entities (not manipulated) and establishes a formal procedure for obtaining criterion data on the basis of which he can compare a conclude one is better than the other. The common statistical tools used in this type are the mean variances, and t-test. Illustration 1 (Experimental Research) Suppose the researcher wishes to compare the flavor acceptability of shrimp shell biscuit and milkfish offal biscuit. Problem: Which flavor of biscuit is more acceptable, shrimp shell or milkfish offal?
  • 42.
    Null Hypothesis: Neithershrimp shell biscuit nor milkfish offal biscuit flavor is more acceptable. Variables: Independent Variables (shrimp shell biscuit and milkfish offal biscuit) Dependent Variables (flavor acceptability) Statistical Tool: Weighted arithmetic mean (X)
  • 44.
    Illustration 2 (DescriptiveResearch) Suppose the researcher wishes to compare the effectiveness of teaching Statistics using unstructured and structured approaches to third year college students in a certain State College. Thirty third year college students of almost the same mental ability are used as subjects of the study. Fifteen students are exposed to unstructured approach and the other fifteen, structured approach. Problem: Is there a significant difference on the effectiveness of teaching Statistics to third year college students in a certain State College using unstructured and structured approaches? Null Hypothesis: There is no significant difference on the effectiveness of teaching Statistics to third year college students in a certain State College using unstructured and structured approaches. Variables: Unstructured and structured approaches Statistical Tool: Mean, variances, and t-test
  • 45.
  • 47.
    10. Cost-Effective Analysis Costeffective analysis is applicable in comparing the cost between two or more variables, and to determine which of the variables is most effective. The statistical tools commonly used in this type are the arithmetic mean, variance, t- test, and F-test.
  • 48.
    Illustration Suppose the researcherwishes to determine the acceptability, salability, and profitability of fish offal quekiam from milkfish, goatfish, and sardines. Problems : What is the acceptability, salability, and profitability of fish offal quekiam from milkfish, goatfish, and sardines? Which is most acceptable, salable, profitable, and has the highest return of investment (ROI)? Null Hypotheses: Fish offal quekiam from milkfish, goatfish, and sardines are not acceptable, salable, and profitable. Notone of the fish offal quekiam is most acceptable, salable, profitable, and has the highest return of Moinvestment (ROI). Variable: Independent Variables (milkfish offal quekiam, goatfish offal quekiam, and sardines offal quekiam) Dependent Variables (acceptability, salability, profitability, and ROI) Statistical Tool:Weighted arithmetic mean
  • 51.