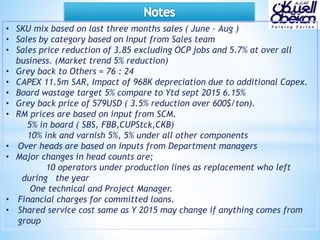
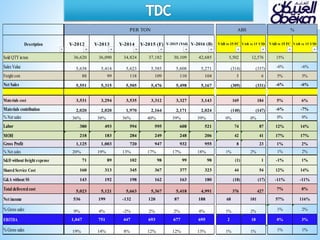
The budget document provides sales projections and financial indicators for 2016. Key points include:
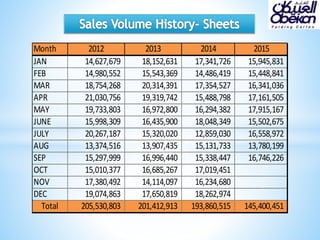
- Projected 2016 sales volume is 42,685 units, a 15% increase over 2015.
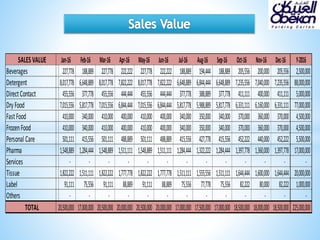
- Sales value is projected to increase 8% to SAR 225 million.
- Gross margin and net income are projected to increase to 26.6% and SAR 8 million respectively.


![[DNTS2019 - EverWin] Tài liệu thuyết trình vòng 1 Chung kết](https://cdn.slidesharecdn.com/ss_thumbnails/asm-201029091307-thumbnail.jpg?width=640&height=640&fit=bounds)


