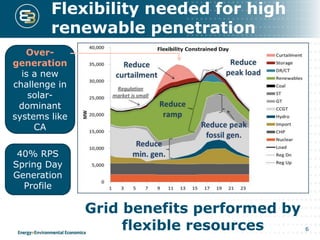
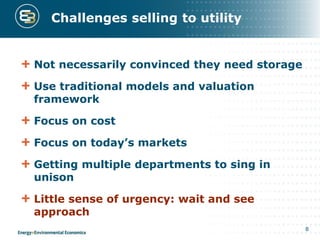
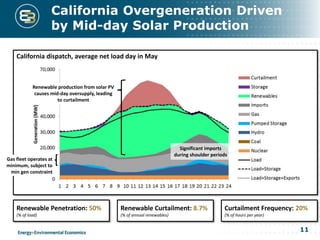
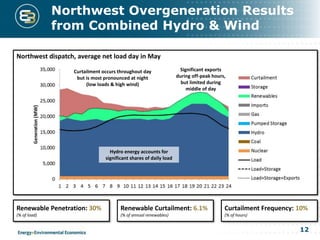
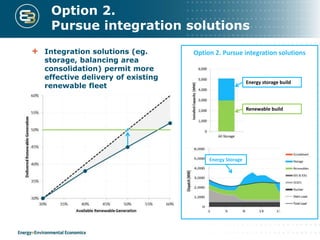
6. Flexibility needed for high
renewable penetration
6
Over-
generation
is a new
challenge in
solar-
dominant
systems like
CA
40% RPS
Spring Day
Generation
Profile
Grid benefits performed by
flexible resources
7. 7
Net Market Value
Utilities evaluate storage based on net market value
Utility planning assumptions and models determine
benefits
Today Tomorrow
8. Challenges selling to utility
Not necessarily convinced they need storage
Use traditional models and valuation
framework
Focus on cost
Focus on today’s markets
Getting multiple departments to sing in
unison
Little sense of urgency: wait and see
approach
8
10. 10
WECC Wide Flexibility Study
10
Main zone:
• Optimal investment decisions
• Detailed treatment of operating
reserves
Other zones:
• Exogenous resource assumptions
and loads by scenario
Flows may be impacted by:
• Min and max intertie flow
constraints
• Min and max simultaneous flow
constraints for groups of interties
• Ramping constraints on interties
• Hurdle rates
Example zonal
structure – High
Renewable West
Scenario
11. 11
California dispatch, average net load day in May
California Overgeneration Driven
by Mid-day Solar Production
Gas fleet operates at
minimum, subject to
min gen constraint
Renewable production from solar PV
causes mid-day oversupply, leading
to curtailment
Significant imports
during shoulder periods
Renewable Penetration: 50%
(% of load)
Renewable Curtailment: 8.7%
(% of annual renewables)
Curtailment Frequency: 20%
(% of hours per year)
12. 12
Northwest dispatch, average net load day in May
Renewable Penetration: 30%
(% of load)
Renewable Curtailment: 6.1%
(% of annual renewables)
Curtailment Frequency: 10%
(% of hours)
Northwest Overgeneration Results
from Combined Hydro & Wind
Curtailment occurs throughout day
but is most pronounced at night
(low loads & high wind)
Hydro energy accounts for
significant shares of daily load
Significant exports
during off-peak hours,
but limited during
middle of day
13. 13
Southwest
Scale (MW)
0
7,000
Northwest
Scale (MW)
0
4,000
HE01 HE24
Jan
Feb
Mar
Apr
May
Jun
Jul
Aug
Sep
Oct
Nov
Dec
HE01 HE24
Jan
Feb
Mar
Apr
May
Jun
Jul
Aug
Sep
Oct
Nov
Dec
California
HE01 HE24
Jan
Feb
Mar
Apr
May
Jun
Jul
Aug
Sep
Oct
Nov
Dec
HE01 HE24
Jan
Feb
Mar
Apr
May
Jun
Jul
Aug
Sep
Oct
Nov
Dec
Tot: 8.7%
Scale (MW)
0
16,000
Tot: 3.0%
HE01 HE24
Jan
Feb
Mar
Apr
May
Jun
Jul
Aug
Sep
Oct
Nov
Dec
HE01 HE24
Jan
Feb
Mar
Apr
May
Jun
Jul
Aug
Sep
Oct
Nov
Dec
Regional Coordination is a Low-
Hanging Fruit Among Solutions
Historical Intertie
Limits
Physical Intertie
Limits
Tot: 5.6% Tot: 2.0%
Tot: 7.3% Tot: 6.1%
Large reductions in
nighttime curtailment
Large reductions
in non-spring
curtailment
Limited impact
on curtailment
14. 14
Storage Downward Flexibility
Reduces Curtailment
Addition of 6 GW of long-
duration storage relieves
curtailment
Addition of 6 GW of flexible
CCGTs has little impact
Source: TEPPC Western Interconnection Flexibility Assessment 04 Nov 2015
16. 16
Forward curves under energy
policy uncertainty
Reference case represents best in class energy market and capacity market
dispatch. Extension to scenario analysis approach describing key context and
impact of policy on energy market identifies critical market disruptions
16
Reference Case:
Compliance with existing policy, with
expected technology advancements
and cost reductions
High Renewables:
Implement required renewables to hit
goal despite budget constraints.
Increasing to 50% renewable
generation
REV Policy Case:
Assuming successful policy
implementation and increased DER
participation in energy markets.
Changing the load profile and load
factor
$0
$20
$40
$60
$80
$100
$120
2008
2010
2012
2014
2016
2018
2020
2022
2024
2026
2028
2030
2032
2034
EnergyPrice($/MWh)
Year
Historical
Business-as-usual
High Renewables
Long Island Baseload Energy Price ($/MWh)
Results show significant changes in market
fundamentals depending on policy case and zone
17. 17
REV Background and Impact
The goal of the REV proceeding is to facilitate the deployment of
distributed energy resources (DER), provide consumers with choice and
value over their energy use, and improve system efficiency
Details of how to these goals will be achieved are not finalized, but a
successful REV program should improve system efficiency
To assess wholesale impacts of distributed resources, we assume NYISO’s
system load factor improves to 60% by 2030 (agnostic to technology)
Details
17
1 24
Load(MW)
Hour
Hourly Load Shape in 2030
Base load shape
REV load shape
Flatter due to
various DER deployment
40%
45%
50%
55%
60%
65%
70%
75%
80%
1995
1997
1999
2001
2003
2005
2007
2009
2011
2013
2015
2017
2019
2021
2023
2025
2027
2029
LoadFactor(%)
Year
NYCA Annual Load Factor
Historical
Base
System efficiency
continues to decline
REV Scenario
DER improves
system efficiency
18. 18
0
1,000
2,000
3,000
4,000
5,000
6,000
BAU High RE REV
SummerCapability(MW)
Scenario
New Gas Plant Investment by 2035
CT Gas
CC Gas
Investment Outlook for New
Plants
Economics of new investment varies substantially
across scenarios
18
Technology BAU High RE REV
Combined Cycle High Low Medium
Combustion Turbine Medium Medium Low
Onshore Wind Medium High Medium
Offshore Wind Low High Low
Utility-scale Solar Low High Low
CC outlook poor due to depressed energy market
CTs still attractive in capacity market
DER impact on load shape
reduces need for peaking plants
Summary of Investment Outlook
20. System Overview
Oahu MauiMolokaiHawaii
Energy Production by Type
Peak Load (MW) 193 6 1176 197.3
Min Load (MW) 82 2 521 86.7
Pmin+ Downward
Reserve (MW) 61 1.8 277 46.98
Intermittent RE
Capacity ‘15 (MW) 111.8 1.7 420.1 134.3
Preapproved DG
PV (MW) 25 0.426 117.2 35
44% RE 8% RE 8% RE 32% RE
21. Island system constrained by Pmin
& reserves
Determine whether the net load
ever drops below Pmin +
reserves
• If so, normal system operations are
interrupted
How often do these events
occur?
What is the frequency and size
of the problem?
What are the potential solutions?
headroom
21
22. Comparing Curtailment Cost to
Battery Cost
2016
Curtailing renewables is cheaper than installing storage
– using traditional evaluation framework
24. Renewable integration solutions
24
Various solutions have been proposed,
with different performance
characteristics and costs
• Energy storage (pumped hydro, batteries,
compressed air, etc)
• Flexible loads or advanced DR
• Flexible gas resources (new flexible CCGTs,
Aero CTs, Reciprocating Engines or retrofits
to existing plants)
• Expansion/consolidation of balancing areas
• Time-of-use rates
Teslamotors.com
http://renews.biz/67193/vattenfall-pumps-new-life-into-80mw
Wartsila.com
http://allthingsd.com/files/2012/10
/Nest-Cooling-2.jpg
http://www.theiet.org/membership/member-
news/31a/ev-charging-course.cfm
25. Economics of renewable integration
The consequence of failing to supply enough flexibility
to integrate renewables is renewable curtailment
Full capability from procured renewables
Delivered energy from procured renewables
Curtailment
Renewable energy target
26. Option 1.
Overbuild renewables
Anticipated renewable
build
Curtailment-related
renewable overbuild
Option 1. Overbuild the renewable fleetOverbuilding the renewable
fleet allows for policy goal to
be met with some allowance
for curtailment
Curtailment
27. Option 2.
Pursue integration solutions
Option 2. Pursue integration solutionsIntegration solutions (eg.
storage, balancing area
consolidation) permit more
effective delivery of existing
renewable fleet
Energy Storage
Renewable build
Energy storage build
28. Option 3.
Mix of solutions (Options 1 & 2)
Option 3. Find optimal solutionOptimal solution combines
multiple strategies based on
costs and benefits
Energy Storage
Curtailment
Energy storage build
Anticipated renewable
build
Curtailment-related
renewable overbuild
29. Option 3 is Optimal Solution
Balances Storage with Overbuild
Optimal amount of
storage is highly
sensitive to assumed
technology costs
30. Identifying optimal investment in
solutions
30
Single solution case:
• The cost of the solution can
be weighed against the
avoided cost of overbuilding
renewables for RPS
compliance
Multiple solution case:
• Multidimensional
optimization
• Complex interactive effects
• Requires sophisticated
model that treats both
operations and
investment costs
Optimal investment point:
Marginal avoided cost of
renewable overbuild
=
Marginal cost of solution
31. Example analysis:
Optimal storage investment
31
Wide uncertainty
in future cost
reductions
Wide range in
optimal
storage build
Base
Assumption
Q. Given the wide range of potential
future cost trajectories, what is the
optimal amount of energy storage?
RESOLVE: Storage cost scenarios
can be designed to provide a
plausible range of least-cost storage
procurement strategies; can also:
• Identify timing of storage build
across sensitivities
• Test cost impacts of suboptimal
storage build
Storage technology costs
ultimately determine the optimal
energy storage investment
High level of uncertainty
complicates the planning
problem
33. Capacity Value of Renewables
Declines Significantly Above 33%
High penetration of solar PV pushes the “net peak”
demand that must be met with dispatchable resources
into evening hours
California will continue to need capacity resources to
meet peak demands
0
10
20
30
40
50
60
1 2 3 4 5 6 7 8 9 101112131415161718192021222324
Load(GW)
Hour
0
1
2
3
4
5
6
0 6 12 18PeakLoadReduction(GW)
Installed Solar PV Capacity (GW)
Daily Load Shape with Increasing Solar PV
Cumulative Peak Load Reduction
34. Storage as Part of Optimal
Portfolio
34
Description
Current situation
Key metrics
13.5 MW:Current peak
56,000 MWh:Energy
5%/year:Load Growth
24 hr load
profile
Year on year
load profile
BaseCaseForecast
Alternative future states
Upgradeelements
DER 1Hardware DER 2
11 MW 8 MW 4 MWHardware
Solar
DR
EE
Storage
Keymetrics
24 hr load
profile
0 MW 1.6 MW 4.4 MW
0 MW 3.3 MW 3.3 MW
0 MW 1.6 MW 1.6 MW
0 MW 0 MW 5 MW
Cash flow
24 hr load
profile
Cash flow
24 hr load
profile
Year on
year load
profile
Year on
year load
profile
Year on
year load
profile
Cash flow
High load growth in
urban area where
upgrades are expensive
due to site constraints
35. Storage Reduces Risk
35
Next gen solution
▪ Plan based on value
of reliability and cost
of upgrade
▪ Factor in forecast
uncertainty into
investment decision
IDSM ApproachCurrent solution
▪ Engineering
studies to
identify N-1
redundancy
requirement
Identifying
investment
▪ Choose from
traditional T&D
capital
investment
supply options
▪ Expand options to
meet load growth
and reliability needs
to include DER
▪ Integrate DER and
traditional
investments in
decision process
Investment
options for
maintaining
reliability
Peak load served (MW)
Systemavailability
(%likelihood)
99.999%
Additional
service from
investment
Forecast Years
PeakLoad(MW)
Forecast
uncertainty
captured
substation
modular
Integrated
DER
Presentvalue$
substation
modular
Integrated
DER
Expectedoutage$
36. Conclusions for energy storage
Utilities feel little sense of urgency: have a wait
and see approach
Traditional models and valuation frameworks
undervalue the flexibility that storage provides
To utilities regional coordination and renewable
curtailment look like cheaper alternatives to
storage
Looking further ahead with stochastic, portfolio
models is crucial to fully value storage
Need to show utilities that storage is part of an
optimal portfolio in an uncertain world
36
37. Thank You!
Energy and Environmental Economics, Inc. (E3)
101 Montgomery Street, Suite 1600
San Francisco, CA 94104
Tel 415-391-5100
Web: http://www.ethree.com
Eric Cutter (eric@ethree.com)