Culminating handout completed 2000
•
0 likes•152 views

This document provides instructions for students to design an isodemographic map of Canada as a culminating activity. Students will calculate population percentages and determine the number of squares to allocate to each province/territory based on a multiplier. They will then create a rough draft of the map and transfer it to a final copy, adding labels, colors, and a scale. The document outlines the timeline for in-class preparation periods and the final deadline.

Recommended
More Related Content
Viewers also liked
Viewers also liked (18)
More from enidwray
More from enidwray (20)
Recently uploaded
Recently uploaded (20)
Culminating handout completed 2000
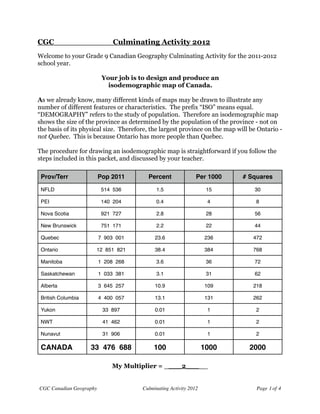
- 1. CGC Culminating Activity 2012 Welcome to your Grade 9 Canadian Geography Culminating Activity for the 2011-2012 school year. Your job is to design and produce an isodemographic map of Canada. As we already know, many different kinds of maps may be drawn to illustrate any number of different features or characteristics. The prefix “ISO” means equal. “DEMOGRAPHY” refers to the study of population. Therefore an isodemographic map shows the size of the province as determined by the population of the province - not on the basis of its physical size. Therefore, the largest province on the map will be Ontario - not Quebec. This is because Ontario has more people than Quebec. The procedure for drawing an isodemographic map is straightforward if you follow the steps included in this packet, and discussed by your teacher. Prov/Terr Pop 2011 Percent Per 1000 # Squares NFLD 514 536 1.5 15 30 PEI 140 204 0.4 4 8 Nova Scotia 921 727 2.8 28 56 New Brunswick 751 171 2.2 22 44 Quebec 7 903 001 23.6 236 472 Ontario 12 851 821 38.4 384 768 Manitoba 1 208 268 3.6 36 72 Saskatchewan 1 033 381 3.1 31 62 Alberta 3 645 257 10.9 109 218 British Columbia 4 400 057 13.1 131 262 Yukon 33 897 0.01 1 2 NWT 41 462 0.01 1 2 Nunavut 31 906 0.01 1 2 CANADA 33 476 688 100 1000 2000 My Multiplier = ____2_____ CGC Canadian Geography Culminating Activity 2012 Page 1 of 4
- 2. Step #1: Calculate the percentage population by Prov/Terr. To calculate the percent: (prov/terr pop) / (Canada pop) x 100 Step #2: Calculate the number of squares per thousand per Prov/ Terr. “Per thousand” refers to the number of squares each province or territory would account for if all of Canada were represented by 1000 squares. To calculate this simply multiply the percent for each province or territory by 10 (and round accordingly!!) Step #3: Calculate the number of squares per Prov/Terr based upon the size of your finished map. “Multiplier” will typically be a number between one and four. This is the number of thousand’s of squares which will be the total finished size of your map. You multiply each province or territory “per 1000” by this number to generate the total number of squares you will assign to each. Decide on the number of squares that you wish to use to represent Canada. Your number must be a multiple of 1000. A recommendation is that you work with no less than 1000 and no more than 4000 squares. Once you have decided on the size of your map enter your number in the “multiplier” column. Now, calculate the total number of squares for each province/territory and fill in the total number of squares for Canada. Step #4: Plan, and prepare, your rough copy Use the graph paper provided to construct the rough copy of your isodemographic map of Canada. Organise your squares into a pattern which resembles - as closely as possible - the outline map of Canada. Alternatively, you may choose to organise your “map” into some iconic, Canadian symbol (or representation). If your map is larger than one sheet... simply tape the sheets together on the reverse side. You would be well advised to bring in a paper towel roll, or two toilet paper rolls, to transport your finished copy paper without incident. Step #5: Transfer your rough work to your finished paper Draw a heavy marked outline around each of your provinces. Lay a clean sheet of paper for your final copy over your rough copy and trace your provincial and territorial outlines. Step #6: Finishing Touches Complete your isodemographic map as follows: • draw a border around the finished map (as appropriate... if in doubt, discuss with your teacher). The border should be an equal width all the way around the page • title your map appropriately • colour your map - each province must be clearly identifiable (as appropriate) and no two adjacent provinces should be the same colour or design • give your map a scale (of some variety!!... talk to your teacher for suggestions) • include a legend (as necessary) • put your name on the back CGC Canadian Geography Culminating Activity 2012 Page 2 of 4
- 3. Culminating Activity Timelines Ms. Wray’s classes ONLY! CA Distribution Fri May 11th In-Class Prep Period #1 Thurs May 17th In-Class Prep Period #2 Tues May 22nd In-Class Prep Period #3 Thurs May 24th Final Product Due Date Wed May 30th In-Class Prep Period Work Schedule Prep Period #1 Calculations: Calculate percentages, determine size of finished map, calculate relative areas Begin laying out your rough draft Prep Period #2 Continue/Complete laying out your rough draft Prep Period #3 Complete laying out your rough draft (as needs be) Transfer your rough draft to finished paper... begin putting finishing touches to your map Working files sent home for final assembly All of the planning and initial preparation of your finished product will be done during dedicated in-class sessions. The schedule for these in-class sessions was included in the Course of Study you received on the first day of class in September... and is reproduced below. You will be required to take your rough work home with you, over a final weekend, to complete your finished submission. All final submissions must be accompanied by your complete set of rough work. All of your rough work will remain in the classroom, in a personal portfolio, throughout the process. No work leaves the classroom until the final weekend. CGC Canadian Geography Culminating Activity 2012 Page 3 of 4
- 4. CGC ___________Culminating Activity 2012 Parent Confirmation Sheet • All students are expected to be present for each of the in-class Prep Periods. • Any student absences from class must be documented by a note from a parent. Additionally the student will be expected to make up for the missed class time as soon as possible, at the convenience of the teacher. • No extensions will be given with respect to the final deadline except under extraordinary circumstances at the discretion of the teacher (this applies even to student’s who are absent for any of the in-class Prep periods). • Final submissions may not be marked unless all required materials are returned with the final submission. This includes this completed parent signature sheet. This Parent Information Sheet should be returned, with signature, for the first Prep Period. It will remain on-file in the classroom with the rest of this handout and the student’s rough work. • Students with IEP’s who are allowed extra time will be provided with that time either before or after class (i.e. arrive 30 minutes before the start of class during the lunch hour, or remain behind for 30 minutes after Period 2/6 and/or the last period of the day). Please sign below to indicate that you have read over the assignment and understand the responsibilties that your son/daughter/ward has with respect to this final summative assignment. Student Name: ______________________________________ Student Signature: ______________________________________ Parent Name: ______________________________________ Parent Signature: ______________________________________ Date: ______________________________________ CGC Canadian Geography Culminating Activity 2012 Page 4 of 4