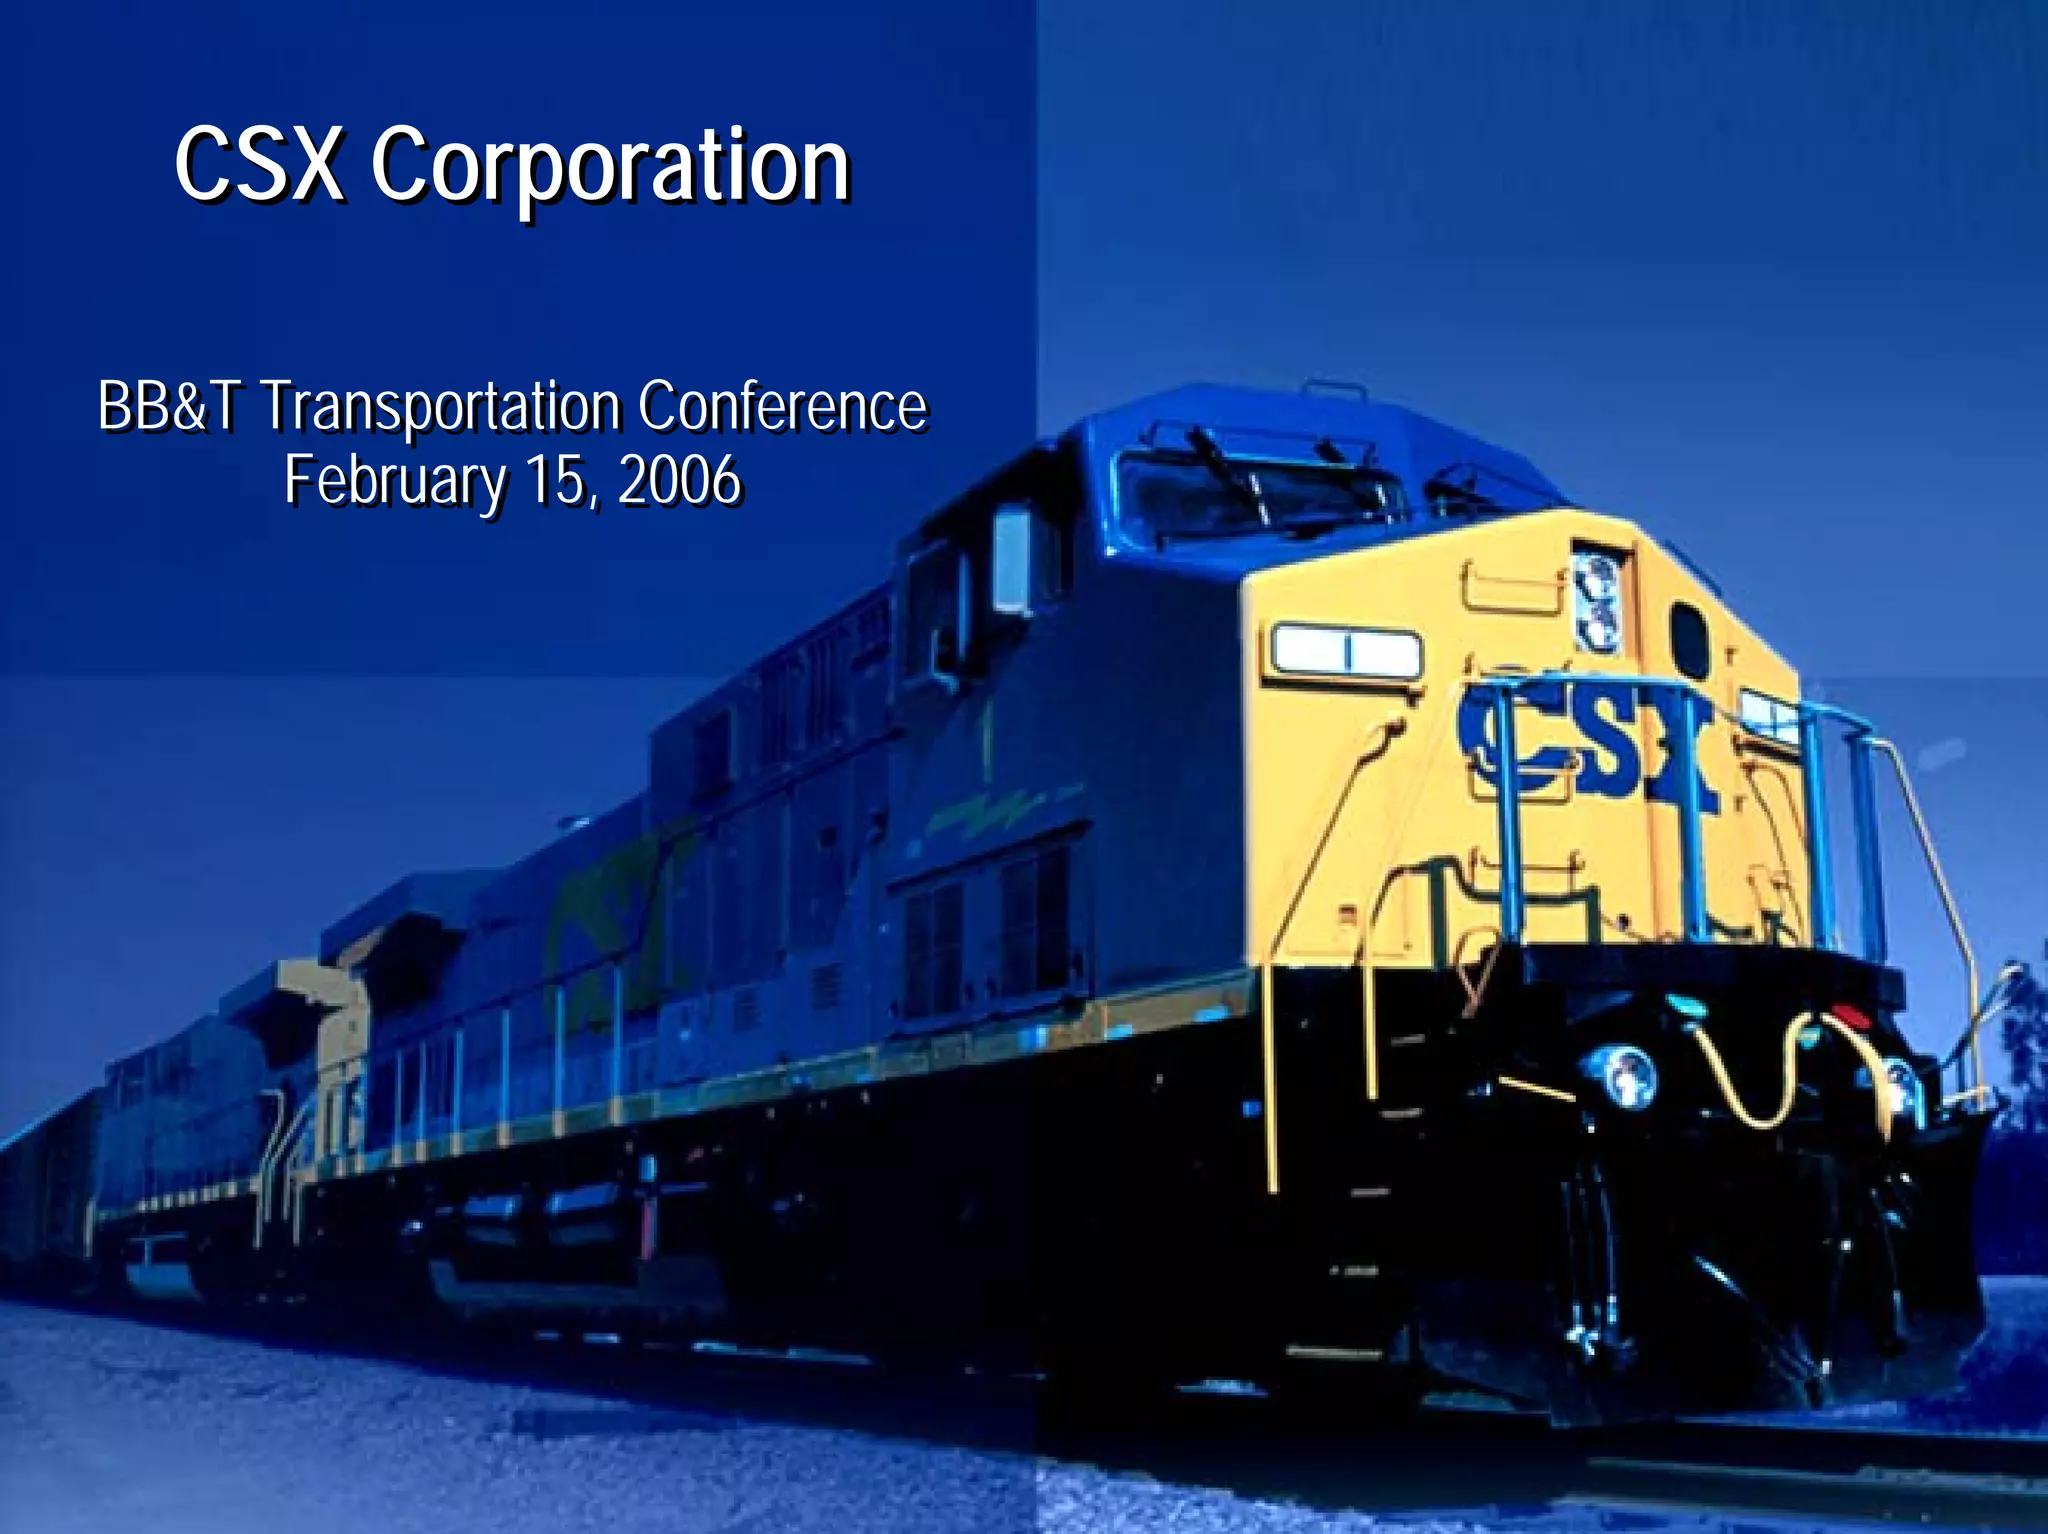
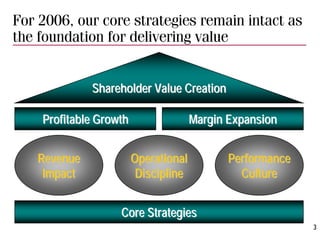
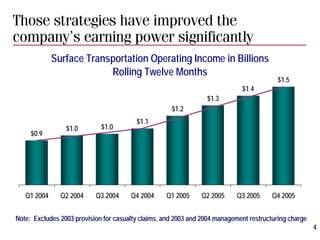
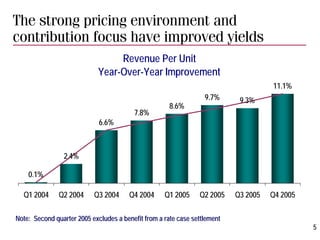
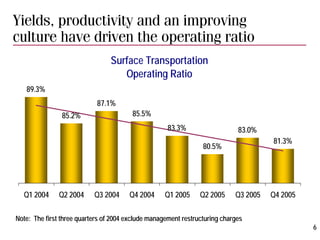
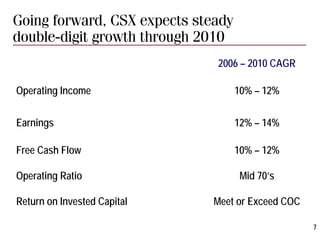
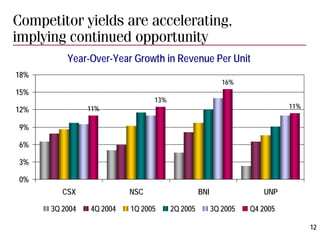
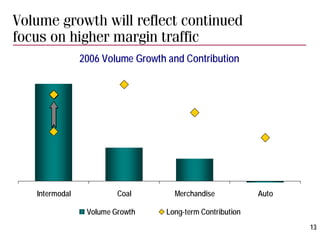
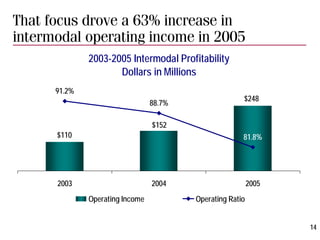
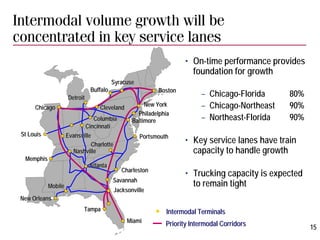
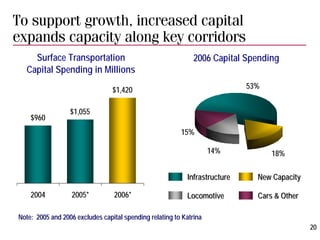
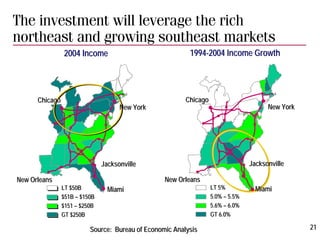
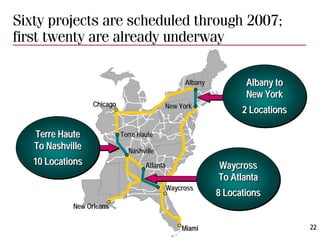
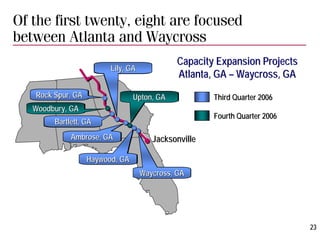
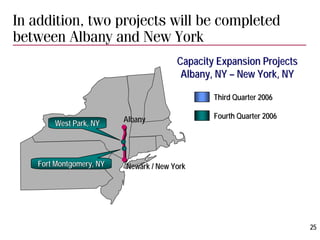
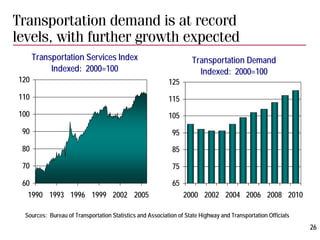
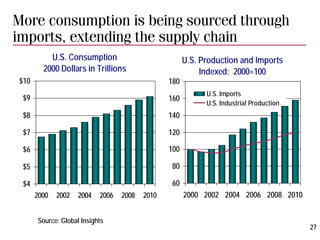
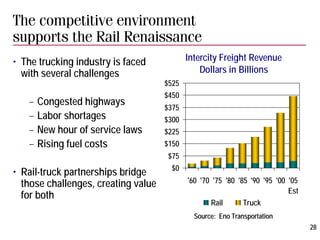
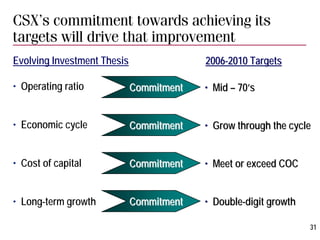
CSX Corporation presented at the BB&T Transportation Conference on February 15, 2006. CSX discussed its strategies of profitable growth and margin expansion through revenue impact, operational discipline, and performance culture. CSX also reviewed its financial and operational performance over the past years, and its expectations for continued double-digit growth through 2010. CSX outlined various capacity expansion projects along key corridors to support further growth in demand.
Shiv-Vani Oil and Gas (SOGES) reported strong results for the first quarter of fiscal year 2011. Revenue grew 43.8% over the previous year to Rs399 crore, driven by the deployment of two additional drilling rigs. Operating profit margin expanded 302 basis points to 44% despite rupee appreciation. Net profit increased 53.4% to Rs65 crore. The company maintained a strong order backlog of Rs3,200 crore, providing visibility for continued growth. The analyst expects SOGES to grow revenues and profits at a compounded annual growth rate of 24.4% and 14.5% respectively over the fiscal years 2009 to 2012. The stock remains rated a "Buy" with
Sesa Goa reported strong growth in net sales and profits for the fourth quarter and full year of fiscal year 2010. Net sales grew 67.6% year-over-year for the quarter and 18.1% for the full year. Net profit increased 121.5% year-over-year for the quarter and 32.2% for the full year, exceeding estimates. However, the company missed its annual volume growth guidance of 20-25% due to delays in mining permits and cyclones impacting production. While near-term strength in iron ore prices is priced into the stock, uncertainties around mining regulations and surplus cash deployment lead the analyst to maintain a neutral rating.
The document discusses forward-looking statements and risks associated with them. It provides an overview of Atmos Energy, including its scope of operations across 12 states in the utility segment and 22 states in the nonutility segment. It also summarizes Atmos Energy's financial and operational performance over time, including earnings growth, dividend increases, and acquisition history such as the purchase of TXU Gas.
For 1QFY2011, NMDC reported a 97% increase in net sales to Rs2,518cr driven by higher iron ore realizations and sales volume. Net profit grew 94.4% to Rs1,504cr due to strong top-line growth. EBITDA margin expanded significantly by 726bps to 81.5% despite higher royalty charges. The company aims to increase production capacity to 50mn tonnes by FY2014-15 through mine expansion projects, however volume growth faces risks from ongoing Naxal activities in its mine areas. At the current market price, the stock trades at lower multiples compared to its historical averages.
Banco ABC - 4th Quarter 2008 Results PresentationBanco ABC Brasil
The document is Banco ABC Brasil's 4Q08 earnings presentation from February 18, 2009. It highlights the bank's recurring net income growth of 36% in 2008 to BRL 160.7 million. Net income in 4Q08 was BRL 30.9 million, down 36.2% from 3Q08 due to additional loan loss provisions. The credit portfolio reached BRL 6.485 billion, growing 29.9% year-over-year. Credit quality remained high, with 97.6% of loans rated AA to C by the Central Bank.
For 2QFY2011, TVS Motor (TVSM) reported:
1) Net sales growth of 43% year-over-year to Rs. 1,616 crore, slightly above estimates, driven by a 33.4% increase in total volumes.
2) EBITDA margin expanded 20 basis points quarter-over-quarter to 6.7%, marginally below estimates.
3) Net profit grew 123.1% year-over-year to Rs. 54.8 crore, above expectations, due to lower interest costs and tax rates.
The analyst maintains earnings estimates for TVSM but remains Neutral on the stock, believing the recent run-up factors in expected growth over
SAIL's 4QFY2010 results were in line with estimates. Revenues grew 1.8% to Rs11,955cr due to higher sales volumes and average realization. EBITDA margins expanded significantly to 25.9% due to lower raw material costs and consumption, leading to a 40.2% rise in net income to Rs2,085cr. While demand is expected to remain strong, the company maintains a neutral outlook given rich valuations and plans for a public offering limiting further upside.
Sesa Goa's 1QFY2011 results were in line with estimates at the top line, but bottom line was ahead due to a lower tax rate. Top line growth of 138.6% was driven by higher iron ore prices, while volume growth was only 14.9% due to permit issues. EBITDA margins expanded significantly due to strong operations leading to a 208.3% rise in net profit. While Chinese steel and iron ore production is growing, imports have declined recently due to rising domestic Chinese iron ore production, causing a 31.5% drop in iron ore prices since April. The company is trading at attractive valuations but the outlook for volume growth is uncertain due to delays in permits and infrastructure issues.
Hindalco reported strong results for the first quarter of fiscal year 2011. Revenue grew 29.2% year-over-year to Rs. 2,533 crore, driven by a 12.7% increase in aluminum shipments. Adjusted EBITDA more than doubled to Rs. 263 crore, resulting in adjusted EBITDA margins of 10.4%. However, net profit declined 65% to Rs. 50 crore due to higher interest and tax expenses. Management expects continued growth in demand and benefits from capacity expansions. The stock currently trades at attractive valuations and the analyst maintains a Buy rating with a target price of Rs. 204.
Cairn India reported a quarterly net profit of Rs281cr for 1QFY2011, an increase of 519.3% over the previous year. Revenue grew 310.1% to Rs841cr due to higher production and realisations from the Mangala oil fields. Operating margins expanded significantly to 77% from 64.5% last year due to lower production costs. However, net profit was lower than estimates due to higher financing costs and lower other income. While production and revenues grew strongly year-over-year, costs were also higher than expected, leading to profits below analyst forecasts.
GSPL reported a 1QFY2011 total operating income of Rs. 252 cr, a 19.4% increase over 1QFY2010 but slightly below expectations. EBITDA grew 20.3% to Rs. 238 cr but was also below estimates. Profits were higher year-over-year with PAT of Rs. 105 cr, up 30.6% from Rs. 80 cr in 1QFY2010, however profits were lower than expected. Transmission volumes increased 43.4% year-over-year but average transmission tariffs decreased 16.7% year-over-year, contributing to revenue being lower than estimated. Despite missing estimates, the analyst maintains an accumulate rating on GSPL due to growth potential
1) Infosys reported modest revenue growth of 3.2% qoq for 1QFY2012. EBITDA and margins declined due to wage hikes.
2) Guidance for 2QFY2012 revenue growth was lower than expected at 3.5-5% qoq. Annual revenue growth guidance was unchanged.
3) The analyst revised EPS estimates down and the target price to Rs 3,200, maintaining an "Accumulate" rating given macro concerns.
Banco ABC - 3rd Quarter 2009 Earnings PresentationBanco ABC Brasil
Banco ABC Brasil reported financial results for the third quarter of 2009. Some key highlights include:
- The credit portfolio reached BRL 7.4 billion, an increase of 12.5% over the previous quarter. Credit quality improved with the non-performing loan ratio falling to 0.6%.
- Net income totaled BRL 38.1 million, up 7.7% from the previous quarter. BRL 16.4 million in interest on equity was paid to shareholders.
- The return on average equity was 13.0% for the quarter, up from 12.0% in the prior quarter.
- The credit portfolio rating remained strong with 95% rated AA-C
Rallis India reported strong results for the first quarter of fiscal year 2012. Revenue grew 48.7% year-over-year to Rs. 292 crore, driven primarily by higher revenue from Metahelix, which Rallis acquired in December 2010. Standalone revenue also rose 17% on higher volumes. EBITDA margin expanded significantly to 14.7% due to higher margins in seeds and improvements in standalone business. While the results were good, the analyst remains neutral on the stock due to its fair valuation.
Bayer CropScience reported disappointing 1QFY2011 results with 20% revenue growth and an 8% decline in profit. EBITDA margin contracted to 11% from 14% due to a 358 basis point drop in gross margins. While the company is expected to benefit from high commodity prices, its stock price is nearing the analyst's revised target valuation after recent gains. The analyst maintains a Neutral rating.
Maybank - proposed dividend reinvestment plan EGM 14 may 2010guest6398289
The document proposes a dividend reinvestment plan and provides key financial highlights for Maybank for 3Q10 and 9M10. PATAMI for 3Q10 rose 104.7% YoY to RM1,030 million. For 9M10, PATAMI rose 60.5% YoY to RM2,906 million. Asset quality continued to improve with the net NPL ratio declining to 1.36%. The meeting will discuss and vote on the proposed dividend reinvestment plan.
SpiceJet reported strong financial results for the 1st quarter of FY2011, with net sales growing 34.9% year-over-year to Rs708cr, above expectations. Operating margins expanded significantly to 8.3% due to higher passenger loads. Net profit increased 109.6% to Rs55cr, also above estimates, driven by improved operating efficiency. The analyst maintains an 'Accumulate' rating on SpiceJet, expecting sales and profits to grow rapidly in the coming years as the company expands its fleet and benefits from strong industry demand fundamentals.
Energias do Brasil reported its 4Q06 earnings results. Key highlights included a 5.5% increase in net revenues and a 17.6% increase in EBITDA. Distributed energy volume showed a strong recovery in 4Q06. Generation benefited from Peixe Angical and Mascarenhas plants operating at full capacity. Commercialization was impacted by lower self-dealing, offset by free market growth. The company also discussed its continued focus on efficiency programs, debt management, and investments in distribution, generation and universalization programs.
Marico reported strong revenue growth of 33% year-over-year for the first quarter, driven by double-digit volume growth in its core brands Parachute and Saffola. Parachute saw 10% volume growth and Saffola grew by around 15% despite price hikes by both brands. Operating margins declined slightly due to rising input costs. The analyst maintains a neutral rating on Marico, seeing the stock as fairly valued based on projected growth rates.
Jain Irrigation Systems reported financial results for the fourth quarter of fiscal year 2010 that were ahead of estimates. Revenue grew 37% year-over-year driven by strong growth in the micro irrigation systems segment. Net profit increased significantly due to foreign exchange gains, while adjusted net profit grew 40% on higher sales and stable margins. However, margins were slightly lower than the previous year due to higher raw material costs for onions. While growth is expected to continue across segments, the stock price is nearing fair value, leading to a downgrade from "Buy" to "Accumulate."
GAIL reported strong financial results for the 1st quarter of FY2011. Revenues grew 17.8% year-over-year to Rs. 7,096 crore, exceeding estimates, driven by growth in the natural gas transmission, trading and LPG segments. Operating profit margin expanded 252 basis points to 20.2% due to higher volumes, tariffs and margins across segments, with the exception of petrochemicals. Net profit increased 35.2% to Rs. 887 crore, in line with estimates, as a result of the revenue and margin growth. The company maintained its strong performance across key business segments.
Empresa Brasileira de Tecnologia atuando com inteligência e soluções inovadoras de TI, para garantir a continuidade dos negócios de nossos clientes, com segurança, a qualquer hora e em qualquer parte do mundo.
Nossa expertise está na proteção, gerenciamento, rastreamento, segurança e controle de informações, acessos, ativos e imagem empresarial.
Entregamos tranquilidade e confiança. - Segurança e Governança
Syracuse Chamber Of Commerce Presentationsyrchamber
Ascent Aviation Group supplies aviation fuels, motor fuels including biodiesel, deicing fluids, and fuel equipment and services to fleet operators in Central New York. Ascent has over 30 years of aviation fuel distribution experience and relationships with major fuel refiners. It produces biodiesel that meets ASTM standards and BQ9000 certification for fuel quality through a state-of-the-art blending process at its facility with 30,000 gallons of heated biodiesel storage.
The document provides instructions for maintaining a website through the WordPress content management system. It outlines how to edit pages, posts, media, users and settings. Key areas that can be modified include headers, images, text content, links and categories. Administrative access and login credentials are also listed.
The document discusses strategic approaches for businesses to take advantage of opportunities presented by the American Recovery and Reinvestment Act of 2009 (ARRA). It outlines that traditional responses to increased government spending have often yielded suboptimal results. It recommends a rigorous three step process: 1) Developing an external market view of ARRA opportunities through in-depth analysis, 2) Conducting an internal capabilities assessment, and 3) Creating a coordinated action plan. The unprecedented scale, complexity, pace, and transparency of the ARRA require a systematic strategic approach focused on analysis, innovation, coordination and execution rather than typical short-term tactical responses.
The document discusses CSX Corporation's strategies and financial performance in 2005. It outlines the company's core strategies of operating initiatives, organizational structure improvements, and building on foundations established in 2004. Key drivers of the company's increased operating income and declining operating ratio included price and volume increases, productivity improvements, and fuel surcharges. The company's stock performance exceeded benchmarks like the S&P 500 and transport indexes over the period discussed.
The document discusses CSX Corporation's performance and strategies. It summarizes that CSX has implemented strategies focused on price increases, productivity improvements, and organizational changes that have significantly improved earnings. While CSX faces headwinds from declining fuel hedges in 2006, it expects steady double-digit earnings growth over the next five years through continued pricing power and productivity initiatives. CSX is well-positioned to benefit from growth in the Southeast region of the United States that it connects to major markets like New York and Chicago.
The document is CSX Corporation's first quarter 2006 earnings presentation. It summarizes that EPS from continuing operations increased 56% compared to the first quarter of 2005. It also discusses that safety momentum remains strong, ONE Plan execution is gaining solid momentum, and capacity expansion projects are on track. Operational metrics like on-time performance, asset utilization, and velocity are also improving.
CSX Corporation reported record first quarter earnings in 2006. Earnings per share from continuing operations were up 56% compared to the first quarter of 2005. Surface transportation revenues increased 11% due to strong performance across all markets and a 12% increase in revenue per unit. Capacity expansion projects remained on track to add additional capacity. Looking forward, CSX expects demand to remain strong and the favorable pricing environment to continue as operational improvements drive further volume growth.
In the first quarter of 2007, CSX reported earnings per share of $0.52 compared to $0.53 in the first quarter of 2006. Excluding insurance recoveries, comparable earnings per share was $0.50. Surface transportation operating income was $469 million, compared to $487 million in 2006, excluding insurance recoveries in both periods. Revenue increased 4% to $2.422 billion driven by a 10% increase in revenue per unit, offset by a 5% decline in volumes. Expenses increased primarily due to higher materials, supplies and other costs and depreciation, though this was partially offset by productivity gains.
In the first quarter of 2007, CSX reported earnings per share of $0.52 compared to $0.53 in the first quarter of 2006. Excluding insurance recoveries, comparable earnings per share were $0.50. Surface transportation operating income was $469 million, compared to $487 million in 2006, excluding insurance recoveries in both periods. Revenue increased 4% to $2.422 billion driven by strong pricing, despite a 5% decline in volumes. The company also discussed trends in expenses, operating metrics, future growth opportunities, and shareholder capital allocation.
This presentation summarizes CSX's second quarter 2006 earnings. It discusses CSX's financial results including earnings per share for the second quarter and comparable earnings per share excluding certain items. It also provides operational updates on key metrics like safety performance, on-time performance, asset utilization, and velocity. Safety performance and productivity continue to improve due to CSX's ONE Plan initiatives and leadership focus on operational execution and reliability.
The document summarizes CSX's second quarter 2006 earnings presentation. It discusses strong financial results including record revenues that were up 12% and operating income increasing 23%. It also highlights continued momentum in safety and operational performance from implementing the ONE Plan, as well as an outlook for further growth supported by equity actions reflecting the company's strong fundamentals.
This document summarizes CSX Corporation's presentation at the Citigroup Transportation Conference in November 2007. The presentation outlines CSX's positive fourth quarter revenue outlook, strong financial results, and strategies to drive earnings growth. CSX aims to achieve 10-12% annual operating income growth and a mid-low 70s operating ratio by 2010 through productivity improvements, value pricing, and total service integration.
1) CSX reported positive fourth quarter revenue outlooks for several industries including agricultural products, chemicals, coal, and metals, while noting automotive and food & consumer as neutral or unfavorable.
2) CSX has delivered strong financial results in recent years and is targeting 10-12% annual operating income growth and 15-17% annual earnings per share growth through 2010.
3) Key strategies like restructuring, productivity initiatives, and value pricing have driven margins higher, with the operating ratio goal of the mid-low 70s by 2010.
omnicom group Q4 2006 Investor Presentationfinance22
The document provides financial information for Omnicom Group for the fourth quarter and full year of 2006. It shows that revenue grew 9.4% in the fourth quarter and 8.5% for the full year compared to 2005. Net income increased 9.7% in the fourth quarter and 9.3% for the full year. Revenue growth was driven by organic growth of 6.6% in the fourth quarter and 7.6% for the full year, as well as a positive foreign exchange impact. By discipline, CRM experienced the strongest growth at 15% in the fourth quarter and 13% for the full year.
This presentation provides an overview and summary of CSX Corporation's financial performance and targets. CSX has created significant shareholder value as shown by strong stock performance that has outpaced industry benchmarks. The company is targeting double-digit earnings growth through 2010 by further improving its operating ratio to the mid-70s range and increasing operating income and earnings per share at a compound annual growth rate of 10-12% and 15-17%, respectively. CSX will balance capital investments focused on growth with returning cash to shareholders through dividends and share buybacks.
Oscar Munoz, CFO of CSX, presented at the Merrill Lynch Global Transportation Conference. He discussed CSX's strong financial results in the first quarter of 2005, including a 72% increase in operating income. However, Munoz noted that operational challenges remain, such as improving average train speed. Munoz also outlined CSX's strategy to leverage its integrated network and position itself for long-term growth in an evolving transportation marketplace.
Oscar Munoz, CFO of CSX, presented at the Merrill Lynch Global Transportation Conference. He discussed CSX's strong financial results in the first quarter of 2005, including a 72% increase in operating income. Munoz also outlined CSX's strategies to continue improving operations and financial performance through its ONE Plan and other initiatives. Looking forward, Munoz said CSX will provide more details on its long-term strategy and financial targets at an investor conference in August.
In the second quarter of 2007, CSX reported strong financial results with record revenues of $2.53 billion, up 5% from the previous year. Comparable earnings per share increased 22% to $0.71 compared to $0.58 in the prior year. Surface transportation operating income was up 16% to $603 million, driven by pricing gains and productivity improvements that helped lower the operating ratio to 76.2%, a 2.4 point improvement over 2006. Revenues and operating income increased despite declines in certain markets, demonstrating the company's ability to leverage pricing strength and offset volume weakness.
In the second quarter of 2007, CSX reported strong financial results with record revenues of $2.53 billion, up 5% from the previous year. Comparable earnings per share increased 22% to $0.71 compared to $0.58 in the prior year. Surface transportation operating income was up 16% to $603 million, driven by pricing gains and productivity improvements that helped lower the operating ratio to 76.2%, a 2.4 point improvement over 2006. Revenues and operating income increased despite lower volumes as pricing actions produced gains.
CSX Corporation reported fourth quarter 2005 earnings per share of $1.03, a 45% increase over fourth quarter 2004 earnings per share of $0.71. Surface transportation operating income increased 32% to $415 million compared to $315 million in fourth quarter 2004. Revenues increased 8% to $2.219 billion on strong yield increases, while expenses increased only 3% due to productivity gains offsetting higher fuel and labor costs. The company expects continued revenue growth and service improvements to drive further increases in 2006.
CMC is a global steel and metals company with over 14,000 employees worldwide. It manufactures, recycles, markets, and distributes steel and metal products through a network of over 200 locations globally. CMC operates steel minimills, fabrication plants, service centers, and recycling facilities. It aims to be vertically integrated and diversified in its product offerings and geographic reach.
The document provides an overview of CMC's business model which focuses on vertical integration, product diversification, and global geographic dispersion. It then discusses CMC's current market conditions and outlook across different geographic regions and product lines, including details on earnings expectations, capital investment projects, and quarterly financial statistics. The document also reviews factors influencing costs and selling prices for CMC's various steel manufacturing operations in North America.
The document provides an overview of CMC, a global steel and metals company. It discusses CMC's business model which focuses on vertical integration, product diversification, and global geographic dispersion. It also summarizes CMC's track record of conservative management and 30 consecutive years of profitability. Finally, it outlines CMC's five operating segments and overall strategy of achieving a global reach through regional focus and growth in key markets.
CMC is a global steel and metals company with over 14,000 employees worldwide. It manufactures, recycles, markets, and distributes steel and metal products through a network of over 200 locations globally. CMC operates steel minimills, fabrication plants, service centers, and recycling facilities. It aims to vertically integrate its operations from scrap processing to steel fabrication to provide a hedge against steel and metal price fluctuations.
The document provides an overview of CMC's business model, current market conditions, earnings results, and operational metrics for the third quarter of 2008. It discusses CMC's strategy of vertical integration, product diversification, and global geographic dispersion. It also reviews earnings, sales, margins, capital investments, and performance across CMC's different business segments.
The document provides an overview of CMC's business model, current market conditions, earnings results, and operational metrics for the third quarter of 2008. It discusses CMC's strategy of vertical integration, product diversification, and global geographic dispersion. It also reviews demand trends, input costs, earnings, investments, segment performance, and operational details.
This document provides an overview of Commercial Metals Company (CMC) and its quarterly performance. It discusses CMC's business model, including its vertical integration and product and geographic diversification. It also summarizes CMC's financial performance from 2003-2007, highlighting increasing sales, earnings, and shareholder returns over that period. Current market conditions and CMC's outlook are briefly addressed.
The document provides an overview of CMC's business model and current market conditions for the 4th quarter of 2008. It summarizes CMC's key business segments, product lines, capital projects, financial statistics, and discusses challenges in the global steel market including falling prices, reduced demand, and excess inventory. It analyzes factors such as raw material costs, sales prices, margins, and operating profits across CMC's divisions.
The document provides an overview of CMC's business model and current market conditions for the 4th quarter of 2008. It summarizes CMC's key business segments, current projects, liquidity position, financial statistics, and discusses challenges in the global steel market including falling prices, reduced demand, and excess inventory. It analyzes performance and outlook for CMC's Americas and international operations.
This document summarizes notes from the 4th Annual Global Steel CEO Forum held by Goldman Sachs on December 4, 2008. It discusses the current challenging market conditions for the steel industry due to the global liquidity crisis, including falling prices, production cutbacks, and declining demand. Updates are provided on conditions and outlook for different markets, including further price declines and inventory reductions in North America, continued cutbacks and oversupply in Europe and the Middle East, and China's efforts to stimulate domestic demand and infrastructure spending to boost its economy and steel demand. Breaking the negative cycle depends on the effectiveness of global government intervention programs and restoration of confidence.
The document discusses how Commercial Metals Company (CMC) is different from other steel companies. It notes that CMC focuses on long steel products, has diversified its business across five segments including steel mills, fabrication, recycling, and marketing, and has a track record of consistent profitability and financial strength over 26 years. The document aims to show investors that CMC's strategy and performance set it apart from other steel industry firms.
The document discusses how Commercial Metals Company (CMC) is different from other steel companies. It notes that CMC focuses on long steel products, has diversified its business across five segments including steel mills, fabrication plants, recycling, and marketing/distribution, and has a track record of consistent profitability and financial strength over 26 years. The document aims to show shareholders that CMC's business strategy and performance set it apart from other steel industry firms.
This document is Commercial Metals Company's 2005 Annual Report. It summarizes the company's financial performance for fiscal year 2005, including record net earnings of $286 million on net sales of $6.6 billion, up from $132 million on $4.8 billion the previous year. It discusses positive results across the company's business segments, including Domestic Mills, Domestic Fabrication, Recycling, and Marketing & Distribution. The annual report also provides an overview of the company's operations, strategic focus on vertical integration, and capital expenditure plans.
This document is the 2005 annual report for Commercial Metals Company. It summarizes the company's financial performance for fiscal year 2005, which saw record net earnings of $286 million on net sales of $6.6 billion, up from $132 million on $4.8 billion the previous year. The company's domestic mills and fabrication segments significantly outperformed the prior year due to higher steel prices and strong end-user demand. While operations in Poland saw a decline from the prior year, performance improved in the fourth quarter. Overall, the company benefited from favorable market conditions across most of its businesses.
This document is Commercial Metals Company's 2005 Annual Report which summarizes the company's financial performance for fiscal year 2005. Some key points:
- The company achieved record net earnings of $286 million on record net sales of $6.6 billion in fiscal year 2005, up from $132 million in net earnings on $4.8 billion in net sales in fiscal year 2004.
- All of the company's business segments - Domestic Mills, Domestic Fabrication, Recycling, and Marketing & Distribution - experienced strong financial performance and profitability in 2005.
- The company continued its strategy of vertical integration and diversification which has helped it perform well in changing market conditions.
- For
This annual report summarizes Commercial Metals Company's financial performance in fiscal year 2006. Some key points:
- Record net earnings of $356 million on $7.6 billion in net sales, up from $286 million on $6.6 billion the prior year.
- All five business segments (domestic mills, CMCZ, domestic fabrication, recycling, and marketing/distribution) performed well due to favorable market conditions and the company's vertical integration strategy.
- Domestic mills set new records for sales, production, and shipments as metal spreads increased. The copper tube mill's operating profit increased significantly year-over-year.
This annual report summarizes Commercial Metals Company's financial performance in fiscal year 2006. Some key points:
- Record net earnings of $356 million on $7.6 billion in net sales, up from $286 million on $6.6 billion the prior year.
- All five business segments (domestic mills, CMCZ, domestic fabrication, recycling, and marketing/distribution) performed well due to favorable market conditions and the company's vertical integration strategy.
- Domestic mills set production and shipment records while benefiting from high metal spreads. CMCZ also improved significantly through organizational changes and new investments.
Commercial Metals Company reported record financial results for fiscal year 2006 with net sales of $7.6 billion, net earnings of $356 million, and diluted earnings per share of $2.89. All five of CMC's business segments performed well, with domestic steel mills, CMCZ (the Polish steel operation), and recycling being especially strong. Market conditions were favorable, especially for non-residential construction, and CMC executed well. The company also invested in new facilities, acquisitions, and branding initiatives. CMC has high confidence in its future due to the continued expected strength of its end markets and its vertically integrated business model.
Commercial Metals Company had a profitable year in 2007, approaching the record profits of 2006. The company made several strategic acquisitions, announced plans to build a new micro mill, and reorganized internally to take advantage of growth opportunities. All five of the company's business segments performed well. Safety remains a major focus.
How to Identify the Best Crypto to Buy Now in 2024.pdfKezex (KZX)
To identify the best crypto to buy in 2024, analyze market trends, assess the project's fundamentals, review the development team and community, monitor adoption rates, and evaluate risk tolerance. Stay updated with news, regulatory changes, and expert opinions to make informed decisions.
University of North Carolina at Charlotte degree offer diploma Transcripttscdzuip
办理美国UNCC毕业证书制作北卡大学夏洛特分校假文凭定制Q微168899991做UNCC留信网教留服认证海牙认证改UNCC成绩单GPA做UNCC假学位证假文凭高仿毕业证GRE代考如何申请北卡罗莱纳大学夏洛特分校University of North Carolina at Charlotte degree offer diploma Transcript
South Dakota State University degree offer diploma Transcriptynfqplhm
办理美国SDSU毕业证书制作南达科他州立大学假文凭定制Q微168899991做SDSU留信网教留服认证海牙认证改SDSU成绩单GPA做SDSU假学位证假文凭高仿毕业证GRE代考如何申请南达科他州立大学South Dakota State University degree offer diploma Transcript
An accounting information system (AIS) refers to tools and systems designed for the collection and display of accounting information so accountants and executives can make informed decisions.
In World Expo 2010 Shanghai – the most visited Expo in the World History
https://www.britannica.com/event/Expo-Shanghai-2010
China’s official organizer of the Expo, CCPIT (China Council for the Promotion of International Trade https://en.ccpit.org/) has chosen Dr. Alyce Su as the Cover Person with Cover Story, in the Expo’s official magazine distributed throughout the Expo, showcasing China’s New Generation of Leaders to the World.
Fabular Frames and the Four Ratio ProblemMajid Iqbal
Digital, interactive art showing the struggle of a society in providing for its present population while also saving planetary resources for future generations. Spread across several frames, the art is actually the rendering of real and speculative data. The stereographic projections change shape in response to prompts and provocations. Visitors interact with the model through speculative statements about how to increase savings across communities, regions, ecosystems and environments. Their fabulations combined with random noise, i.e. factors beyond control, have a dramatic effect on the societal transition. Things get better. Things get worse. The aim is to give visitors a new grasp and feel of the ongoing struggles in democracies around the world.
Stunning art in the small multiples format brings out the spatiotemporal nature of societal transitions, against backdrop issues such as energy, housing, waste, farmland and forest. In each frame we see hopeful and frightful interplays between spending and saving. Problems emerge when one of the two parts of the existential anaglyph rapidly shrinks like Arctic ice, as factors cross thresholds. Ecological wealth and intergenerational equity areFour at stake. Not enough spending could mean economic stress, social unrest and political conflict. Not enough saving and there will be climate breakdown and ‘bankruptcy’. So where does speculative design start and the gambling and betting end? Behind each fabular frame is a four ratio problem. Each ratio reflects the level of sacrifice and self-restraint a society is willing to accept, against promises of prosperity and freedom. Some values seem to stabilise a frame while others cause collapse. Get the ratios right and we can have it all. Get them wrong and things get more desperate.
KYC Compliance: A Cornerstone of Global Crypto Regulatory FrameworksAny kyc Account
This presentation explores the pivotal role of KYC compliance in shaping and enforcing global regulations within the dynamic landscape of cryptocurrencies. Dive into the intricate connection between KYC practices and the evolving legal frameworks governing the crypto industry.
Confirmation of Payee (CoP) is a vital security measure adopted by financial institutions and payment service providers. Its core purpose is to confirm that the recipient’s name matches the information provided by the sender during a banking transaction, ensuring that funds are transferred to the correct payment account.
Confirmation of Payee was built to tackle the increasing numbers of APP Fraud and in the landscape of UK banking, the spectre of APP fraud looms large. In 2022, over £1.2 billion was stolen by fraudsters through authorised and unauthorised fraud, equivalent to more than £2,300 every minute. This statistic emphasises the urgent need for robust security measures like CoP. While over £1.2 billion was stolen through fraud in 2022, there was an eight per cent reduction compared to 2021 which highlights the positive outcomes obtained from the implementation of Confirmation of Payee. The number of fraud cases across the UK also decreased by four per cent to nearly three million cases during the same period; latest statistics from UK Finance.
In essence, Confirmation of Payee plays a pivotal role in digital banking, guaranteeing the flawless execution of banking transactions. It stands as a guardian against fraud and misallocation, demonstrating the commitment of financial institutions to safeguard their clients’ assets. The next time you engage in a banking transaction, remember the invaluable role of CoP in ensuring the security of your financial interests.
For more details, you can visit https://technoxander.com.
Economic Risk Factor Update: June 2024 [SlideShare]Commonwealth
May’s reports showed signs of continued economic growth, said Sam Millette, director, fixed income, in his latest Economic Risk Factor Update.
For more market updates, subscribe to The Independent Market Observer at https://blog.commonwealth.com/independent-market-observer.
The Rise and Fall of Ponzi Schemes in America.pptxDiana Rose
Ponzi schemes, a notorious form of financial fraud, have plagued America’s investment landscape for decades. Named after Charles Ponzi, who orchestrated one of the most infamous schemes in the early 20th century, these fraudulent operations promise high returns with little or no risk, only to collapse and leave investors with significant losses. This article explores the nature of Ponzi schemes, notable cases in American history, their impact on victims, and measures to prevent falling prey to such scams.
Understanding Ponzi Schemes
A Ponzi scheme is an investment scam where returns are paid to earlier investors using the capital from newer investors, rather than from legitimate profit earned. The scheme relies on a constant influx of new investments to continue paying the promised returns. Eventually, when the flow of new money slows down or stops, the scheme collapses, leaving the majority of investors with substantial financial losses.
Historical Context: Charles Ponzi and His Legacy
Charles Ponzi is the namesake of this deceptive practice. In the 1920s, Ponzi promised investors in Boston a 50% return within 45 days or 100% return in 90 days through arbitrage of international reply coupons. Initially, he paid returns as promised, not from profits, but from the investments of new participants. When his scheme unraveled, it resulted in losses exceeding $20 million (equivalent to about $270 million today).
Notable American Ponzi Schemes
1. Bernie Madoff: Perhaps the most notorious Ponzi scheme in recent history, Bernie Madoff’s fraud involved $65 billion. Madoff, a well-respected figure in the financial industry, promised steady, high returns through a secretive investment strategy. His scheme lasted for decades before collapsing in 2008, devastating thousands of investors, including individuals, charities, and institutional clients.
2. Allen Stanford: Through his company, Stanford Financial Group, Allen Stanford orchestrated a $7 billion Ponzi scheme, luring investors with fraudulent certificates of deposit issued by his offshore bank. Stanford promised high returns and lavish lifestyle benefits to his investors, which ultimately led to a 110-year prison sentence for the financier in 2012.
3. Tom Petters: In a scheme that lasted more than a decade, Tom Petters ran a $3.65 billion Ponzi scheme, using his company, Petters Group Worldwide. He claimed to buy and sell consumer electronics, but in reality, he used new investments to pay off old debts and fund his extravagant lifestyle. Petters was convicted in 2009 and sentenced to 50 years in prison.
4. Eric Dalius and Saivian: Eric Dalius, a prominent figure behind Saivian, a cashback program promising high returns, is under scrutiny for allegedly orchestrating a Ponzi scheme. Saivian enticed investors with promises of up to 20% cash back on everyday purchases. However, investigations suggest that the returns were paid using new investments rather than legitimate profits. The collapse of Saivian l
2. Forward Looking Disclosure Statement
This presentation and other statements by the Company contain forward-looking statements within the
meaning of the Private Securities Litigation Reform Act with respect to, among other items: projections
and estimates of earnings, revenues, cost-savings, expenses, or other financial items; statements of
management’s plans, strategies and objectives for future operation, and management’s expectations as
to future performance and operations and the time by which objectives will be achieved; statements
concerning proposed new products and services; and statements regarding future economic, industry or
market conditions or performance. Forward-looking statements are typically identified by words or
phrases such as “believe,” “expect,” “anticipate,” “project,” and similar expressions. Forward-looking
statements speak only as of the date they are made, and the Company undertakes no obligation to
update or revise any forward-looking statement. If the Company does update any forward-looking
statement, no inference should be drawn that the Company will make additional updates with respect to
that statement or any other forward-looking statements.
Forward-looking statements are subject to a number of risks and uncertainties, and actual performance
or results could differ materially from that anticipated by these forward-looking statements. Factors that
may cause actual results to differ materially from those contemplated by these forward-looking
statements include, among others: (i) the Company’s success in implementing its financial and
operational initiatives, (ii) changes in domestic or international economic or business conditions,
including those affecting the rail industry (such as the impact of industry competition, conditions,
performance and consolidation); (iii) legislative or regulatory changes; (iv) the inherent business risks
associated with safety and security; and (v) the outcome of claims and litigation involving or affecting the
Company. Other important assumptions and factors that could cause actual results to differ materially
from those in the forward-looking statements are specified in the Company’s SEC reports, accessible on
the SEC’s website at www.sec.gov and the Company’s website at www.csx.com. 2
3. For 2006, our core strategies remain intact as
the foundation for delivering value
Shareholder Value Creation
Profitable Growth Margin Expansion
Revenue Operational Performance
Impact Discipline Culture
Core Strategies
3
4. Those strategies have improved the
company’s earning power significantly
Surface Transportation Operating Income in Billions
Rolling Twelve Months
$1.5
$1.4
$1.3
$1.2
$1.1
$1.0
$1.0
$0.9
Q1 2004 Q2 2004 Q3 2004 Q4 2004 Q1 2005 Q2 2005 Q3 2005 Q4 2005
Note: Excludes 2003 provision for casualty claims, and 2003 and 2004 management restructuring charge
4
5. The strong pricing environment and
contribution focus have improved yields
Revenue Per Unit
Year-Over-Year Improvement
11.1%
9.7% 9.3%
8.6%
7.8%
6.6%
2.4%
0.1%
Q1 2004 Q2 2004 Q3 2004 Q4 2004 Q1 2005 Q2 2005 Q3 2005 Q4 2005
Note: Second quarter 2005 excludes a benefit from a rate case settlement
5
6. Yields, productivity and an improving
culture have driven the operating ratio
Surface Transportation
Operating Ratio
89.3%
87.1%
85.5%
85.2%
83.3% 83.0%
81.3%
80.5%
Q1 2004 Q2 2004 Q3 2004 Q4 2004 Q1 2005 Q2 2005 Q3 2005 Q4 2005
Note: The first three quarters of 2004 exclude management restructuring charges
6
7. Going forward, CSX expects steady
double-digit growth through 2010
2006 – 2010 CAGR
Operating Income 10% – 12%
Earnings 12% – 14%
Free Cash Flow 10% – 12%
Operating Ratio Mid 70’s
Return on Invested Capital Meet or Exceed COC
7
8. Safety momentum remains strong
FRA Personal Injury FRA Train Accident
Rolling 12-Month Average Rolling 12-Month Average
Injuries / 200,000 Man Hours Accidents / MM Train Miles
1.16 3.42
Six Week Six Week
2.29
4.79
Average Average
4.72
2.13
2.04
4.43
1.91 4.32
1.71 1.65 3.99
3.78
Q4 Q1 Q2 Q3 Q4 1QTD Q4 Q1 Q2 Q3 Q4 1QTD
2004 2005 2005 2005 2005 2006 2004 2005 2005 2005 2005 2006
8
9. ONE Plan is gaining traction;
on-time performance is improving
On-Time Originations On-Time Arrivals
Rolling 12-Month Average Rolling 12-Month Average
43.0%
54.3%
40.9%
40.1%
51.1% 39.6%
50.3% 50.3% 38.9%
38.4%
49.0%
75% 62%
48.2%
Six Week Six Week
Average Average
Q4 Q1 Q2 Q3 Q4 1QTD Q4 Q1 Q2 Q3 Q4 1QTD
2004 2005 2005 2005 2005 2006 2004 2005 2005 2005 2005 2006
9
10. ONE Plan is gaining traction;
Dwell and cars-on-line are stable
Dwell Time (Hours) Cars-On-Line
Rolling 12-Month Average Rolling 12-Month Average
27.1 225K
Six Week Six Week
Average Average
234,132 233,876
29.7 29.7
29.6 29.4
29.3
28.7 232,172
234,165
233,271 233,118
Q4 Q1 Q2 Q3 Q4 1QTD Q4 Q1 Q2 Q3 Q4 1QTD
2004 2005 2005 2005 2005 2006 2004 2005 2005 2005 2005 2006
10
11. ONE Plan is gaining traction;
velocity to improve with Gulf restored
Velocity (mph) 20.1
Six Week
Rolling Twelve Months Average
20.3
19.9 19.8 19.7
19.3
19.2
Q4 2004 Q1 2005 Q2 2005 Q3 2005 Q4 2005 1QTD 2006
11
12. Competitor yields are accelerating,
implying continued opportunity
Year-Over-Year Growth in Revenue Per Unit
18%
16%
15%
13%
11%
11%
12%
9%
6%
3%
0%
CSX NSC BNI UNP
3Q 2004 4Q 2004 1Q 2005 2Q 2005 3Q 2005 Q4 2005
12
13. Volume growth will reflect continued
focus on higher margin traffic
2006 Volume Growth and Contribution
Intermodal Coal Merchandise Auto
Volume Growth Long-term Contribution
13
14. That focus drove a 63% increase in
intermodal operating income in 2005
2003-2005 Intermodal Profitability
Dollars in Millions
91.2%
$248
88.7%
$152
$110 81.8%
2003 2004 2005
Operating Income Operating Ratio
14
15. Intermodal volume growth will be
concentrated in key service lanes
• On-time performance provides
foundation for growth
Syracuse
Buffalo Boston
– Chicago-Florida 80%
Detroit
– Chicago-Northeast 90%
New York
Chicago Cleveland
Philadelphia
– Northeast-Florida 90%
Columbia Baltimore
Cincinnati
St Louis Evansville Portsmouth
• Key service lanes have train
Charlotte
capacity to handle growth
Nashville
Memphis
Atlanta
Charleston
• Trucking capacity is expected
Savannah
to remain tight
Mobile
Jacksonville
New Orleans
Tampa Intermodal Terminals
Miami
Priority Intermodal Corridors 15
16. Coal volume growth is expected
to remain strong
• Stockpiles remain low
Syracuse
• Utility demand remains strong
Buffalo Boston
New York
Chicago Cleveland
• Car utilization is improving
Philadelphia
Baltimore
• New plants being served
St Louis Portsmouth
• Western coal use to increase
Memphis
Charleston
Savannah
Jacksonville
New Orleans
Tampa Coal-fired Utilities
Coal Reserves
Miami
16
17. The strong economy is expected
to drive Merchandise growth
Merchandise Revenue • Manufacturing remains strong
$4.2 Billion
• Plastics production increasing
10%
26%
• Customer service is improving
13%
– Supports long-term growth
– Drives increased utilization
14% 12%
8%
17% Chemicals Emerging Markets Metals
Forest Products Phosphates & Fertilizers Agriculture Food & Consumer
17
18. Automotive volume growth will
be limited near-term
• Light vehicle production
expected to be flat
Syracuse
Buffalo Boston
• Traditional Big-3 expected to
Detroit
continue losing market share
New York
Chicago Cleveland
Philadelphia
Columbia Baltimore
Cincinnati
• Production at the CSX-served
St Louis Evansville Portsmouth
Hyundai plant is increasing
Charlotte
Nashville
Memphis
• Long-term strategy continues
Atlanta
Charleston
to focus on “new domestics”
Savannah
Jacksonville
New Orleans
Big-3 Assembly Plants
Tampa
“New Domestics” Assembly Plants
Miami Distribution Centers
18
19. Industrial development will
further drive long-term growth
Merchandise
Ethanol facilities
Feed mills
Syracuse
Buffalo Boston Aggregates facilities
Detroit
Plastics plants
New York
Chicago Cleveland
Philadelphia
Coal
Columbia Baltimore
New projects
St Louis Portsmouth
Intermodal
Nashville
Port developments
Memphis
Atlanta
Logistics centers
Charleston
Savannah
Automotive
Jacksonville
New Orleans
Assembly plant
Tampa
Supplier facility
Miami
19
20. To support growth, increased capital
expands capacity along key corridors
Surface Transportation 2006 Capital Spending
Capital Spending in Millions
53%
$1,420
$1,055
$960
15%
14% 18%
Infrastructure New Capacity
2004 2005* 2006* Locomotive Cars & Other
Note: 2005 and 2006 excludes capital spending relating to Katrina
20
21. The investment will leverage the rich
northeast and growing southeast markets
1994-2004 Income Growth
2004 Income
Chicago
Chicago
New York
New York
Jacksonville
Jacksonville
New Orleans
New Orleans
LT 5%
LT $50B Miami
Miami
5.0% – 5.5%
$51B – $150B
5.6% – 6.0%
$151 – $250B
GT 6.0%
GT $250B
21
Source: Bureau of Economic Analysis
22. Sixty projects are scheduled through 2007;
first twenty are already underway
Albany to
Albany
New York
Chicago New York
2 Locations
Terre Haute Terre Haute
To Nashville Nashville
10 Locations Waycross
Atlanta
To Atlanta
Waycross
8 Locations
New Orleans
22
Miami
23. Of the first twenty, eight are focused
between Atlanta and Waycross
Capacity Expansion Projects
Lily, GA
Atlanta, GA – Waycross, GA
Rock Spur, GA
Rock Spur, GA Upton, GA
Upton, GA Third Quarter 2006
Woodbury, GA
Woodbury, GA
Fourth Quarter 2006
Bartlett, GA
Ambrose, GA
Ambrose, GA Jacksonville
Haywood, GA
Haywood, GA
Waycross, GA
23
24. Another ten will be completed this year
between Terre Haute and Nashville
Capacity Expansion Projects
Terre Haute, IN – Nashville, TN
Chicago
Third Quarter 2006
Carlisle, IN
Carlisle, IN Smith, IN
Fourth Quarter 2006
Hazelton, IN
Hazelton, IN
Rankin, KY
Rankin, KY
Rankin, KY Casky,, KY
Casky
Staughters, KY
Staughters, KY
Cedar Hill, TN
Trenton, KY
Trenton, KY
Goodlettsville, TN
Goodlettsville, TN
24
25. In addition, two projects will be completed
between Albany and New York
Capacity Expansion Projects
Albany, NY – New York, NY
Third Quarter 2006
Fourth Quarter 2006
Albany
West Park, NY
Fort Montgomery, NY Newark / New York
25
26. Transportation demand is at record
levels, with further growth expected
Transportation Services Index Transportation Demand
Indexed: 2000=100 Indexed: 2000=100
120 125
110 115
100 105
90 95
80 85
70 75
60 65
2000 2002 2004 2006 2008 2010
1990 1993 1996 1999 2002 2005
Sources: Bureau of Transportation Statistics and Association of State Highway and Transportation Officials
26
27. More consumption is being sourced through
imports, extending the supply chain
U.S. Consumption U.S. Production and Imports
2000 Dollars in Trillions Indexed: 2000=100
$10 180
U.S. Imports
$9 160
U.S. Industrial Production
$8 140
$7 120
100
$6
80
$5
60
$4
2000 2002 2004 2006 2008 2010
2000 2002 2004 2006 2008 2010
Source: Global Insights
27
28. The competitive environment
supports the Rail Renaissance
Intercity Freight Revenue
• The trucking industry is faced
Dollars in Billions
with several challenges
$525
$450
– Congested highways
$375
– Labor shortages $300
– New hour of service laws $225
– Rising fuel costs $150
$75
$0
• Rail-truck partnerships bridge
'60 '70 '75 '80 '85 '90 '95 '00 '05
those challenges, creating value
Est
for both
Rail Truck
Source: Eno Transportation
28
29. Yet rail stocks continue to trade
at a discount to the S&P 500
Price-to-Earnings Ratios by Industry
23.1
Healthcare
19.4
Industrials
18.7
Transportation
17.9
S&P 500
17.4
Utilities
17.0
Telecom
15.9
Railroads
Note: Reflects closing January stock prices and LTM earnings per share
29
30. CSX’s price-to-earnings ratio
has room for improvement
Price-to-Earnings Ratios
18.4
16.9
16.7
15.3
15.2
14.4
CSX NSC CP CNI BNI UNP
Note: Reflects closing January stock prices and 2006 First Call earnings estimate
30
31. CSX’s commitment towards achieving its
targets will drive that improvement
Evolving Investment Thesis 2006-2010 Targets
• Operating ratio Commitment • Mid – 70’s
• Economic cycle Commitment • Grow through the cycle
• Cost of capital Commitment • Meet or exceed COC
• Long-term growth Commitment • Double-digit growth
31