Download to read offline
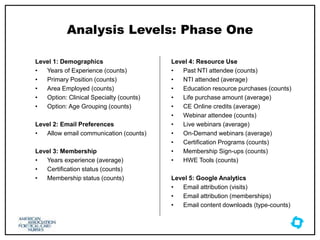
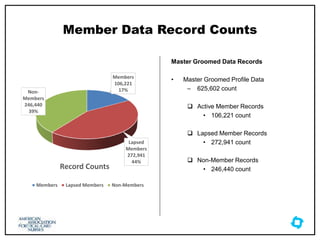
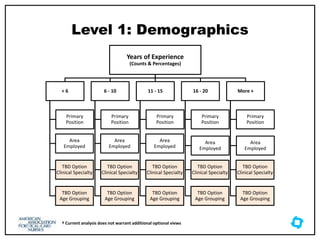
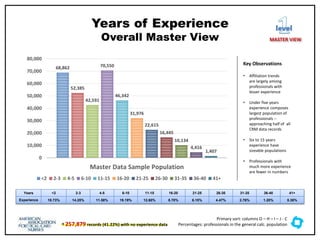
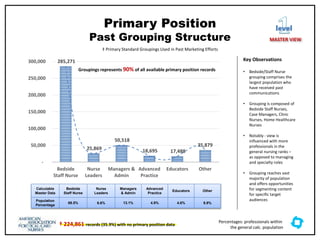
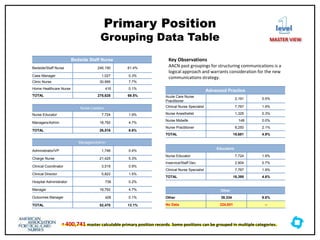
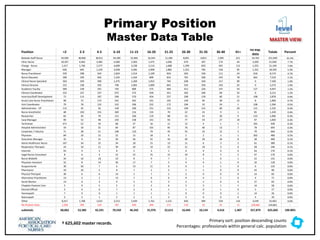
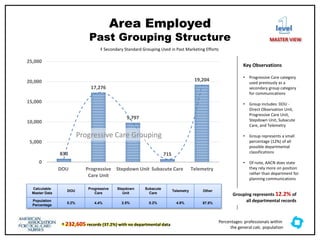
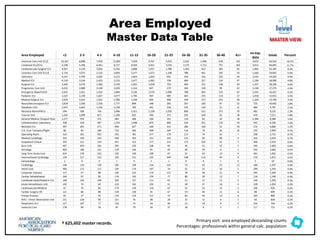
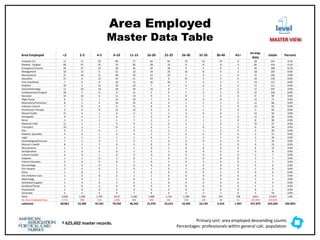

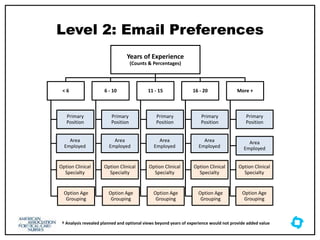
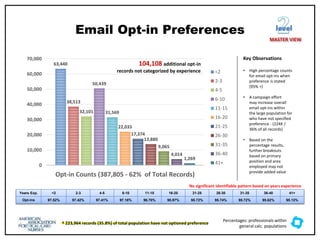
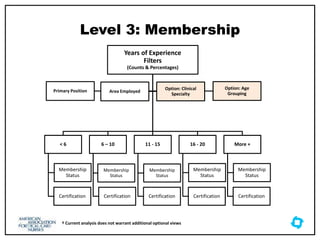
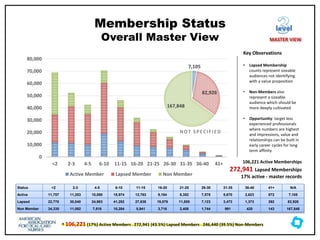
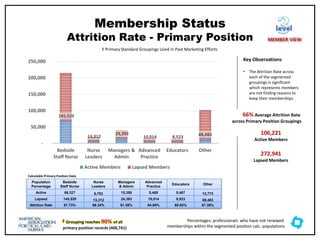
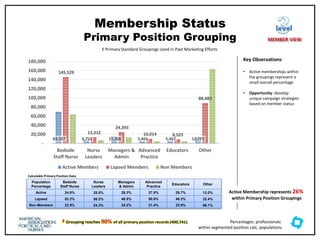
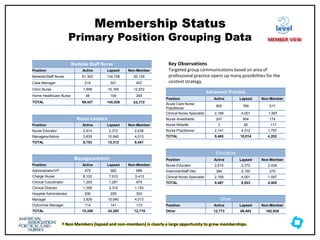
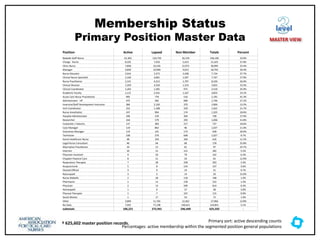

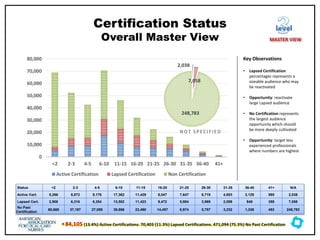
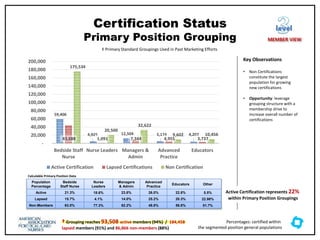
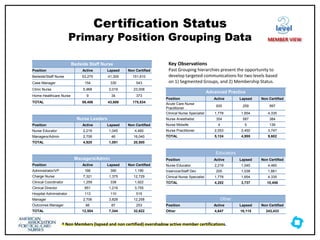
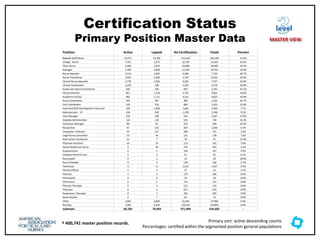
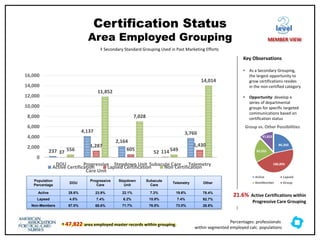
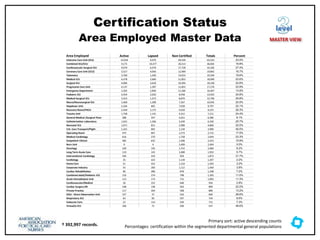
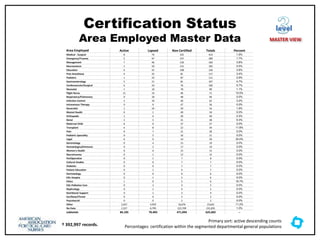

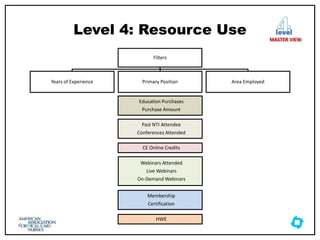

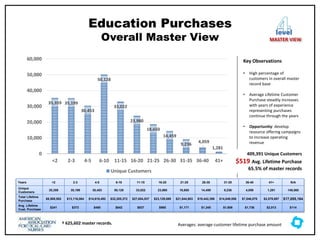
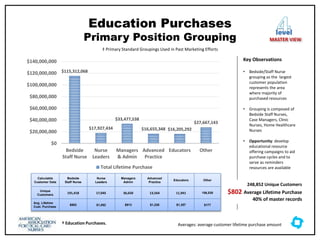
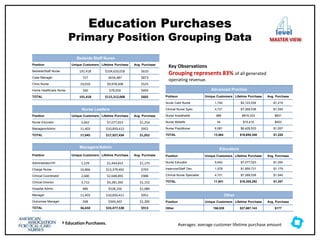
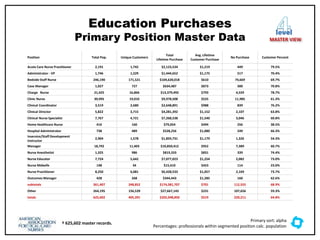
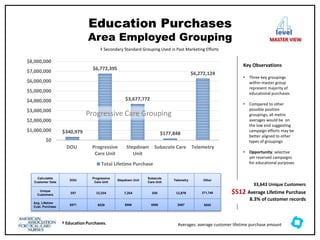
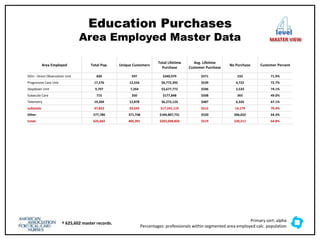

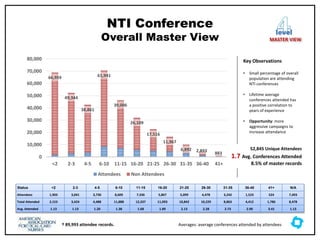
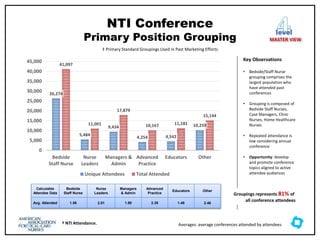
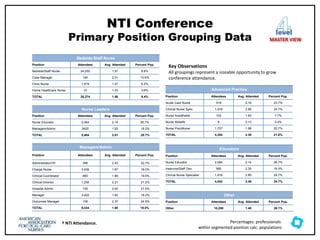
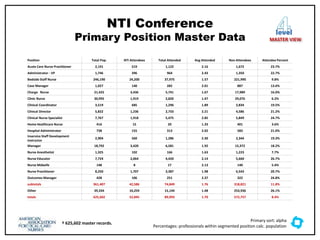
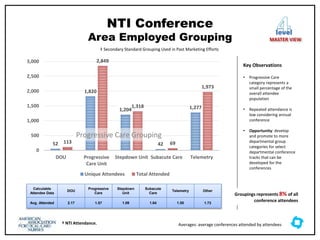
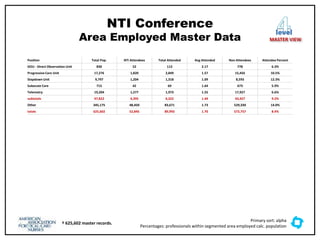

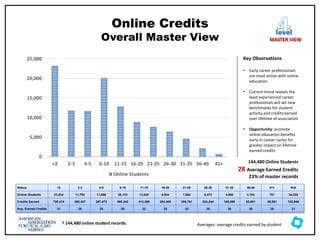
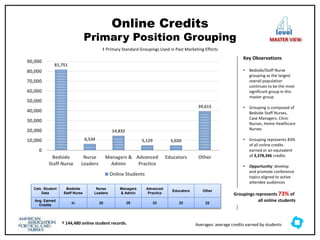
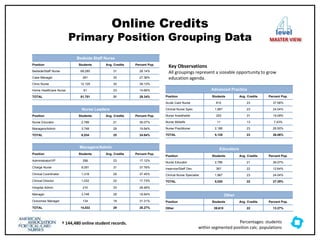
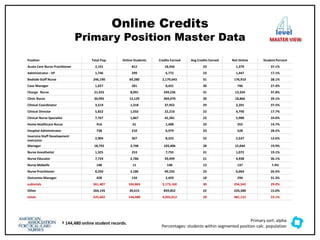
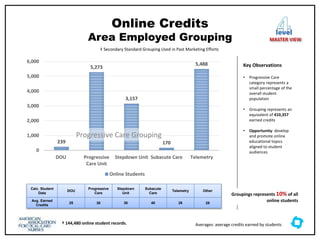


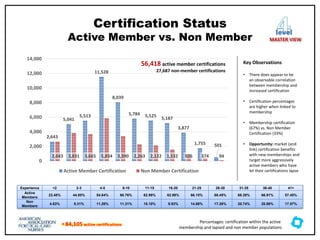

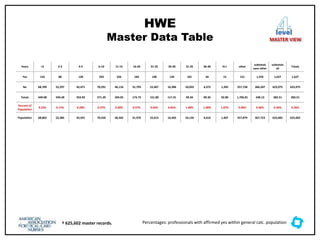

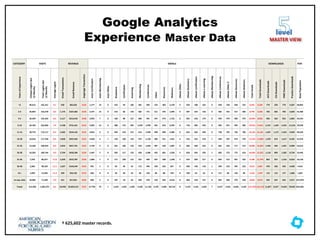
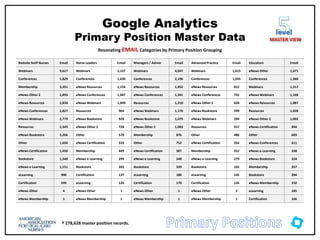
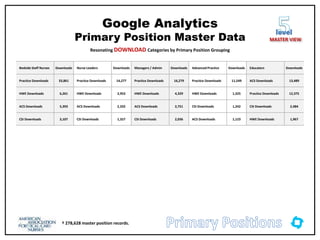
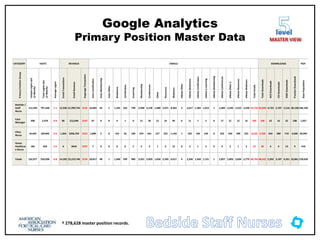
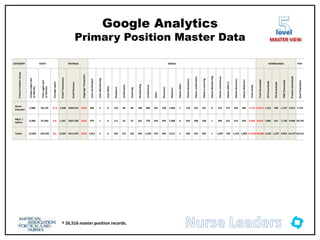
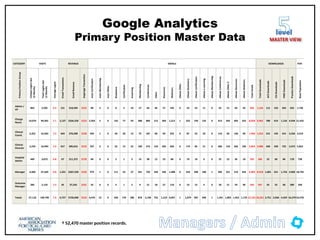
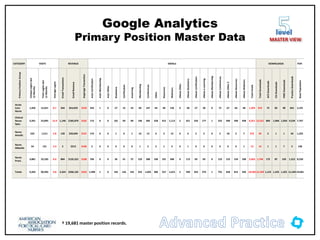
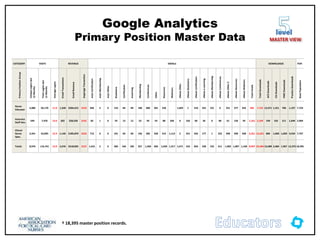
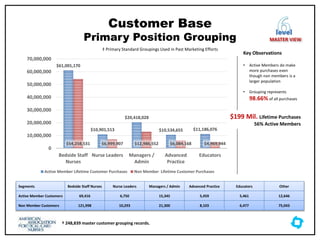
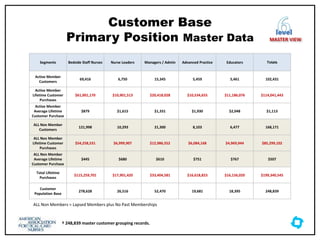
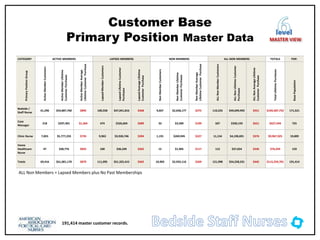
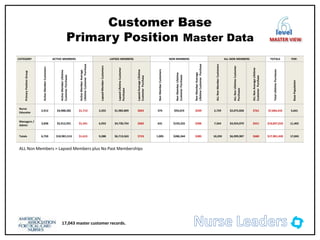
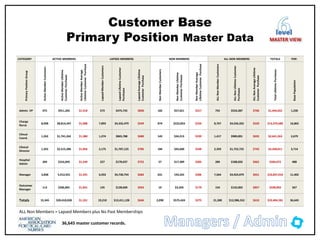
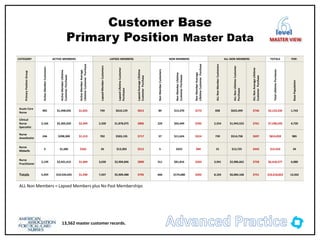
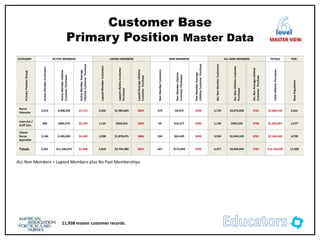

The document analyzes customer relationship management (CRM) data across multiple levels, including demographics, email preferences, membership status, and resource use. At the first level of demographics, it examines years of experience, primary position, area employed, and optional categories like clinical specialty and age grouping. It finds that the largest populations have less than 5 years of experience, are bedside/staff nurses, and lack departmental data. The analysis will help optimize communications strategies by segmenting content for specific target audiences based on the segmentation of the CRM data.