1. 8th
Global Conference of Actuaries
Written for and presented at 8th GCA, Mumbai 10-11 March, 2006
202
Critical Illness in India
By Sonjai Kumar
Abstract
This paper gives the first cut rate of Indian incidence of critical illness of cardiovascular,
Strokes and Cancer diseases. This paper also compares the critical illness rates currently
used in India, CIBT 93 with the rates calculated in this paper. The paper concludes that CIBT
93 should be modified before using in the Indian conditions.
Summary
1. In India Coronary Heart Disease (“CHD”) is more prevalent than cancer whereas in
UK the trend is reverse.
2. In the next ten years, CHD is expected to increase many folds in rural as well as in
Urban India. The range may vary from 13% to 80% at different ages. The major
increase is expected in the younger ages than older ages.
3. In India both males and females have higher incidence rates of CHD than
corresponding rates in UK.
4. In India females have higher heart attack rates than males, whereas in UK, the trend
is opposite.
5. The incidence rates of strokes in India are very low as compared to UK.
6. Both in India and UK the incidence rates of cancer of females are heavier than males
between the ages 20 to 60 years.
7. The cancer incidence rates in males and females in India are heavier up to age 60,
after that, UK rates become heavier.
8. According to this paper, one of the options available with the profession is either to
make some serious adjustments to CIBT 93 rates to make it useable in India or to
construct Indian specific critical illness rates
1. Introduction
The idea of writing this paper is to calculate critical illness rates of diseases such as
cardiovascular, strokes and cancer in the Indian conditions. The idea also extends to see
whether the CIBT 93 rates used in India are appropriate or not. The data used in this paper
are published data available on the public domain. Some efforts have been made to cross
check the data from other sources and found to be of consistent. This paper does throw light
on the deviation of incidence rates of CIBT 93 and calculated rates. The suggestion is to
have a re-look at CIBT 93 before using in the Indian conditions.
The section two deals in major causes of deaths in India. The section three deals in the
calculation of incidence rates of coronary heart disease in males and females in India. The
section four deals in the calculation of incidence rates of strokes and the section four deals in
the calculation of incidence rates of cancer in India
2. Major death causes in India
This section explains the most prominent causes of deaths in India. According to the World
Health Organization (“WHO”), chronic diseases are major cause of deaths in India
accounting for 53% among all deaths in 2005. The total deaths projected in 2005 were
10.362 million and 5.466 million were expected due to chronic diseases. According to WHO
sources, over 60 million people will die due to chronic diseases over next 10 years. The
following cart shows the spread of deaths due to various causes. It may be seen from the
chart below that cardiovascular disease accounts for around 28% of total deaths and cancer
accounts for 8%.
2. 8th
Global Conference of Actuaries
Written for and presented at 8th GCA, Mumbai 10-11 March, 2006
203
0%
5%
10%
15%
20%
25%
30%
35%
40%
Cause of death in India-2005
India
The chart below depicts the admitted claims in the UK insurance industry during the period
1991 to 1997. The cardiovascular disease accounts for 18% of claims whereas cancer
accounts for 54% of claims. This is contrast difference in the contracting diseases in two
countries.
0%
10%
20%
30%
40%
50%
60%
Carddio C a n c e r S t r o k e s C A B G K i d n e y F a i l Transplant T D P Other
UK admitted claims-1991-97
3. Cardiovascular disease
The medical term of heart attack is Myocardial infraction. A heart attack is also called
coronary attack and results from Coronary Heart Disease (“CHD”)- a disease of blood
vessels that feed the heart muscle when arteries are narrowed, less blood and oxygen
reaches the heart may lead to heart attack.
3.1 Projections of coronary heart disease in India
The expected shift in the incidence of CHD between 2000 and 2015 is captured in the
comparative charts below. It may be noted that the pattern remain same but there is a
upwards shift in the percentages.
3. 8th
Global Conference of Actuaries
Written for and presented at 8th GCA, Mumbai 10-11 March, 2006
204
3.2. Calculation of incidence rates of Coronary Heart Disease
In UK, Critical illness rates of cardiovascular disease in CIBT 93 were developed using
population data of 1993-94. The idea was to prepare the base table using population data
and then update the base table with more recent data in future.
India has adopted the same CIBT 93 critical illness rates without any adjustments for the
Indian conditions.
This section of the paper, calculates the incidence rate of Coronary Heart Disease (“CHD”)
per 10,000 in India using the data published in National Commission on Macroeconomic and
Health (NCMH) background papers, Burden of Disease in India, Ministry of Health & Family
Welfare, Government of India, New Delhi, September 2005.
The data used is of year 2000 and were published at the age interval of five years. The CHD
incidence rate at each age is calculated using linear interpolation method. The adoption of
linear interpolation in a short age bands such as five years is quite a standard practice.
The incidence rate of CHD is calculated separately for males and females.
In the CIBT 93 table, two adjustments were made as
• First ever heart attack and
• Sudden death adjustments
The first adjustment converts the multiple incidence rates into first ever heart attack rate and
second adjustment allows sudden deaths that go unreported. For the purpose of comparison
I have used these two adjustments from CIBT 93 rates. There are other adjustments also in
CIBT 93, such as prevalence rate adjustments which that I have not used.
4. 8th
Global Conference of Actuaries
Written for and presented at 8th GCA, Mumbai 10-11 March, 2006
205
3.3 Males
The graph below shows the comparative heart attack incidence rates in males in India and
UK.
Heart Attack(males) rates in India Vs UK
0.00
20.00
40.00
60.00
80.00
100.00
120.00
0 10 20 30 40 50 60 70 80
Age
Incidenceratesper10,000
Crude rates in India Crude rates in UK
It may be noted that the UK rates are smoother than in Indian rates, this is because linear
interpolation is used in the Indian rates and proper smoothing is not done.. I am not currently
worried about the smoothness of the rates but more interested in getting the trends. It may
further be noted overall heart attack rates in Male are higher in India than in UK. It is only
between 55-60 years; heart attack incidence rates in India are closer to UK rates.
The next graph captures the difference between the heart attack incidence rates in India and
UK
Incidence rates Males (India/UK)
-
50.00
100.00
150.00
200.00
250.00
300.00
350.00
1
5
9
13
17
21
25
29
33
37
41
45
49
Age
Ratio
Series1
The ratios are getting flat early in the ages because of wide differences in the ratio between
the two countries.
6. 8th
Global Conference of Actuaries
Written for and presented at 8th GCA, Mumbai 10-11 March, 2006
207
63 121.51 70% 17% 99.52 77.27 1.29
64 121.51 70% 17% 99.52 83.64 1.19
65 121.51 70% 18% 100.37 85.88 1.17
66 121.51 70% 18% 100.37 90.13 1.11
67 121.51 70% 18% 100.37 91.67 1.09
68 121.51 70% 18% 100.37 96.22 1.04
69 121.51 70% 18% 100.37 97.71 1.03
Conclusion: The incidence rates of heart attack in males in India are between two times to
three hundred times between the age ranges 55 decreasing to 20 years comparative to UK.
It is only after 55 years that the differences are around 3% to 15% with some stray higher
percentage differences at ages 60 & 61.
It is quite safe to conclude that the current incidence rates of heart attack in males used in
India through CIBT 93 are not appropriate in the present form and some modification is
required before it is used.
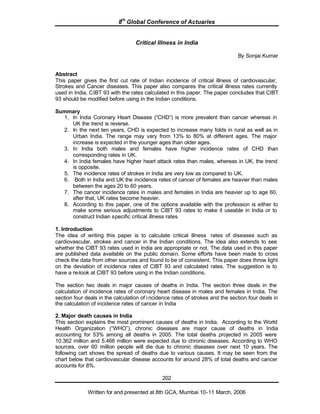
3.4 Females
The graph below shows the comparative heart attack incidence rates in females in India and
UK
Heart Attack Rate (Females) India vs UK
0
20
40
60
80
100
0 10 20 30 40 50 60 70 80
Age
Incidenceratesper
10,000lives
Crude rates in India Crude rates in UK
The female incidence rates in India are smoother than of male’s incidence rates, however,
there is a large gap between the incidences rates of females in India and UK.
The next graph captures the magnitude of difference between the heart attack rates among
in India and UK
7. 8th
Global Conference of Actuaries
Written for and presented at 8th GCA, Mumbai 10-11 March, 2006
208
Ratio( India/UK)
-
200
400
600
800
1,000
1,200
0 10 20 30 40 50 60 70 80
Age
Ratio
Ratio( India/UK)
The ratios are getting flat early in the ages because of wide differences in the ratio between
the two countries.
The table below giving the heart attack rates in females in India and in UK at each age.
Critical Illness Incidence rates- Coronary heart disease
Per 10,000
lives India
Age
Crude CHD
incidence
rates
First ever
adjustments
Sudden death
adjustments
Crude
rates in
India
Crude
rates in
UK
Ratio(
India/UK)
20 19.23 100% 15% 22.11 0.0000 -
21 20.38 100% 15% 23.44 0.0000 -
22 21.53 100% 15% 24.76 0.0700 353.74
23 22.68 100% 15% 26.09 0.0000 -
24 23.84 100% 15% 27.41 0.1000 274.11
25 24.99 100% 15% 28.74 0.0300 957.84
26 26.14 100% 15% 30.06 0.0600 500.99
27 27.29 100% 15% 31.38 0.1200 261.53
28 28.44 100% 15% 32.71 0.1200 272.57
29 29.59 100% 15% 34.03 0.1500 226.88
30 28.44 100% 15% 32.70 0.2100 155.72
31 29.89 100% 15% 34.37 0.4600 74.72
32 32.50 100% 15% 37.38 0.3800 98.36
33 35.11 100% 15% 40.38 0.6600 61.18
34 37.73 100% 15% 43.38 0.6000 72.31
35 40.34 100% 15% 46.39 0.9200 50.42
36 42.95 100% 15% 49.39 0.9200 53.69
37 45.56 99% 15% 51.87 0.9100 57.00
38 48.17 98% 15% 54.29 1.0700 50.74
39 50.78 96% 15% 56.07 1.4600 38.40
40 57.88 94% 15% 62.57 1.7100 36.59
41 67.52 92% 15% 71.43 1.5300 46.69
8. 8th
Global Conference of Actuaries
Written for and presented at 8th GCA, Mumbai 10-11 March, 2006
209
42 70.06 90% 15% 72.51 2.1400 33.88
43 72.60 88% 15% 73.47 2.3400 31.40
44 75.13 86% 15% 74.31 3.2900 22.59
45 77.67 84% 15% 75.03 2.4800 30.26
46 80.21 82% 15% 75.64 3.5000 21.61
47 82.75 80% 15% 76.13 4.7800 15.93
48 85.29 78% 15% 76.51 4.1500 18.44
49 87.83 76% 15% 76.76 5.8500 13.12
50 95.00 74% 15% 80.85 6.4700 12.50
51 103.08 72% 15% 85.35 6.3500 13.44
52 103.99 71% 15% 84.91 7.2000 11.79
53 104.90 70% 15% 84.44 8.8600 9.53
54 105.81 70% 15% 85.17 10.7200 7.95
55 106.71 70% 15% 85.90 12.7100 6.76
56 107.62 70% 15% 86.63 11.9300 7.26
57 108.53 70% 15% 87.37 14.8000 5.90
58 109.44 70% 15% 88.10 16.7400 5.26
59 109.89 70% 15% 88.46 19.9300 4.44
60 115.70 70% 15% 93.14 20.5300 4.54
61 115.70 70% 15% 93.14 23.0800 4.04
62 115.70 70% 15% 93.14 26.3700 3.53
63 115.70 70% 15% 93.14 26.1500 3.56
64 115.70 70% 15% 93.14 29.1500 3.20
65 115.70 70% 15% 93.14 35.2300 2.64
66 115.70 70% 15% 93.14 36.1300 2.58
67 115.70 70% 15% 93.14 38.3800 2.43
68 115.70 70% 15% 93.14 40.0600 2.32
69 115.70 70% 15% 93.14 43.2900 2.15
The female heart attack rates in India are much higher than UK. The range varies between
two times to five hundred times between different ages.
A comparative male and female heart attack rates in India is captured in the following graph
India : Males & females CHD incidence rates
0
20
40
60
80
100
120
0 10 20 30 40 50 60 70 80
Age
Incidencerates
Crude rates in India-M Crude rates in India-F
9. 8th
Global Conference of Actuaries
Written for and presented at 8th GCA, Mumbai 10-11 March, 2006
210
The female heart attack rates from age 20 to 32 is lower than males heart attack rates; from
age 32 to 60 female heart attack rates are much higher than male heart attack rates and then
from age 60+, female heart attack rates are lower.
The following chart shows the comparative figures of males and females CHD incidence
rates in UK.
UK, Males & females CHD incidence rates
(20)
0
20
40
60
80
100
120
0 20 40 60 80
Age
Ratesper10,000
Crude rates in UK-M Crude rates in UK-F
Conclusion
The incidence rates of CHD in females in India is heavier than male’s rate in the age range of
32 to 60 years, whereas in UK the trend is reverse, where female’s incidence rates of CHD is
quite a bit lighter than male rates for almost all the ages. This is one big contrast in the
incidence rates of CHD. If the product for CHD is priced in India, this fact should be taken
into account in the pricing and valuation exercise. There may be several reasons of reversal
of trend in India.
The risk factors such as smoking habits, blood cholesterol, high blood pressure, life style,
obesity, stress and diabetes-inducing CHD in India may be different than in UK. One of the
possible reasons of higher females heart attack over males in India as compared to UK could
attribute due to different level of obesity and diabetes.
4. Strokes
The WHO defines the strokes as rapidly developed clinical sign of focal disturbance of
cerebral function, lasting more than 24 hours or leading to death, with no apparent cause
other than vascular origin. The 24 hours threshold in the definition excludes transit ischaemic
attack.
10. 8th
Global Conference of Actuaries
Written for and presented at 8th GCA, Mumbai 10-11 March, 2006
211
The rate of strokes in India per 10,000 l ives is given in the following chart
3.02
27.19
84.73
0
10
20
30
40
50
60
70
80
90
Rates per
10,000
20-39 40-59 60-79
Age
Strokes per 10,000 in India (Year 2000)
A comparative rate of strokes per 10,000 lives in India vs UK is shown in the following graph.
Strokes incidence rate- UK vs India
0
20
40
60
80
100
120
140
0 10 20 30 40 50 60 70 80 90
Age
Incidencerates
Crude rates in India Crude rates in UK-M Crude rates in UK-F
It is quite evident that the incidence rates of strokes in India are much lower than in UK.
Therefore, if CIBT 93 is used to price a product for strokes in India, the actual experience
might be lighter than expected because of heavier assumption used in pricing through CIBT
93.
4.1 Calculation of incidence rates
The data used is of year 2000 and were published in NCMH at the age interval of 20 years.
The Stroke incidence rate at each age is calculated using linear interpolation method
between the 20-year age bands. This is done due to non-availability of data at each age. The
rates are available for age bands of 20 years, there is a every possibility of approximation
and the actual trend may not be linear in 20 years gap. However, for the sake of simplicity
11. 8th
Global Conference of Actuaries
Written for and presented at 8th GCA, Mumbai 10-11 March, 2006
212
linear interpolation is applied. Some attempt is made to cross check the prevalence rate (all
ages) of stroke from other sources and it was found to be consistent.
In the CIBT 93 table, two adjustments were made as
• First ever stroke and
• Sudden death adjustments
The first adjustment converts the multiple incidence rates into first ever stroke rate and
second adjustment allows sudden deaths that go unreported. For the purpose of comparison
I have used these two adjustments from CIBT 93 rates. There are other adjustments, such
as prevalence rate adjustments which that I have not used.
Critical Illness Incidence rates- Stroke Per 10,000 lives
Age
Crude
stroke
incidence
rates
First ever
adjustments
Sudden death
adjustments
Crude
rates in
India
Crude
rates in
UK-M
Crude
rates
in UK-
F
20 0.02 100% 5% 0.02 1.19 1.10
21 0.03 100% 5% 0.03 0.94 1.43
22 0.04 100% 5% 0.05 1.23 1.23
23 0.06 100% 5% 0.06 1.21 1.57
24 0.07 100% 5% 0.08 1.47 1.11
25 0.09 100% 5% 0.09 0.67 1.46
26 0.10 100% 5% 0.11 1.70 1.77
27 0.12 100% 5% 0.12 1.36 2.10
28 0.13 100% 5% 0.14 1.10 2.43
29 0.14 100% 5% 0.15 1.63 1.34
30 0.16 100% 5% 0.17 2.03 2.75
31 0.17 100% 5% 0.18 1.66 1.97
32 0.19 100% 5% 0.20 2.35 2.28
33 0.20 100% 5% 0.21 2.47 2.30
34 0.21 100% 5% 0.23 1.97 2.93
35 0.23 100% 5% 0.24 3.46 2.84
36 0.24 100% 5% 0.26 3.17 3.47
37 0.26 100% 5% 0.27 3.56 3.93
38 0.27 100% 5% 0.28 3.47 4.45
39 0.29 100% 5% 0.30 3.91 4.89
40 0.68 100% 5% 0.71 5.65 5.43
41 1.10 100% 5% 1.16 6.48 6.15
42 1.13 100% 5% 1.19 7.00 6.85
43 1.16 100% 5% 1.22 6.81 5.69
44 1.19 100% 5% 1.25 6.98 4.84
45 1.22 80% 5% 1.03 6.12 6.50
46 1.25 80% 5% 1.05 7.70 7.76
47 1.28 80% 5% 1.08 7.90 9.84
48 1.31 80% 5% 1.10 9.44 8.01
49 1.34 80% 5% 1.13 12.12 8.05
50 1.37 80% 5% 1.15 12.86 10.77
51 1.40 80% 5% 1.18 14.78 11.64
52 1.43 80% 5% 1.20 15.70 9.42
12. 8th
Global Conference of Actuaries
Written for and presented at 8th GCA, Mumbai 10-11 March, 2006
213
53 1.46 80% 5% 1.23 15.08 13.49
54 1.49 80% 5% 1.26 17.05 14.21
55 1.52 80% 5% 1.28 21.53 14.31
56 1.55 80% 5% 1.31 22.21 15.20
57 1.58 80% 5% 1.33 24.56 16.17
58 1.61 80% 5% 1.36 27.79 19.34
59 1.63 80% 5% 1.37 29.74 19.85
60 2.94 80% 5% 2.47 34.64 24.24
61 4.24 80% 5% 3.56 35.75 23.45
62 4.24 80% 5% 3.56 38.18 26.63
63 4.24 80% 5% 3.56 44.17 31.34
64 4.24 80% 5% 3.56 47.97 25.29
65 4.24 60% 5% 2.67 41.33 27.92
66 4.24 60% 5% 2.67 40.18 29.83
67 4.24 60% 5% 2.67 46.21 31.97
68 4.24 60% 5% 2.67 52.42 34.95
69 4.24 60% 5% 2.67 56.13 40.03
70 4.24 60% 5% 2.67 58.81 43.98
71 4.24 60% 5% 2.67 61.29 47.36
72 4.24 60% 5% 2.67 70.92 54.28
73 4.24 60% 5% 2.67 76.90 65.54
74 4.24 60% 5% 2.67 92.11 65.84
75 4.24 60% 5% 2.67 103.32 65.50
76 4.24 60% 5% 2.67 97.32 77.22
77 4.24 60% 5% 2.67 100.42 80.20
78 4.24 60% 5% 2.67 109.15 89.46
79 4.24 60% 5% 2.67 119.85 102.47
Conclusion
The incidence rate of Strokes in India is substantially lower as compared to UK (both males
and females) at all ages. This further leads us to believe that CIBT 93 requires major
modification to use in India.
5. Cancer
A cancer is defined as ‘A malignant tumour characterized by the uncontrolled growth and
spread of malignant cells and invasion of tissue.
13. 8th
Global Conference of Actuaries
Written for and presented at 8th GCA, Mumbai 10-11 March, 2006
214
Prominent male cancer sites in India
The following graph shows the most common sites of cancer in males in India from 1991 to
projected 2015.
0
10000
20000
30000
40000
50000
60000
Absolute
number of
cases
Oral cavity Lungs Pharynax Oseophagus Stomach
Common Cancer sites in Males (India)
Yr-1991
Yr-2004
Yr-2015
Prominent female cancer sites in India
The following graph shows the most common sites of cancer in males in India from 1991 to
projected 2015.
0
20000
40000
60000
80000
100000
120000
140000
Absolute
numver of
cases
Cervix Breast Ovary Ovary cavity Oseophagus
Common Cancer sites in Females (India)
Yr-1991
Yr-2004
Yr-2015
From the period of 2004 to 2015, there is around 23% of increase in cancer incidences cases
for both males and females.
Calculations of incidence rates
The data used to calculate the incidence rates is taken from the biennial report 1988-89of
National Cancer Registry Programme (Population based Cancer Registries). The Indian
Council of Medical Research, New Delhi, brings out this report. The cancer registry program
was conducted in seven centers in India, such as, Banglore, Mumbai, Chennai, Bhopal, Delhi
and one rural center of Barshi in Maharastra.
14. 8th
Global Conference of Actuaries
Written for and presented at 8th GCA, Mumbai 10-11 March, 2006
215
The following data is used to calculate the cancer incidence rates. Clubbing together the
cases of seven registry centers arrives at this all India data.
Cancer incidence cases India 1989
India -
1989 Population Cancer cases
Incidence rates
per 100,000
Age Males Females Male Female Male Female
0-4 1462803 1431054 166 104 11.35 7.27
5-9 1576328 1512862 147 85 9.33 5.62
10-14 1509104 1402500 151 90 10.01 6.42
15-19 1451133 1242781 206 135 14.20 10.86
20-24 1642658 1337563 235 203 14.31 15.18
25-29 1455475 1188200 270 289 18.55 24.32
30-34 1145161 873228 322 456 28.12 52.22
35-39 982333 766287 446 747 45.40 97.48
40-44 824441 576875 643 985 77.99 170.75
45-49 668278 500796 884 1283 132.28 256.19
50-54 525739 389557 1268 1331 241.18 341.67
55-59 347633 257590 1254 1090 360.73 423.15
60-64 275862 244071 1361 1163 493.36 476.50
65-69 148998 143354 1060 703 711.42 490.39
70-74 110581 110167 733 494 662.86 448.41
75+ 105114 115100 762 505 724.93 438.75
Total 1423164112091985 9908 9663 69.62 79.91
Cancer Incidence rates in India
-
20
40
60
80
100
120
140
160
0 20 40 60 80 100
Ages
Ratesper100,000
Males
Females
It may be seen that the cancer female incidence rates are lower than male rates up to age
20; from age 20 to 60, female cancer incidence rates are higher and then from age 60
onwards-female cancer incidence rates drops.
A Cancer incidence rate in UK is shown in the following graph.
15. 8th
Global Conference of Actuaries
Written for and presented at 8th GCA, Mumbai 10-11 March, 2006
216
Cancer incidence ratesin UK
0
50
100
150
200
250
300
350
0 20 40 60 80 100
Ages
Ratesper100,000 UK males
UK females
The shape of the graph of UK is similar to the shape in India. From age 20 to 60 female
cancer incidence rates are higher and after age 60 the female rates are lower. As far as
CIBT 93 tables is concerned, it is a good sign that the shape of curves of cancer incidences
in India and UK are similar. The only point of interest is to compare incidence rates in two
countries.
Cancer Incidence rates in India & UK
-
50.00
100.00
150.00
200.00
250.00
300.00
350.00
0 20 40 60 80 100
Ages
Rtaesper100,000
India Males
India Females
UK males
UK females
From age 19 to 58 years, Cancer incidence rates in India among males are higher than
males in UK; and from 59 onwards, the cancer incidence rates in India are lower except at
age 65. This means that on using CIBT 93 rates for pricing cancer products in India will have
lower premium than it should have been. Similarly, female cancer products will also be under
priced if CIBT 93 rates are used. One of the consequences of using CIBT 93 rates is to more
than expected claims on the cancer portfolio of critical illness.
The incidence rates of cancer in India are given in the following table.
17. 8th
Global Conference of Actuaries
Written for and presented at 8th GCA, Mumbai 10-11 March, 2006
218
65 146.28 101.56 141.85 103.04
66 144.28 99.82 153.63 106.09
67 142.28 98.08 165.99 110.91
68 140.29 96.34 178.35 115.74
69 138.29 94.60 190.71 120.56
70 127.79 90.46 203.71 125.38
71 130.18 90.07 215.42 130.2
72 132.57 89.68 228.3 134.53
73 134.97 89.29 241.18 138.86
74 137.36 88.90 254.06 143.18
75 144.99 87.75 266.94 147.51
76 144.99 87.75 279.82 151.84
77 144.99 87.75 293.55 156.77
78 144.99 87.75 307.27 161.69
Regional cancer incidence rates
The following couple of graphs explain the cancer incidence rates in the seven centers in
India as compared to CIBT 93 rates.
18. 8th
Global Conference of Actuaries
Written for and presented at 8th GCA, Mumbai 10-11 March, 2006
219
References
1. National Commission on Macroeconomic and Health (NCMH) background papers,
Burden of Disease in India, Ministry of Health & Family Welfare, Government of India,
New Delhi, September 2005.
2. Biennial report 1988-89of National Cancer Registry Programme (Population based
Cancer Registries).
3. A critical review: Report of the critical illness healthcare study group, presented to
The Staple Inn Actuarial Society, March 2000.
19. 8th
Global Conference of Actuaries
Written for and presented at 8th GCA, Mumbai 10-11 March, 2006
220
About the Author:
Sonjai Kumar
Sonjai is currently working with Max New York Life for around 10 months and involved in the
pricing and internal reporting process. He was earlier with Sahara India Life Insurance
Company Ltd for around a year where he was involved in pricing and valuation exercise.
Before joining Sahara, Sonjai worked with Watson Wyatt Insurance consulting for around
three and a half year. He has also served Life Insurance Corporation of India for over little six
years.
Sonjai has done Postgraduate diploma in Actuarial Management from City University, UK
and also hold a masters degree in Mathematics.