1. Static and Dynamic Magnetization Measurements of Synthetic Antiferromagnets
Cristina Azuara1,3
, Daniel Adams1,2
, Pratik Poudyal1,2
, Leonard Spinu1,2
1
Advanced Materials Research Institute, University of New Orleans, New Orleans, LA 70148
2
Department of Physics, University of New Orleans, New Orleans, LA 70148
3
California State University of Long Beach, Los Angeles, CA 90815
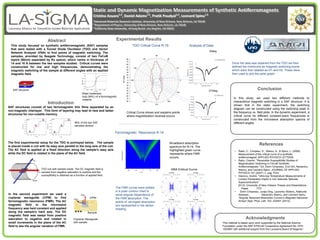
210deg
Experimental Results
References
Acknowledgments
(C)
Conclusion
Once the data was obtained from the TDO we then
defined the minimums as magnetic switching points
which were then labeled as H1 and H2. These were
then used to plot the polar graph
TDO Critical Curve R-16 Analysis of Data
30deg
Ferromagnetic Resonance R-14 °
Critical Curve shows and explains points
where magnetization reversal occurs
This material is based upon work supported by the National Science
Foundation under the NSF EPSCoR Cooperative Agreement No. EPS-
1003897 with additional support from the Louisiana Board of Regents.“
• Radu, C., Cimpesu, D., Stancu, A., & Spinu, L. (2008).
Measurement of the critical curve of a synthetic
antiferromagnet. APPLIED PHYSICS LETTERS.
• Radu, Cosmin. "Reversible Susceptibility Studies of
Magnetization Switching in FeCoB Synthetic
Antiferromagnets." Ed. Dorin Cimpoesu, Erol Girt, Alexandru
Stancu, and Leonard Spinu. JOURNAL OF APPLIED
PHYSICS 101 (2007): n. pag. Print.
• Diaconu, Andrei, "Ultra-low Temperature Measurements of
London Penetration Depth in Iron Selenide Telluride
Superconductors"
2013). University of New Orleans Theses and Dissertations.
Paper 1731.
• Dorin Cimpoesu, Junjia Ding, Laurentiu Stoleriu, Adekunle
Adeyeye, Alexandru Stancu, and Leonard Spinu.
"Angular Resonant Absorption Curves in Magnetic Nanowire
Arrays" Appl. Phys. Lett. 102, 232401 (2013);
Introduction
SAF structures consist of two ferromagnetic thin films separated by an
non-magnetic interlayer. This form of layering may lead to new and better
structures for non-volatile memory.
The first experimental setup for the TDO is portrayed below. The sample
is placed inside a coil with its easy axis parallel to the long axis of the coil.
The AC field is applied at a fixed direction along the sample’s easy axis
while the DC field is rotated in the plane of the AC field.
This study focused on synthetic antiferromagnetic (SAF) samples
that were tested with a Tunnel Diode Oscillator (TDO) and Vector
Network Analyzer (VNA) to find points of magnetic switching. The
samples, provided by Seagate Technology, consist of two FeCoB
layers (80nm) separated by Ru spacer, which varies in thickness of
14 and 16 Å between the two samples studied. Critical curves were
constructed for low and high frequencies, demonstrating the
magnetic switching of the sample at different angles with an applied
magnetic field.
SAF structure
Abstract
TDO coil with sample inside. The DC magnetic field is
ramped from negative saturation to positive and the
susceptibility is obtained as a function of applied field.
Major hysteresis
loop (MHL) of a ferromagnetic
material
In this study, we used two different methods to
characterize magnetic switching in a SAF structure. It is
shown that in the static experiment, the switching
diagram can be constructed using the switching peak in
the frequency vs. field plots. In the dynamic experiment, a
critical curve for different constant-wave frequencies is
constructed from the microwave absorption spectra of
different angles.
In the second experiment we used a
coplanar waveguide (CPW) to find
ferromagnetic resonance (FMR). The AC
magnetic field in the microwave
frequency was held constant and applied
along the sample’s hard axis. The DC
magnetic field was swept from positive
saturation to negative and rotated in
small increments in the plane of the AC
field to see the angular variation of FMR.
-60 -40 -20 0 20 40 60
-0.0015
-0.0010
-0.0005
0.0000
0.0005
0.0010
0.0015
Moment(emu)
H (Oe)
R-14
-60 -40 -20 0 20 40 60
-0.0010
-0.0005
0.0000
0.0005
0.0010
Moment(emu)
Field (Oe)
R-16
MHL of the two SAF
samples studied
H (Oe)
Coplanar Waveguide
with sample
VNA Critical Curve
Broadband absorption
spectrum for R-14. The
highlighted green curve
represents where FMR
occurs.
H (Oe) H (Oe)
H (Oe) H (Oe)
-200 -100 0 100 200
2
3
4
5
H (Oe)
Frequency(GHz)
The FMR curves were plotted
in a polar contour chart to
show angular dependence of
the FMR absorption. The
points of strongest absorption
are represented in the darker
shading.