Downloaded 103 times
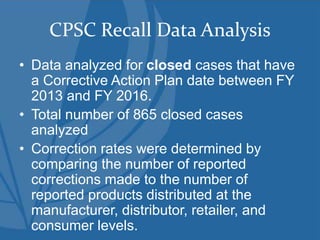

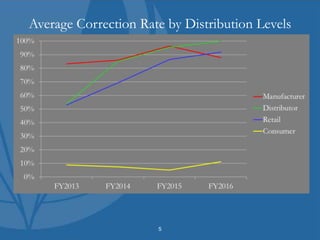
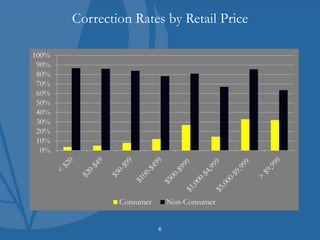
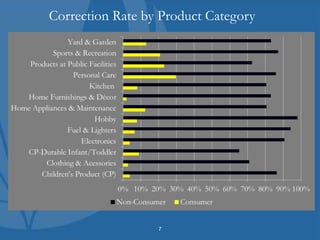
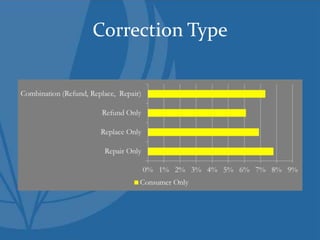
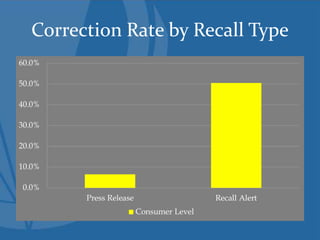
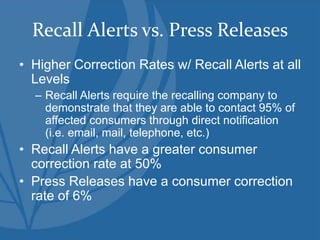
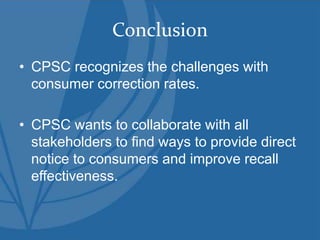

The CPSC analyzed 865 closed recall cases from FY 2013 to FY 2016, revealing an overall correction rate of 65%. Higher correction rates were linked to recall alerts, which effectively notify 95% of affected consumers, compared to lower rates for press releases. The CPSC acknowledges the difficulties in achieving consumer corrections and seeks collaborative efforts to enhance recall effectiveness.


