- The COVID-19 pandemic disrupted both school bullying and cyberbullying according to an analysis of Google search data.
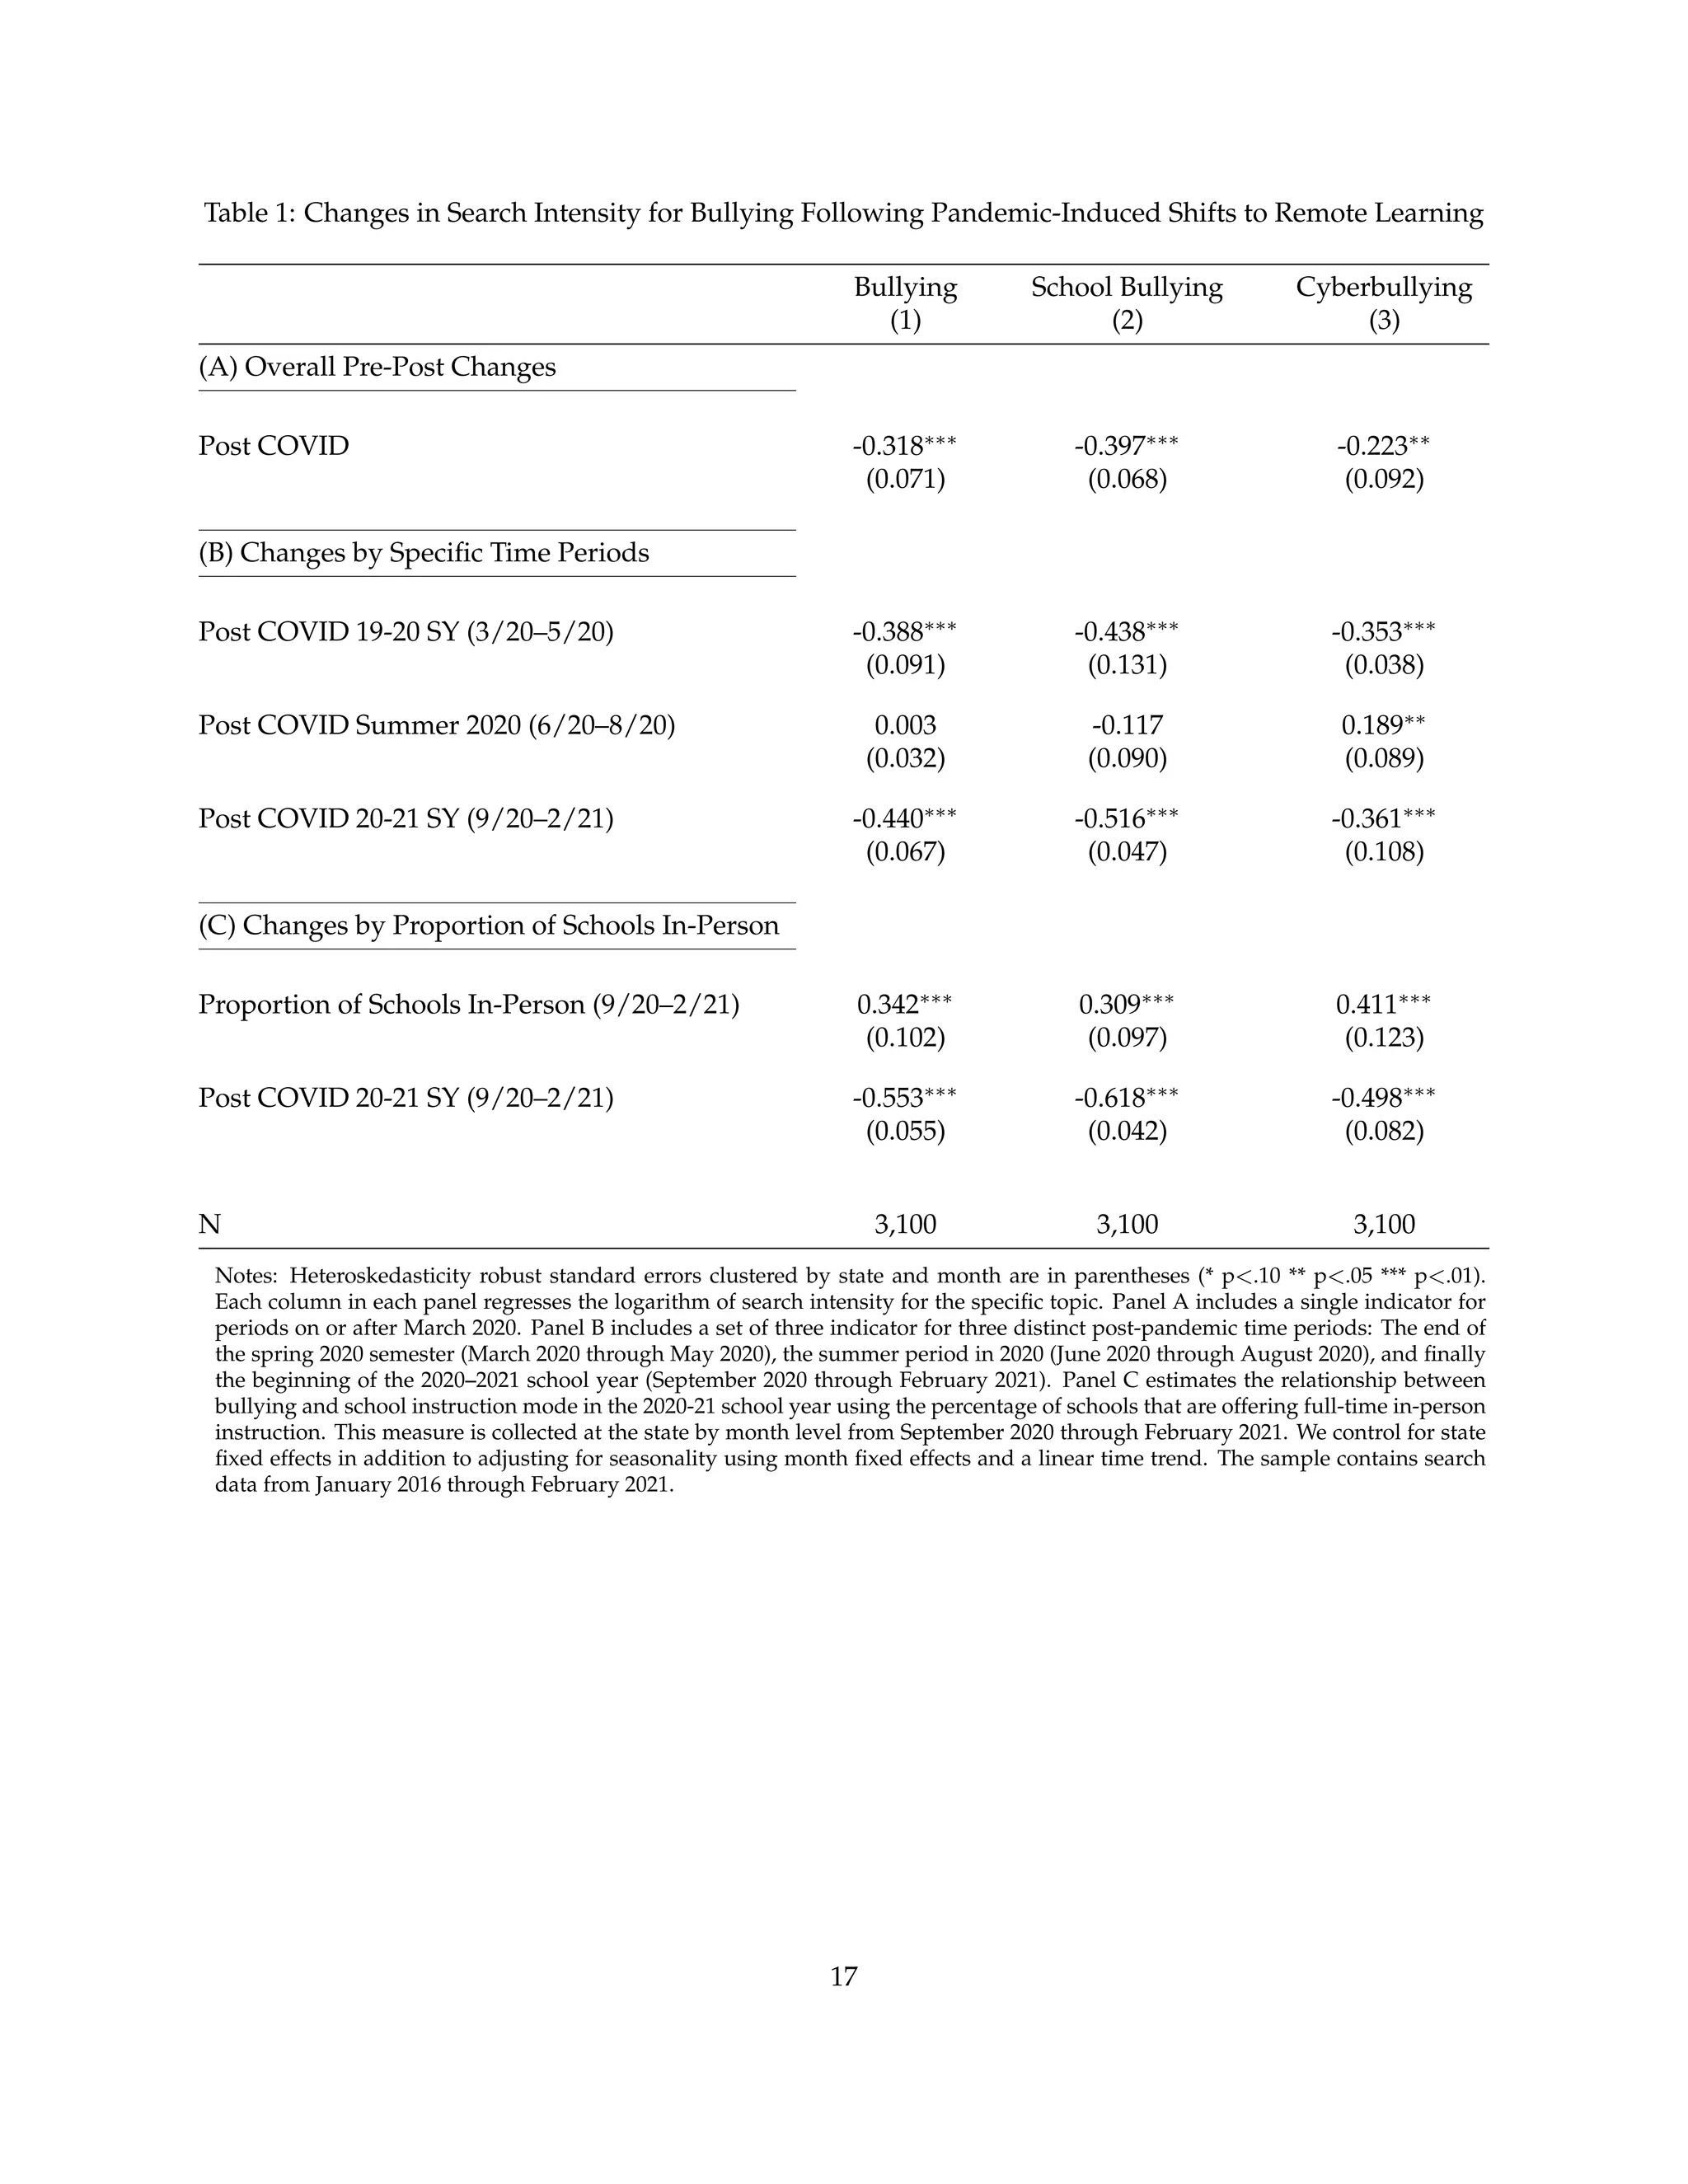
- When schools shifted to remote learning in spring 2020, searches for "school bullying" and "cyberbullying" both dropped around 30-40%.
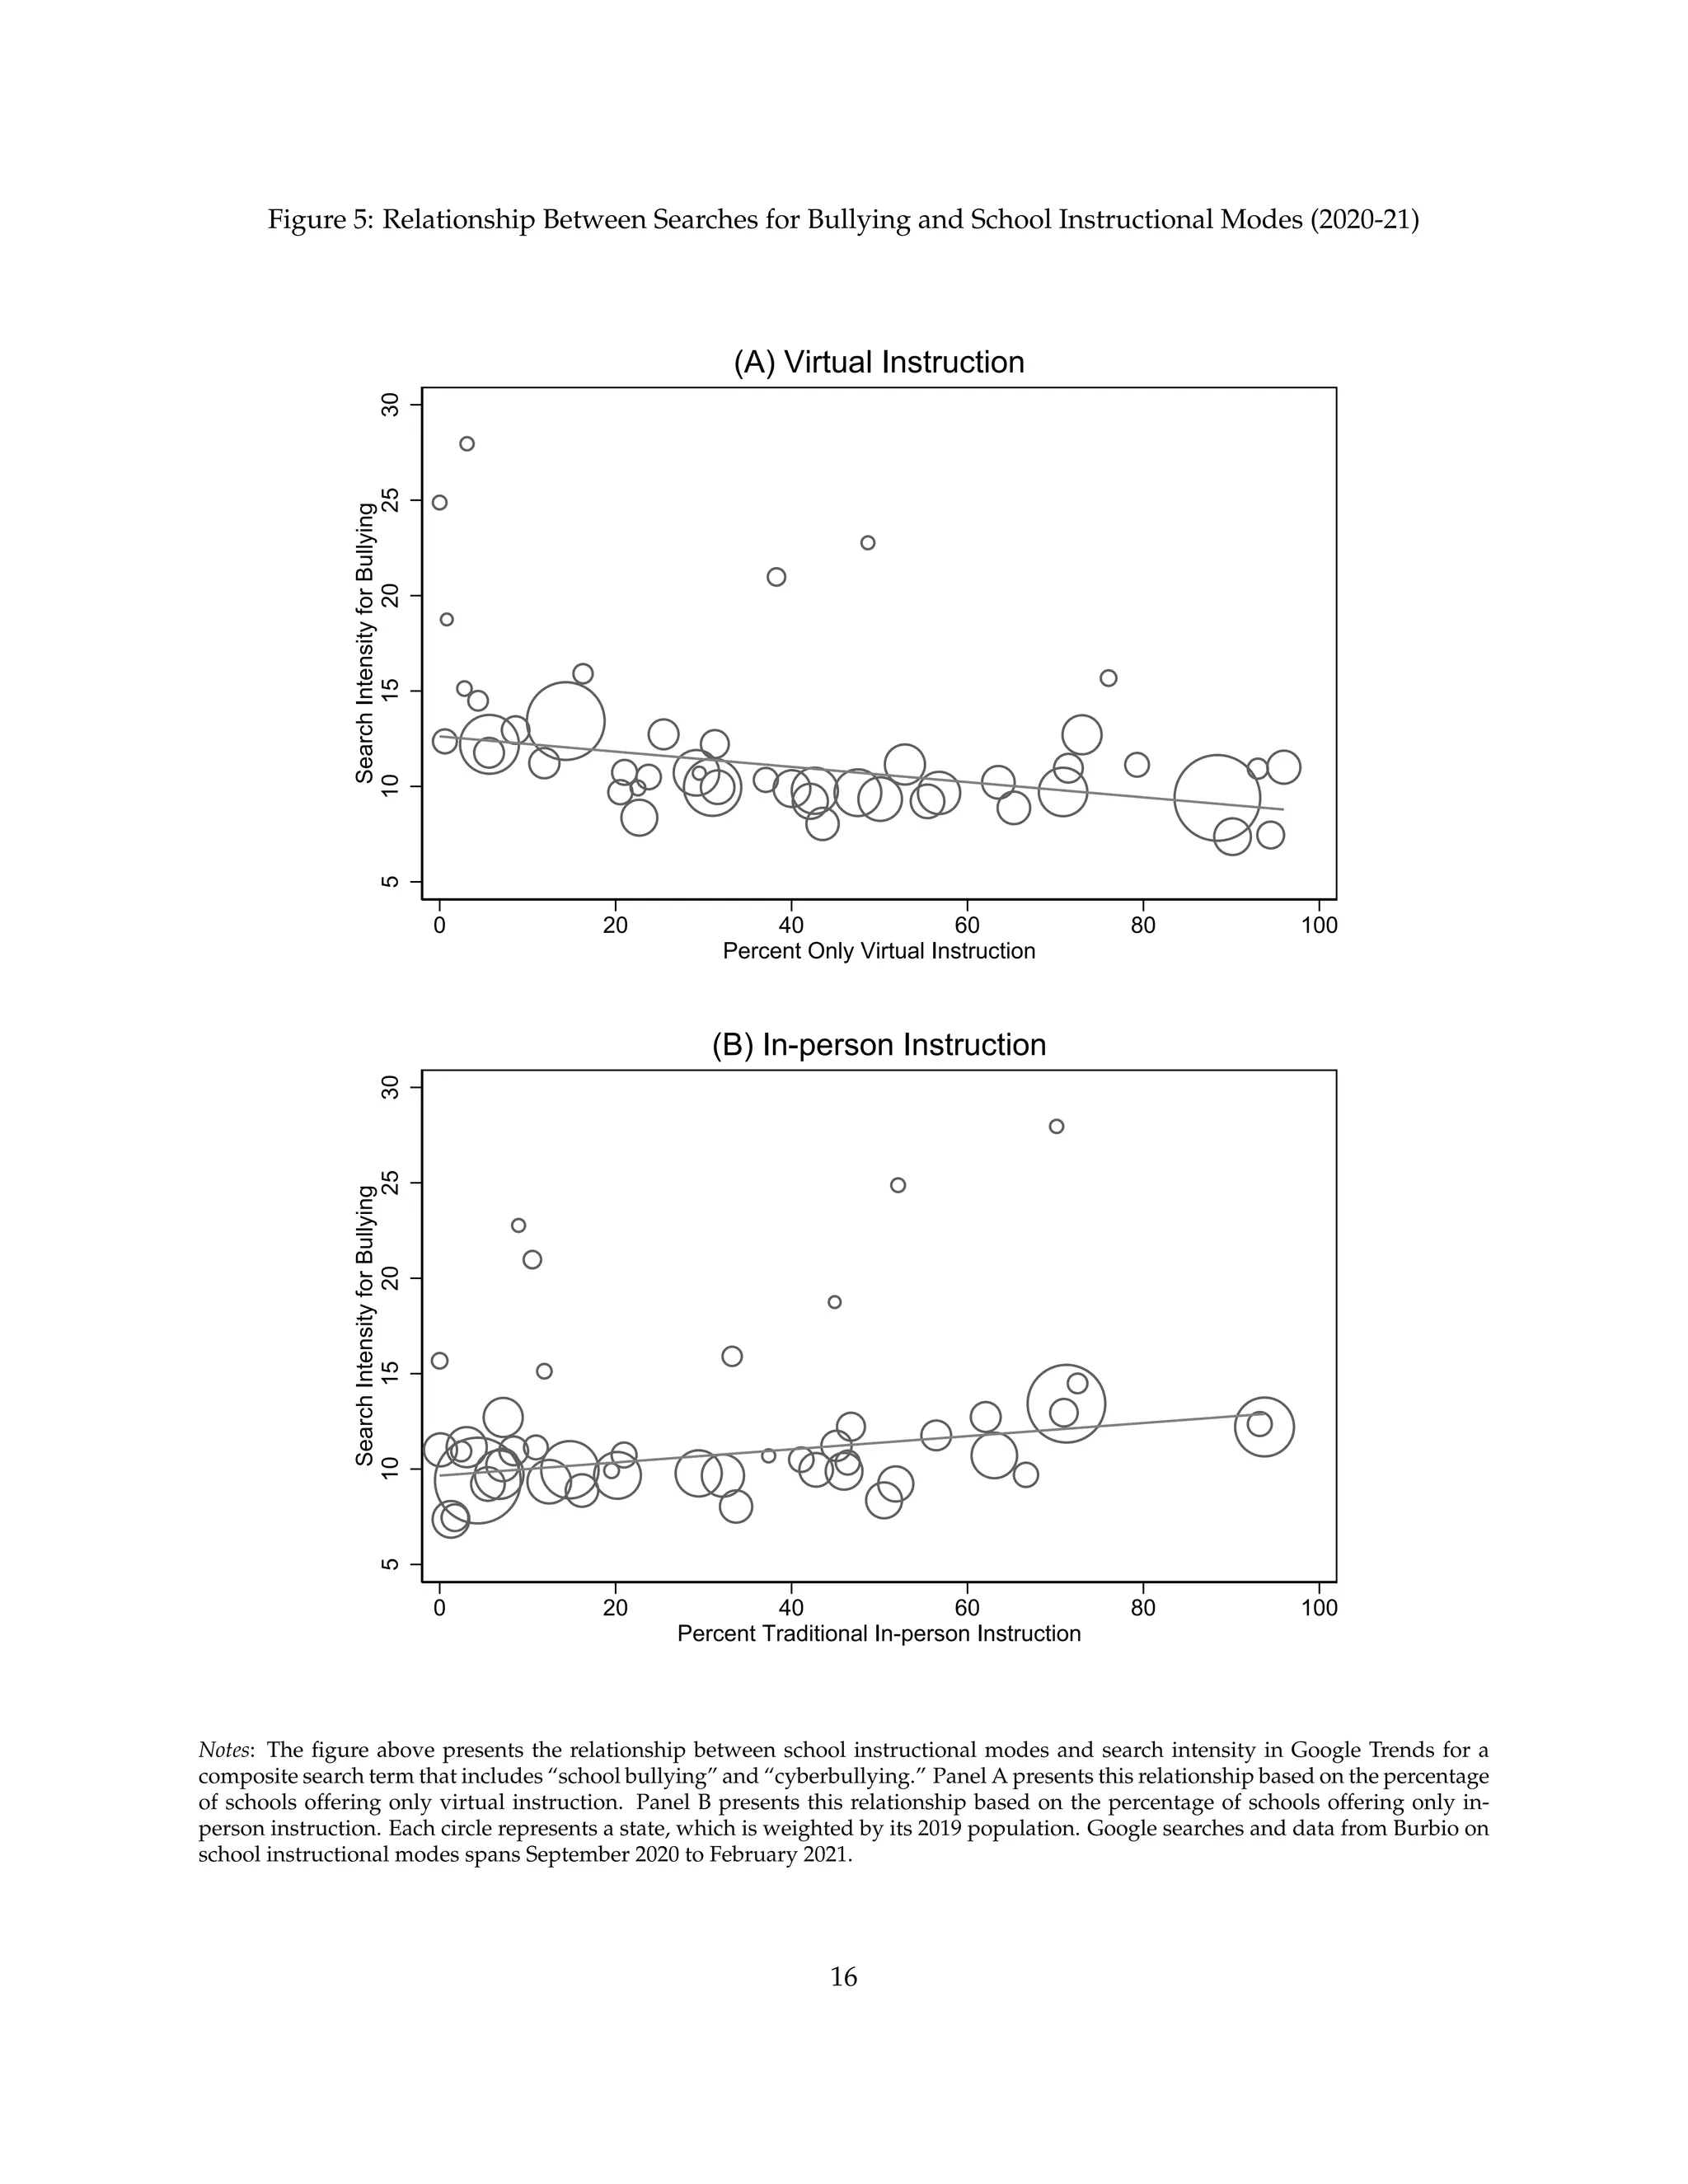
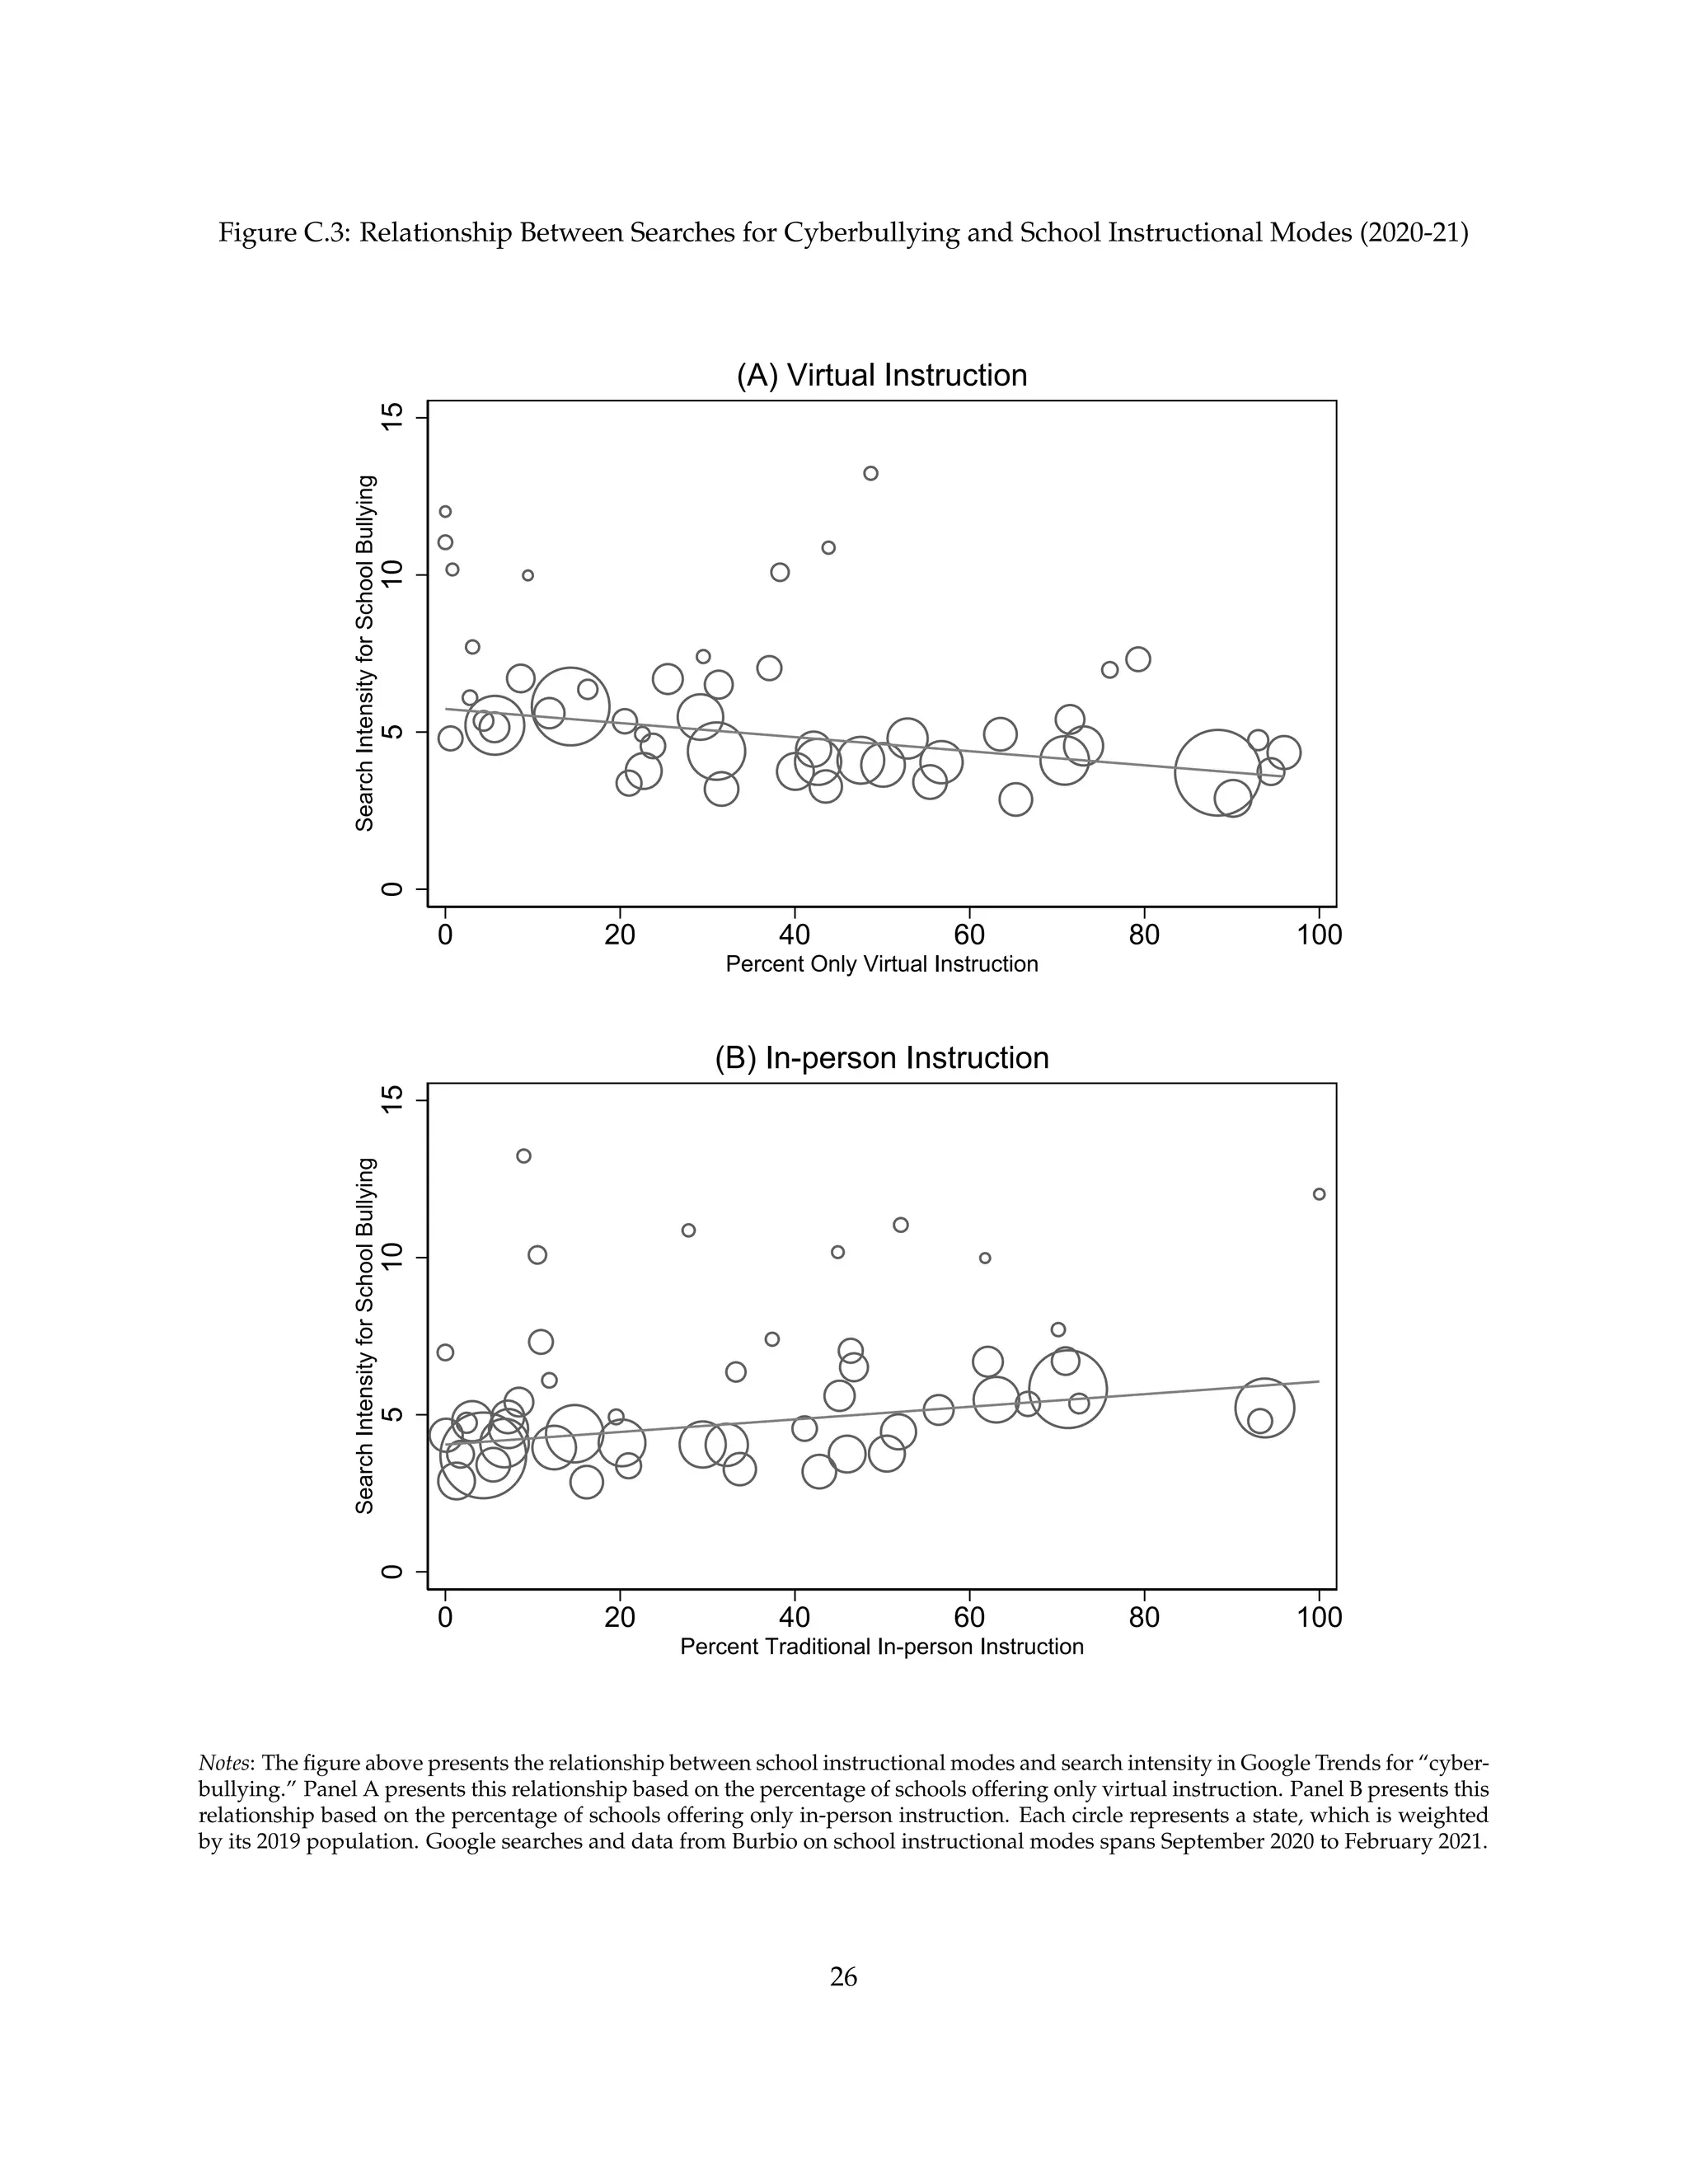
- This drop was sustained through the 2020-2021 school year, though a gradual return to in-person instruction partially returned bullying search levels to pre-pandemic norms.
A Parent and Teacher Training Program for Cyberbullying Detection and Interve...Andy Jeter
A Parent and Teacher Training Program for Cyberbullying Detection and Intervention is a presentation of Andy Jeter's action research proposal for his Master's program.
A Parent and Teacher Training Program for Cyberbullying Detection and Interve...Andy Jeter
A Parent and Teacher Training Program for Cyberbullying Detection and Intervention is a presentation of Andy Jeter's action research proposal for his Master's program.
Social Media Use and Adolescent Mental Health: Findings From the UK Millenniu...eraser Juan José Calderón
Social Media Use and Adolescent Mental Health: Findings From the UK Millennium Cohort Study de Yvonne Kelly, Afshin Zilanawala, Cara Booker, Amanda Sacker publicado en eClinicalMedicine
Published: January 04, 2019 DOI:https://doi.org/10.1016/j.eclinm.2018.12.005
Hello! Look at this great dissertation literature review sample. To get more samples visit https://www.litreview.net/our-literature-review-writing-service/order-your-dissertation-literature-review/
April 2013 - UNICEF Social and Civic Media Section, DOC, NYHQ / Regional Office for Central and Eastern Europe and the Commonwealth of Independent States
The first part of this paper describes how anti-vaccination groups
communicate and how social networks connect concerned parents
in new ways. The second part emphasizes the role of social media
monitoring in strategic communication, based on understanding
audience needs.
02 August 2013Page of 1 ProQuest__________________________.docxmercysuttle
02 August 2013
Page of 1
ProQuest
_______________________________________________________________
_______________________________________________________________
Report Information from ProQuest
August 02 2013 17:44
_______________________________________________________________
Table of contents
PLEASE RIGHT CLICK HERE AND SELECT "Update Field" TO UPDATE TABLE OF CONTENTS.
1. Cyberbullying, School Bullying, and Psychological Distress: A Regional Census of High School StudentsDocument 1 of 1
Cyberbullying, School Bullying, and Psychological Distress: A Regional Census of High School Students
Author: Schneider, Shari Kessel, MSPH; O'Donnell, Lydia, EdD; Stueve, Ann, PhD; Coulter, Robert W S, BS
Publication info: American Journal of Public Health 102.1 (Jan 2012): 171-7.
ProQuest document link
Abstract: Using data from a regional census of high school students, we have documented the prevalence of cyberbullying and school bullying victimization and their associations with psychological distress. In the fall of 2008, 20406 ninth-through twelfth-grade students in MetroWest Massachusetts completed surveys assessing their bullying victimization and psychological distress, including depressive symptoms, self-injury, and suicidality. A total of 15.8% of students reported cyberbullying and 25.9% reported school bullying in the past 12 months. A majority (59.7%) of cyberbullying victims were also school bullying victims; 36.3% of school bullying victims were also cyberbullying victims. Victimization was higher among nonheterosexually identified youths. Victims report lower school performance and school attachment. Controlled analyses indicated that distress was highest among victims of both cyberbullying and school bullying (adjusted odds ratios [AORs] were from 4.38 for depressive symptoms to 5.35 for suicide attempts requiring medical treatment). Victims of either form of bullying alone also reported elevated levels of distress. Our findings confirm the need for prevention efforts that address both forms of bullying and their relation to school performance and mental health.
Links: Look for Full Text, Look for Full Text
Full text: Headnote
Objectives. Using data from a regional census of high school students, we have documented the prevalence of cyberbullying and school bullying victimization and their associations with psychological distress.
Methods. In the fall of 2008, 20406 ninth- through twelfth-grade students in MetroWest Massachusetts completed surveys assessing their bullying victimization and psychological distress, including depressive symptoms, self-injury, and suicidality.
Results. A total of 15.8% of students reported cyberbullying and 25.9% reported school bullying in the past 12 months. A majority (59.7%) of cyberbullying victims were also school bullying victims; 36.3% of school bullying victims were also cyberbullying victims. Victimization was higher among nonheterosexually identified youths. Victims report lower scho ...
Running head: FINAL PAPER 1
FINAL PAPER 11
Final Paper
Laura Dunkerson
South University Online
8/24/13
Cyber Bullying
Cyber bullying do your sources use one word or two for this term? Take another look. is one of the current social problems that have flourished with the advancement in technology because many people have access to technology today repetitive of “current”. The technology has gone to both good and bad hands. In bad hands, technology has been used to orchestrate various criminal activities. Among the criminal activities facilitated by the technology is cyber bullying. Various studies have been conducted on cyber bullying. This paper highlights some of the arguments in these studies. Despite being an activity that came with the advancement in technology, cyber bullying has rapidly spread in the society and can now affect anybody wherever he or she is if he or she is accessible to the internet. Thesis? What will the essay argue?
A research V conducted by a Harford County Examiner revealed that half the population of teenagers is word form victims of cyber bullying and only 10% of the victims take a step to report the matter to their parents. Among the cyber bullying incidents, less than 20% of the incidents get reported to the law enforcement agencies. Approximately 20% of teenagers have photos of them taken while in embarrassing situations. It further revealed that girls are V often involved in cyber bullying than boys. The study therefore indicates that cyber bullying is V common in teenagers than any other age group. It further shows how parents distance themselves towards monitoring what their teenage children do on the internet how does it show that? The evidence about from the source don’t show that. Therefore, it can be concluded that inadequate parental consent is a major contributor to the high trends of cyber bullying (Thaxter, 2010). The information in this paragraph doesn’t support this conclusion.
In regard to this, Thaxter (2010) researched and wrote a journal article titled “Cyber bullying: Challenges and strategies faced by juvenile police officers.” In this article, the author claims that juvenile police officers are expected by the government to ensure the full enforcement of laws and regulations related to cyber bullying in a school classroom setting. This makes the officers to be outstanding educational reserve this sentence doesn’t make sense. This move what move? by the police officers is centered towards the consequences of cyber bullying on the victims and also impacts that the school cyber bullying has on the behavior on the environment and ambiance at the school. A vital technique to link the differing levels of involvement in bullying is by calling attention to all stu ...
BULLYING ORIGINS, PREVENTION, EVOLUTION IN THE LAST DECADE16VannaSchrader3
BULLYING ORIGINS, PREVENTION, EVOLUTION IN THE LAST DECADE 16
Bullying African American Boys and Girls from The Ages 11-14
Miranda Johnson
Voorhees College
Senior Capstone
Dr. Louis Howell
February 27, 2022
Abstract
Bullying is a vice that continues to haunt humanity, especially the youth in our world today. The matter has been aggravated with the emergence of cyberbullying in addition to traditional bullying. This research proposal aims to explore the origin of bullying, its evolution in the last decade, and the interventions necessary to prevent bullying both traditional and over the internet, focusing on African American teens who have experienced bullying. The research designs, including questionnaires and interviews, will be an effective method of collecting data from the participants, including the African American children between the ages of 11 and 14, and a control group that will be used to allow neutrality. The paper aims to present concrete evidence of the topic's legitimacy and its gravity regarding the country's youth to spur the stakeholders to take action to solve the issue.
Background and Rationale
Traditional bullying and cyberbullying are plagues that have been troubling society for a long time since humans’ enacted their natural orientation to form social institutions like schools. It has been especially true for children in middle school of African American descent between the age of 11 and 14. This research proposal aims to investigate how bullying comes to be, how bullying has evolved in the last decade to the bullying that we see today, and how society can prevent bullying, all the while focusing on African American teenagers between the age of 11 and 14 years.
This problem occurs in a wide range of environments, including their neighborhoods in addition to schools. Bullying is every form of physical, social, or verbal aggression committed by a group or person against a certain party (Kennedy, 2020). Bullying negatively impacts its victims by causing a drop in academic performance, potential psychosocial challenges, criminal wrongdoings, increased risks for suicide, perpetration of risky behavior, and suicidal tendencies.
This scourge is a growing concern, especially in the now integrated multicultural society of interracial interaction. Some studies show that African American teenagers can experience an increased rate of peer victimization than their white peers, owing to their subjective outlooks on racial discrimination. Other studies have shown that African American teenagers are less likely to encounter bullying than their white counterparts (Hong, 2021). The studies have been inclusive on this issue. The period of growth of adolescence is marked with the enactment of risky activities that may not display self-discipline. Since the rise of the digital age, bullying has evolved into traditional and cyberbullying. The increase in access to internet resources has been a huge factor in this evolution, in add ...
Running head RISK OF SOCIAL MEDIA TO DEVELOPMENT OF ADOLESCENTS .docxtodd521
Running head: RISK OF SOCIAL MEDIA TO DEVELOPMENT OF ADOLESCENTS 1
RISK OF SOCIAL MEDIA TO DEVELOPMENT OF ADOLESCENTS 5
Risk of Social Media to Development of Adolescents
Student’s Name
Institution Affiliation
Social media has a great impact on the lives of adolescents. Some of the effects of social media are good but others negatively influence social, moral, physical and spiritual development of the adolescents. Technological advancements and penetration of the communication networks have made social media, social networking sites and development of the smartphones have made accessibility of the social media platforms such as Facebook, Twitter, Instagram, WhatsApp, WeChat, Qzone, Google and many others readily available to the adolescents. However, there are significant risks that are associated with the use of social media that influence the development of adolescents.
Various studies have been done touching on the effect of social media on the development of adolescents and teenagers. Some studies consider both negative and positive effects of social media. However, in this particular study, we learn more on the risk factors hence we deal more on the negative effects of the social media on the development of the adolescent.
In the study conducted in the year 2019 by Keles, McCrae and Realish, they revealed that in 92% of the teenagers are the active users of social media. This clearly shows that teenagers are the greatest per cent that is the active users of the social media and therefore are mostly affected by social media.
In reviewing further studies to establish how social media can impact the development of the adolescent, Urie Bronfenbrenner makes it clear that type of the environment that people interact in will influence their behavior. This means that social media has the ability to influence adolescents negatively. It is therefore important to evaluate bad behaviors that are related to the use of social media and determine if they are applicable to adolescents.
In one particular study, it was revealed that mental disorders are very common among adolescents. In the United Kingdom, the study revealed that cases of the girls harming themselves had increased by 68%. Many of the cases of mental disorders were correlated to social media. On further analysis, it was identified that majority of the teenagers have multiples social accounts which demand much their attention, some do not have enough time to sleep while on the social media and others have been addicted to the social media which leads cases of the depression among the adolescents (Keles, McCrae & Grealish, 2019).
In another study, cyberbullying has been reported has the common problem of social media. This is the problems that teenagers are suffering in the hands of social media. In the year 2017, Underwood and Ehrenreich established that particular research done in 2014 had identified that 10-40% of the teenagers had reported having suffered from .
International Forum of Educational Technology & SocietyMid.docxLaticiaGrissomzz
International Forum of Educational Technology & Society
Middle School Students’ Social Media Use
Author(s): Florence Martin, Chuang Wang, Teresa Petty, Weichao Wang and Patti Wilkins
Source: Journal of Educational Technology & Society , Vol. 21, No. 1 (January 2018), pp.
213-224
Published by: International Forum of Educational Technology & Society
Stable URL: https://www.jstor.org/stable/10.2307/26273881
REFERENCES
Linked references are available on JSTOR for this article:
https://www.jstor.org/stable/10.2307/26273881?seq=1&cid=pdf-
reference#references_tab_contents
You may need to log in to JSTOR to access the linked references.
JSTOR is a not-for-profit service that helps scholars, researchers, and students discover, use, and build upon a wide
range of content in a trusted digital archive. We use information technology and tools to increase productivity and
facilitate new forms of scholarship. For more information about JSTOR, please contact [email protected]
Your use of the JSTOR archive indicates your acceptance of the Terms & Conditions of Use, available at
https://about.jstor.org/terms
International Forum of Educational Technology & Society is collaborating with JSTOR to digitize,
preserve and extend access to Journal of Educational Technology & Society
This content downloaded from
������������130.160.24.117 on Mon, 26 Aug 2019 01:28:12 UTC�������������
All use subject to https://about.jstor.org/terms
https://www.jstor.org/stable/10.2307/26273881
https://www.jstor.org/stable/10.2307/26273881?seq=1&cid=pdf-reference#references_tab_contents
Martin, F., Wang, C., Petty, T., Wang, W., & Wilkins, P. (2018). Middle School Students’ Social Media Use. Educational
Technology & Society, 21 (1), 213–224.
213
ISSN 1436-4522 (online) and 1176-3647 (print). This article of the Journal of Educational Technology & Society is available under Creative Commons CC-BY-ND-NC
3.0 license (https://creativecommons.org/licenses/by-nc-nd/3.0/). For further queries, please contact Journal Editors at [email protected]
Middle School Students’ Social Media Use
Florence Martin*, Chuang Wang, Teresa Petty, Weichao Wang and Patti Wilkins
University of North Carolina Charlotte, Charlotte, NC, USA // [email protected] //
[email protected] // [email protected] // [email protected] // [email protected]
*Corresponding author
ABSTRACT
Cyber bullying, digital identity, impact of digital footprints, and use of inappropriate social media are topics
that are gaining attention in K-12 schools. As more schools and school districts are implementing 1-1 and
“bring your own technology” initiatives, attention to these topics is becoming increasingly important. A
total of 593 middle school students were surveyed about digital footprints and concerns about social media.
The results show that 17% started using social media at age nine or yo.
CYBERBULLYING EXPERIENCES OF UNIVERSITY OF MINDANAO CRIMINOLOGY STUDENTSAJHSSR Journal
ABSTRACT:This paper explores the cyberbullying experiences among Criminology students at the
University of Mindanao. A simple random sampling method was used to distribute the study's online
questionnaire to the respondents and to survey the target population. This study has four hundred (400)
respondents, and the respondents are Criminology students at the University of Mindanao. The findings of this
study revealed that the level of cyberbullying experiences is sometimes manifested. On the other hand, the
cyberbullying experiences of the students indicate a moderate level, which indicates that the cyberbullying
experiences of the respondents are sometimes manifested. Also, the computations showed that among the
indicators presented, the highest mean is obtained in the psychological effect, which implies that there is a
significant effect of cyberbullying experiences of the respondents in terms of the Gender level of the
respondents. Therefore, respondents with a low level of cyberbullying experiences tend to have a moderate level
of cyberbullying experience. However, there is no significant effect in terms of age and year level of the
respondents according to the results regarding the psychological, emotional, and physical impact of
cyberbullying.
KEYWORDS :cyberbullying, emotional, experiences, psychological,physical effect, and simple random
sampling method.
IAO publishes the White Paper for the month of April, 2017. In this White Paper you will read about Cyberbullying, a new emerging issue in schools around the world and what role can educators play in dealing with the offenders.
Cold Sores: Causes, Treatments, and Prevention Strategies | The Lifesciences ...The Lifesciences Magazine
Cold Sores, medically known as herpes labialis, are caused by the herpes simplex virus (HSV). HSV-1 is primarily responsible for cold sores, although HSV-2 can also contribute in some cases.
International Cancer Survivors Day is celebrated during June, placing the spotlight not only on cancer survivors, but also their caregivers.
CANSA has compiled a list of tips and guidelines of support:
https://cansa.org.za/who-cares-for-cancer-patients-caregivers/
CHAPTER 1 SEMESTER V PREVENTIVE-PEDIATRICS.pdfSachin Sharma
This content provides an overview of preventive pediatrics. It defines preventive pediatrics as preventing disease and promoting children's physical, mental, and social well-being to achieve positive health. It discusses antenatal, postnatal, and social preventive pediatrics. It also covers various child health programs like immunization, breastfeeding, ICDS, and the roles of organizations like WHO, UNICEF, and nurses in preventive pediatrics.
Empowering ACOs: Leveraging Quality Management Tools for MIPS and BeyondHealth Catalyst
Join us as we delve into the crucial realm of quality reporting for MSSP (Medicare Shared Savings Program) Accountable Care Organizations (ACOs).
In this session, we will explore how a robust quality management solution can empower your organization to meet regulatory requirements and improve processes for MIPS reporting and internal quality programs. Learn how our MeasureAble application enables compliance and fosters continuous improvement.
The global radiation oncology market size reached US$ 8.1 Billion in 2023. Looking forward, IMARC Group expects the market to reach US$ 14.5 Billion by 2032, exhibiting a growth rate (CAGR) of 6.5% during 2024-2032.
More Info:- https://www.imarcgroup.com/radiation-oncology-market
LGBTQ+ Adults: Unique Opportunities and Inclusive Approaches to CareVITASAuthor
This webinar helps clinicians understand the unique healthcare needs of the LGBTQ+ community, primarily in relation to end-of-life care. Topics include social and cultural background and challenges, healthcare disparities, advanced care planning, and strategies for reaching the community and improving quality of care.
Under Pressure : Kenneth Kruk's StrategyKenneth Kruk
Kenneth Kruk's story of transforming challenges into opportunities by leading successful medical record transitions and bridging scientific knowledge gaps during COVID-19.
Deep Leg Vein Thrombosis (DVT): Meaning, Causes, Symptoms, Treatment, and Mor...The Lifesciences Magazine
Deep Leg Vein Thrombosis occurs when a blood clot forms in one or more of the deep veins in the legs. These clots can impede blood flow, leading to severe complications.
PET CT beginners Guide covers some of the underrepresented topics in PET CTMiadAlsulami
This lecture briefly covers some of the underrepresented topics in Molecular imaging with cases , such as:
- Primary pleural tumors and pleural metastases.
- Distinguishing between MPM and Talc Pleurodesis.
- Urological tumors.
- The role of FDG PET in NET.
the IUA Administrative Board and General Assembly meeting
Covid bullying wp2021-8_final
1. The COVID-19
Pandemic Disrupted
Both School Bullying
and Cyberbullying
Andrew Bacher-Hicks, Joshua Goodman, Jennifer Greif Green, Melissa K. Holt
Working Paper 2021–8
SUMMER 2021
2. The COVID-19 Pandemic Disrupted
Both School Bullying and Cyberbullying
Andrew Bacher-Hicks
Joshua Goodman
Jennifer Greif Green
Melissa K. Holt
Boston University
July 7, 2021
Abstract
School bullying is widespread and has substantial social costs. One in five U.S. high school students
report being bullied each school year and these students face greater risks of serious mental health chal-
lenges that extend into adulthood. As the COVID-19 pandemic forced most students into online education,
many have worried that cyberbullying prevalence would grow dramatically. We use data from Google
internet searches to examine changing bullying patterns as COVID-19 disrupted in-person schooling. Pre-
pandemic historical patterns show that internet searches provide useful information about actual bullying
behavior. Real-time data then shows that searches for school bullying and cyberbullying both dropped
about 30-40 percent as schools shifted to remote learning in spring 2020. This drop is sustained through
the fall and winter of the 2020-21 school year, though the gradual return to in-person instruction partially
returns bullying searches to pre-pandemic levels. These results highlight how in-person interaction is an
important mechanism underlying not only in-person school bullying, but also cyberbullying. We discuss
how this otherwise damaging shock to students and schools provides insight into the mixed impact of the
pandemic on student well-being.
3. 1 Introduction
For several decades, school-based bullying and cyberbullying have been the focus of policy and legisla-
tive initiatives due to their substantial impact on the physical and mental health of youth (Holt et al., 2015;
Wolke et al., 2013). Youth involved in bullying–as both victims and aggressors–are more likely to experience
depression (Wang et al., 2011), anxiety (Kowalski and Limber, 2013), and suicidal thoughts and behaviors
(Holt et al., 2015) than their uninvolved peers. Cyberbullying has an even stronger association with suicidal
ideation than in-person peer victimization (Van Geel et al., 2014). The negative effects of bullying persist
even after the abuse has stopped and are linked to a wide range of physical, mental, and economic chal-
lenges in adulthood (Takizawa et al., 2014; Wolke et al., 2013; Wolke and Lereya, 2015). Despite the policy
and legislative efforts to end bullying and its harmful effects, it remains a common occurrence in schools
and online. Among U.S. high school students in 2019, 20 percent reported being bullied in person at school
and 16 percent reported being cyberbullied at some point in the prior year (Basile et al., 2020).
The COVID-19 pandemic radically changed the context for bullying dynamics. As schools were forced
to close and shift to remote learning across the U.S. in March 2020, there was a sudden decrease in in-person
interaction and dramatic surge in the use of digital technology (Koeze and Popper, 2020; De et al., 2020).
With this shift came public concern about the consequences of children’s increased reliance on technol-
ogy, including the potential for more exposure to cyberbullying (Sparks, 2020). Indeed, research prior to
COVID-19 indicated that higher frequency of internet use was associated with increased youth reports of
cyberbullying and cybervictimization (Kowalski et al., 2014, 2019). As such, media outlets expressed expec-
tations that while in-person bullying might decline, cyberbullying would likely increase.1
This disruption
to the traditional functioning of schools provides an opportunity to examine the association of bullying and
cyberbullying with in-person schooling.
Few studies have, however, examined how the reduction of in-person interaction and increased use of
technology during the pandemic have impacted bullying and cyberbullying. In a survey of U.S. adults, Bar-
lett et al. (2021) found that those with personal pandemic-related experiences, such as having had COVID-
19, were more likely to report conducting cyber-attacks, perhaps because of increased pandemic-related
stress. Using data from two separate samples of Indian 15-25 year-olds, one collected before and the other
after pandemic-related lockdown, Jain et al. (2020) found that online behaviors associated with increased
risk for cyberbullying increased during the pandemic. Using Twitter data from a six month window be-
1Examples of this include not only the general concern that additional time spent online would lead to increases in cyberbully-
ing (Darmanjian, 2020; Farge, 2020; Sparks, 2020), but also a specific concern that online bullying regarding the pandemic would
disproportionately target Asian-American youth (Wang, 2020).
1
4. tween January and June 2020, Das et al. (2020) found increases in some bullying-related keywords (Twitter
bullying) that are consistent with the onset of the pandemic, but not with others (online bullying).
Given the small number and limitations of existing research, this study seeks to fill this gap by assess-
ing in real time and with a measure of behavior generated by a wide cross-section of Americans whether
bullying involvement has varied over the course of the pandemic. Using a long panel of publicly avail-
able Google Trends online search data, we document new facts about the prevalence and mechanisms
behind school bullying and cyberbullying. We start by showing two pieces of evidence suggesting that
pre-pandemic online search data is related to actual bullying prevalence. First, pre-pandemic online search
intensity for both types of bullying closely follows the school calendar, with searches lowest during sum-
mers and highest during the school year. Second, pre-pandemic state-level variation in searches for bullying
is strongly correlated with state-level variation in self-reported bullying rates, suggesting search contains
information about actual bullying behavior.
Our main contribution is then to show the evolution of school bullying and cyberbullying during the
pandemic. Given that schools in the United States shut down for substantial periods starting in March 2020
and that youth were around peers less frequently, it would be reasonable to expect in-person rates of bully-
ing to have declined. In contrast, as many K-12 students increased their online presence considerably due
to remote schooling, past research suggests that cyberbullying prevalence might have increased (Kowalski
et al., 2014, 2019). We show the former prediction is correct but the latter is not. In spring 2020, when
schools shifted to remote learning due to the pandemic, search for school bullying and cyberbullying both
dropped about 30-40 percent. That drop is sustained through the subsequent 2020-21 school year, particu-
larly in areas where more schools remained fully remote. We show that the return to in-person instruction
partially returns bullying search behavior to pre-pandemic norms.
These findings have two important implications. First, they suggest that this otherwise damaging shock
to students and schools may provide insight into how schools can reduce bullying in a post-pandemic
world. For example, in-person interactions at school appear to be important drivers not only of in-person
school bullying but also of cyberbullying. Second, these results highlight one potential mechanism under-
lying COVID-19’s mixed impacts on mental health more broadly. Brodeur et al. (2021), for example, find
that COVID-19 has increased loneliness but decreased stress and suicidal ideation. Despite the substantial
challenges of the pandemic, our results highlight one unlikely benefit of reduced in-person interaction and
provide evidence of one mechanism to help explain the emerging evidence of COVID-19’s mixed effects on
children’s mental health.
2
5. 2 Data
Our measures of bullying search intensity come from Google Trends, which makes publicly available
monthly internet search behavior both nationally and by state. The publicly available measure of search be-
havior for a given term or topic is “search intensity,” which calculates the fraction of a given area’s Google
searches devoted to that term or topic. Google Trends normalizes measures of search intensity in a way that
masks the actual fraction of searches devoted to a topic but allows for comparison of relative intensity over
time and across states. We can thus measure whether search intensity for a given term is, for example, twice
as high in one time period relative to another or in one state relative to another state. Given the arbitrary
nature of that normalization, we generally use the logarithm of search intensity so that differences over
time and across states can be interpreted in percent terms.
We focus on three measures of online search intensity for bullying: the intensity of search for “school
bullying”, for “cyberbullying”, and for the sum of those two, which we refer to as overall “bullying.” We
use Google Trends data on those search terms as “topics”, which includes in the measure not only searches
that contain that specific term but also searches that contain closely related keywords in English and other
languages. Search intensity for the topic of “school bullying” will thus include searches containing the
exact phrase “school bullying”, closely related English variants such as “school bully”, and versions of that
phrase in Spanish, for example.
Using internet search data offers several advantages over survey data. First, unlike survey-based ef-
forts to collect information on well-being following COVID-19 (Jaeger et al., 2021), Google Trends data
is available over a long panel and allows for the analysis of trends before, during, and after the onset of
COVID-19. Second, Google Trends data are not self-reported and are less susceptible to interviewer or so-
cial desirability biases (Conti and Sobiesk, 2007). Third, Google Trends data do not have the potential issue
of differential response from only a self-selected sub-sample of respondents. Instead, it is representative of
the full population of Google search users in the United States.
The data have some potential limitations. First, publicly available data from Google Trends is limited
to aggregate trends in the popularity of specific keywords. There is no information on the person who per-
formed the search or the specific reason for the search, such as whether they were a victim, perpetrator, or
witness. Second, Google Trends search data are available only for individuals with internet access and who
use Google for internet searches. This method may exclude individuals living in under-resourced com-
munities and the representativeness of data may have changed somewhat over time as schools increased
3
6. technology access to families and students became more adept at searching the internet. Finally, we rely
on search terms specifically related to bullying and cyberbullying, which aligns with this paper’s focus but
may exclude bullying-related searches that reference other terms, such as harassment or victimization.
Another potential concern is whether internet searches serve as useful proxies for actual bullying. While
online search has been used to predict a wide variety of economic and social outcomes, it has yet to be
used to assess bullying.2
Therefore, to evaluate the predictive validity of online search intensity for actual
bullying behavior in the pre-pandemic period, we collect data from the Youth Risk Behavior Survey (YRBS).
Administered by the Centers for Disease Control and Prevention, YRBS surveys a large and both nationally
and state-level representative sample of 9th through 12th grade students every two years. Across recent
waves, the survey has asked two bullying-related questions: “During the past 12 months, have you ever
been bullied on school property?” and “During the past 12 months, have you ever been electronically
bullied?” We use answers to these questions to construct state-level fractions of students who report being
bullied, either in school or virtually.
Finally, we combine the Google Trends data with national data on school instructional modes in the
2020-2021 school year to examine the link between in-person schooling and bullying. The in-person school-
ing data comes from Burbio, a private company that began systematically collecting information about
school districts’ learning modes during the pandemic. Every three days, Burbio collects for over 1,200
school districts publicly available data on the district’s learning mode from sources such as district web-
sites and Facebook posts. Burbio then generates weekly measures by county of the fraction of grades in
a given school district following an in-person, hybrid, or virtual learning mode. We then aggregate these
measures to the state level to connect with our measures of search intensity for bullying.
3 Empirical Strategy
We estimate pandemic-induced changes in searches intensity for bullying using two complementary ana-
lytic strategies. The first, a month-by-month event study specification, estimates the effect of COVID-19 on
search intensity in each month beginning in March 2020. The second approach, a before-after specification,
is a simplified version of the month-by-month event study and provides an estimate of the average effect of
COVID-19 on bullying-related internet searches. These approaches follow the methodology established in
2Prior work shows the utility of search data in predicting economic and social outcomes such as parents’ preferences for schools
(Schneider and Buckley, 2002), disease spread (Polgreen et al., 2008), consumer behavior (Choi and Varian, 2012), voting (Stephens-
Davidowitz, 2014), and fertility decisions (Kearney and Levine, 2015). Most recently, Goldsmith-Pinkham and Sojourner (2020) use
the volume of online search for unemployment benefits to predict unemployment claims during the pandemic.
4
7. prior work using Google Trends to analyze the effects of COVID-19 on access to learning resources(Bacher-
Hicks et al., 2021).3
An important first step for both approaches is to remove seasonal patterns in searches for bullying. As
we highlight in the next section, searches for bullying typically peak in the beginning of the school year
and fall substantially during the summer months. Any analysis that fails to account for seasonality may
underestimate or overestimate the effects of COVID-19 on search intensity. To address this, we generate an
adjusted measure of search intensity by removing calendar month effects and annual time trends based on
pre-pandemic patterns in bullying-related internet searches. We use data only from the pre-pandemic sam-
ple period to estimate month effects and linear time trends but then apply these corrections to all months,
including post-pandemic ones. This approach avoids potentially over-correcting for seasonality due to
pandemic-induced changes. We use this adjusted measure as our main outcome variable in a series of
ordinary least squares (OLS) regression models.
In the event study specification, we regress the logarithm of adjusted monthly search intensity in each
state on a vector of month indicators and a vector of state indicators. We use the logarithm so that dif-
ferences over time and across states can be interpreted in percent terms. By excluding the February 2020
indicator and including state indicators, the coefficients of interest represent the deviation in each month
from calendar-predicted search intensity relative to the same deviation in February 2020.
The nationwide before-after specification uses the same underlying adjusted measure as the event study
specification but replaces the vector of month indicators with a single post-pandemic indicator. Again, by
adjusting for calendar effects and including state fixed effects, the coefficient of interest from this specifi-
cation can be interpreted as the overall post-pandemic change in search intensity compared to those same
weeks in prior years.
While our primary before-after specification uses a single indicator for the entire post-pandemic time
period, we conduct several specifications with additional post-pandemic indicators to separately examine
three distinct time periods: the end of the spring 2020 school year (March 2020 through May 2020), the
summer of 2020 (June 2020 through August 2020), and the first half of the 2020-2021 school year (Sept 2020
through February 2021). We do so by replacing the single post-pandemic indicator in the main before-
after specification with three separate indicators corresponding to each time period. Finally, to study how
search intensity changed differentially by states’ school instructional modes, we modify these before-after
specifications by interacting the post-pandemic indicator(s) with a measure of the percentage of schools
3For a detailed discussion of our empirical strategy, see Appendix Section B.
5
8. offering in-person instruction in each state during the first half of the 2020-21 school year. These specifi-
cations identify whether school transitions back to in-person instruction changes the effect of COVID-19
on bullying-related searches. All regressions use standard errors clustered by state and month and are
weighted by state population to be nationally representative at the individual level.
4 Results
We begin by presenting two forms of evidence consistent with online search for bullying proxying for
actual bullying behavior in the pre-pandemic period. First, online search intensity for bullying closely
tracks the school year calendar. As shown in the raw data in Figure 1, pre-pandemic search intensity for
both school bullying and cyberbullying decreases dramatically during the summer and ramps up again
in months when school is in session. Figure 2 makes that even clearer by plotting the month “effects”
from our regression model. Search for all forms of bullying is lowest in July, increases as schools reopen in
August and September, and remains relatively steady until June, when the school year ends. Slight dips in
November, December, and January correspond to months with more school vacations. This pattern over
the calendar year is consistent with households searching for bullying-related resources much more when
school is in session and bullying rates are presumably higher.
Second, pre-pandemic state-level self-reported rates of bullying are strongly correlated with state-level
online search intensity for bullying-related terms. Figure 3 plots the state-level relationship between the
fraction of students reporting being bullied or cyberbullied in the YRBS against the average search intensity
for bullying, both measured from 2013 through 2019. The state population-weighted correlation coefficient
between these two variables is 0.45, which is statistically significant at the 1 percent level. States where
students are more likely to report being bullied are states where a higher fraction of Google searches are
devoted to bullying. This strong correlation between state-level reported bullying rates and search intensity
holds not only for overall bullying but also for school bullying and cyberbullying separately.4
We interpret
this as further evidence that, pre-pandemic, online search intensity for bullying is closely related to actual
bullying behaviors.
If the pre-pandemic relationship between online search for bullying and actual bullying continued to
hold after the pandemic started, then the pandemic dramatically reduced both school bullying and cy-
berbullying. We see this first in the raw data in Figure 1, where online search intensity for both sets of
4See Figure C.1 for the graphical version of this evidence and Table C.3 for the corresponding correlation coefficients.
6
9. bullying-related terms appears to drop dramatically starting in March 2020 relative to historical trends.
Figure 4 makes this even clearer by plotting, in an event study framework, monthly deviations from pre-
pandemic trends in bullying search intensity, with February 2020 as the benchmark. In the year leading
up to the pandemic, school bullying and cyberbullying search intensity were indistinguishable from their
usual monthly levels. Search intensity for both forms of bullying then dropped substantially in spring 2020,
rebounded to at or slightly above their usual low levels during the summer, then dropped again in fall 2020.
The magnitude of these drops in bullying search intensity are substantial. Table 1 shows regression
estimates of these post-pandemic drops, essentially averaging the monthly coefficients from Figure 4 across
various time periods. Panel A shows that, across the entire post-pandemic period of March 2020 through
February 2021, search intensity for bullying dropped by an average of 27 percent (-32 log points). This drop
combines a 33 percent (-40 log points) drop in school bullying search and a smaller but still substantial 20
percent (-22 log points) drop in cyberbullying search.
Consistent with the event study graphs, panel B of Table 1 shows search for bullying dropped most
relative to historical norms during the school year and much less so during the summer. Both school and
cyberbullying search were historically low in spring 2020 and then again in the next school year. From
September 2020 through February 2021, bullying search decreased by 36 percent (-44 log points), driven
by a school bullying decrease of 40 percent (-52 log points) and a cyberbullying decrease of 30 percent (-
36 log points). Overall bullying search intensity during the summer is statistically indistinguishable from
historical norms, though there is some evidence for an increase in cyberbullying relative to its usually low
summer levels.
Given the evidence that bullying drops relative to historical norms only during the school year and not
in the summer, we turn to more direct evidence that bullying decreased during the pandemic because of
school closures. Figure 5 plots state-level average bullying search intensity from September 2020 through
February 2021 as a function of the proportion of schools offering only virtual instruction or in-person in-
struction, averaged over the same time period. Panel A shows that states with a higher fraction of schools
offering only virtual instruction also see substantially lower search intensity for bullying. Panel B shows
that states with a higher proportion of in-person instruction see substantially higher search intensity for
bullying. These strong correlations hold both for school bullying and for cyberbullying considered sepa-
rately.5
To further quantify the relationship between in-person instruction and bullying search, we run regres-
5See Figures C.2 and C.3.
7
10. sion models estimating how much the 2020-21 school year drop in bullying varies by the extent to which
a given state has re-started in-person schooling. Panel C of Table 1 shows the results of those models,
which estimate that in areas where schooling remained fully remote bullying dropped by 42 percent (-55
log points). Offering in-person schooling offsets that effect, with the coefficient suggesting that bullying
only dropped by 19 percent (34 - 55 log points) in areas where all students were given an in-person op-
tion. Interestingly, the coefficients suggest that fully re-starting in-person instruction is associated with
cyberbullying nearly completely returning to pre-pandemic levels but with school bullying returning only
halfway.
5 Discussion
Using online search data in the U.S., we provide the first nationwide measures of in-person bullying and
cyberbullying during the COVID-19 pandemic. Our results suggest that both in-person bullying and cy-
berbullying decreased dramatically during the school years affected by the pandemic. The decrease in
cyberbullying is particularly noteworthy as it stands in contrast to fears that it would increase during the
pandemic as youth spend more time online. That both forms of bullying decreased is, however, consistent
with prior evidence that cyberbullying is strongly associated with in-person bullying and primarily reflects
in-person bullying enacted through a different medium (Modecki et al., 2014; Gini et al., 2018).
We show that school transitions to remote learning are likely a major explanation for this drop in both
forms of bullying. Areas where more schools re-started in-person instruction saw a greater return to pre-
pandemic levels of bullying search. Our estimates do not, however, suggest that a full return to in-person
instruction led to a complete return to pre-pandemic bullying levels during the school year. This may be
driven by the fact that, even in school districts providing an in-person option, not all students chose to
exercise that option. Those remaining fully or partially remote may have continued to benefit from the
apparent protective effects of remote learning on exposure to bullying in its various forms. The finding that
cyberbullying rates increased in the summer, relative to their usual low summer rates, further suggests that
the overall decline in cyberbullying during the pandemic is linked to decreased in-person schooling.
This reduction in bullying, even in districts offering in-person schooling, may partly explain the mixed
results among early studies of the impact of COVID-19 on adolescent mental health. In particular, the
pandemic-induced decrease in bullying may have offset otherwise substantial negative impacts on adoles-
cent mental health. Early concerns that the pandemic would substantially harm students’ mental health
8
11. (Golberstein et al., 2020) have been partially but not fully supported by subsequent data suggesting ar-
guably small increases in such measures (Kemper et al., 2021; Leeb et al., 2020). Some surveys even suggest
that a non-trivial portion of adolescents describe their mental health as having improved during school
closures (Ford et al., 2021). Forced isolation from peers may have been beneficial for those who would be
victims, or even perpetrators, of bullying.
The reductions in bullying documented here may also relate to the changed nature of in-person school-
ing during the pandemic. For example, those who returned to school experienced substantially more struc-
tured educational environments than in prior years. Public health measures such as social distancing, mask
wearing, and attempts to reduce mixing of students across different classrooms substantially restricted the
number of interactions students might otherwise have experienced and increased the amount of adult su-
pervision. Such measures likely reduced the amount of unstructured and unsupervised time students spent
with each other in large groups, including during lunch, recess, and movement between classrooms. Such
unstructured times and spaces are often where students feel least safe and are most likely to experience bul-
lying (Vaillancourt et al., 2010). The collective experience of the pandemic may have also increased school
staff awareness and responsiveness to student social-emotional wellbeing. For example, school staff might
have more readily attended to and addressed particular forms of bullying highlighted by public media dur-
ing the pandemic, such as anti-Asian harassment. Taken together, our results suggest that schools might
find constructive lessons to be drawn to keep bullying from returning to the high levels of pre-pandemic
times.
Because surveillance of bullying typically occurs in school settings via self-reported surveys such as
the YRBS, there are very few studies on bullying during the pandemic and even fewer using publicly-
available nationwide data. In this context, Google Trends data provide a unique opportunity for real time
surveillance of bullying, while posing no risk to children and families. Our analyses can also be updated
in real time to study the future changes, can be modified to study additional search terms, and can be
replicated in other countries. Further work along these lines will help identify the mechanisms underlying
decreases in bullying during the pandemic and inform which aspects of pandemic-era schooling are worth
considering as bullying reduction strategies while otherwise returning students and schools to their pre-
pandemic routines.
9
12. References
Bacher-Hicks, A., J. Goodman, and C. Mulhern (2021). Inequality in household adaptation to schooling
shocks: Covid-induced online learning engagement in real time. Journal of Public Economics 193, 104345.
Barlett, C. P., A. Rinker, and B. Roth (2021). Cyberbullying perpetration in the covid-19 era: An application
of general strain theory. The Journal of Social Psychology, 1–11.
Basile, K. C., H. B. Clayton, S. DeGue, J. W. Gilford, K. J. Vagi, N. A. Suarez, M. L. Zwald, and R. Lowry
(2020). Interpersonal violence victimization among high school students—youth risk behavior survey,
united states, 2019. MMWR supplements 69(1), 28.
Brodeur, A., A. E. Clark, S. Fleche, and N. Powdthavee (2021). Covid-19, lockdowns and well-being: Evi-
dence from google trends. Journal of public economics 193, 104346.
Choi, H. and H. Varian (2012). Predicting the present with Google Trends. Economic Record 88, 2–9.
Conti, G. and E. Sobiesk (2007). An honest man has nothing to fear: user perceptions on web-based infor-
mation disclosure. In Proceedings of the 3rd Symposium on Usable Privacy and Security, pp. 112–121.
Darmanjian, S. (2020, April 8). Organizations say rise in cyberbullying likely during covid-19 isolation.
ABC NEWS10 Albany.
Das, S., A. Kim, and S. Karmakar (2020). Change-point analysis of cyberbullying-related twitter discussions
during covid-19. arXiv preprint arXiv:2008.13613.
De, R., N. Pandey, and A. Pal (2020). Impact of digital surge during Covid-19 pandemic: A viewpoint on
research and practice. International Journal of Information Management 55, 102171.
Farge, E. (2020, May 5). Children at risk as pandemic pushes them online, warns u.n. agency. Reuters.
Ford, T., A. John, and D. Gunnell (2021). Mental health of children and young people during pandemic.
BMJ (Clinical Research ed.) 372, n614–n614.
Gini, G., N. A. Card, and T. Pozzoli (2018). A meta-analysis of the differential relations of traditional and
cyber-victimization with internalizing problems. Aggressive Behavior 44(2), 185–198.
Golberstein, E., H. Wen, and B. F. Miller (2020, 09). Coronavirus Disease 2019 (COVID-19) and Mental
Health for Children and Adolescents. JAMA Pediatrics 174(9), 819–820.
Goldsmith-Pinkham, P. and A. Sojourner (2020). Predicting initial unemployment insurance claims using
Google Trends. Working Paper.
Holt, M. K., A. M. Vivolo-Kantor, J. R. Polanin, K. M. Holland, S. DeGue, J. L. Matjasko, M. Wolfe, and
G. Reid (2015). Bullying and suicidal ideation and behaviors: a meta-analysis. Pediatrics 135(2), e496–
e509.
Jaeger, D. A., J. Arellano-Bover, K. Karbownik, M. Martı́nez-Matute, J. M. Nunley, A. Seals, M. Alston, S. O.
Becker, P. Beneito, R. Böheim, et al. (2021). The global covid-19 student survey: First wave results.
Jain, O., M. Gupta, S. Satam, and S. Panda (2020). Has the covid-19 pandemic affected the susceptibility to
cyberbullying in india? Computers in Human Behavior Reports 2, 100029.
Kearney, M. S. and P. B. Levine (2015). Media influences on social outcomes: The impact of MTV’s 16 and
Pregnant on teen childbearing. American Economic Review 105(12), 3597–3632.
Kemper, A. R., C. A. Hostutler, K. Beck, C. A. Fontanella, and J. A. Bridge (2021). Depression and suicide-
risk screening results in pediatric primary care. Pediatrics.
10
13. Koeze, E. and N. Popper (2020, April 7). The virus changed the way we internet. The New York Times.
Kowalski, R. M., G. W. Giumetti, A. N. Schroeder, and M. R. Lattanner (2014). Bullying in the digital age:
A critical review and meta-analysis of cyberbullying research among youth. Psychological bulletin 140(4),
1073.
Kowalski, R. M. and S. P. Limber (2013). Psychological, physical, and academic correlates of cyberbullying
and traditional bullying. Journal of adolescent health 53(1), S13–S20.
Kowalski, R. M., S. P. Limber, and A. McCord (2019). A developmental approach to cyberbullying: Preva-
lence and protective factors. Aggression and Violent Behavior 45, 20–32.
Leeb, R. T., R. H. Bitsko, L. Radhakrishnan, P. Martinez, R. Njai, and K. M. Holland (2020). Mental
health–related emergency department visits among children aged¡ 18 years during the covid-19 pan-
demic—united states, january 1–october 17, 2020. Morbidity and Mortality Weekly Report 69(45), 1675.
Modecki, K. L., J. Minchin, A. G. Harbaugh, N. G. Guerra, and K. C. Runions (2014). Bullying preva-
lence across contexts: A meta-analysis measuring cyber and traditional bullying. Journal of Adolescent
Health 55(5), 602–611.
Polgreen, P. M., Y. Chen, D. M. Pennock, F. D. Nelson, and R. A. Weinstein (2008). Using internet searches
for influenza surveillance. Clinical Infectious Diseases 47(11), 1443–1448.
Schneider, M. and J. Buckley (2002). What do parents want from schools? evidence from the internet.
Educational evaluation and policy analysis 24(2), 133–144.
Sparks, S. (2020, July 22). Cyberbullying, mental health, and other school-safety takeaways for school
reopening. EducationWeek.
Stephens-Davidowitz, S. (2014). The cost of racial animus on a black candidate: Evidence using Google
search data. Journal of Public Economics 118, 26–40.
Takizawa, R., B. Maughan, and L. Arseneault (2014). Adult health outcomes of childhood bullying victim-
ization: evidence from a five-decade longitudinal british birth cohort. American journal of psychiatry 171(7),
777–784.
Underwood, J. M., N. Brener, J. Thornton, W. A. Harris, L. N. Bryan, S. L. Shanklin, N. Deputy, A. M.
Roberts, B. Queen, D. Chyen, et al. (2020). Overview and methods for the youth risk behavior surveillance
system—united states, 2019. MMWR supplements 69(1), 1.
Vaillancourt, T., H. Brittain, L. Bennett, S. Arnocky, P. McDougall, S. Hymel, K. Short, S. Sunderani, C. Scott,
M. Mackenzie, et al. (2010). Places to avoid: Population-based study of student reports of unsafe and
high bullying areas at school. Canadian Journal of School Psychology 25(1), 40–54.
Van Geel, M., P. Vedder, and J. Tanilon (2014). Relationship between peer victimization, cyberbullying, and
suicide in children and adolescents: a meta-analysis. JAMA pediatrics 168(5), 435–442.
Wang, C. (2020, September 17). ’You have chinese virus!’: 1 in 4 Asian American youths experience racist
bullying, report says. NBC News.
Wang, J., T. R. Nansel, and R. J. Iannotti (2011). Cyber and traditional bullying: Differential association with
depression. Journal of adolescent health 48(4), 415–417.
Wolke, D., W. E. Copeland, A. Angold, and E. J. Costello (2013). Impact of bullying in childhood on adult
health, wealth, crime, and social outcomes. Psychological science 24(10), 1958–1970.
Wolke, D. and S. T. Lereya (2015). Long-term effects of bullying. Archives of disease in childhood 100(9),
879–885.
11
14. Figure 1: Nationwide Monthly Search Intensity for Bullying (Pre- and Post-COVID)
-1
-.5
0
.5
1
Log(Search
Intensity)
Jan 16 Jan 17 Jan 18 Jan 19 Jan 20 Jan 21
Jul 16 Jul 17 Jul 18 Jul 19 Jul 20
(A) Bullying
-1
-.5
0
.5
1
Log(Search
Intensity)
Jan 16 Jan 17 Jan 18 Jan 19 Jan 20 Jan 21
Jul 16 Jul 17 Jul 18 Jul 19 Jul 20
(B) School Bullying
-1
-.5
0
.5
1
Log(Search
Intensity)
Jan 16 Jan 17 Jan 18 Jan 19 Jan 20 Jan 21
Jul 16 Jul 17 Jul 18 Jul 19 Jul 20
(C) Cyberbullying
Notes: The figure above shows the logarithm of nationwide search intensity relative to intensity in January of 2016. Panel A shows
search intensity for a composite search term that includes “School Bullying” and “Cyberbullying.” Panel B shows search intensity for
“School Bullying” and panel C shows search intensity for “Cyberbullying.” The vertical dashed line is drawn between February and
March 2020, during which time nearly all public schools shifted to remote learning.
12
15. Figure 2: Seasonality in Monthly Trends in Nationwide Search Intensity for School Bullying (Pre-COVID)
0
.5
1
1.5
Log(Search
Intensity)
July Aug Sept Oct Nov Dec Jan Feb Mar Apr May June
(A) Bullying
0
.5
1
1.5
Log(Search
Intensity)
July Aug Sept Oct Nov Dec Jan Feb Mar Apr May June
(B) School Bullying
0
.5
1
1.5
Log(Search
Intensity)
July Aug Sept Oct Nov Dec Jan Feb Mar Apr May June
(C) Cyberbullying
Notes: The figure above shows regression coefficients estimating the difference in the logarithm of monthly search intensity between
July and the other 11 calendar months. Panel A shows search intensity for a composite search term that includes “School Bullying”
and “Cyberbullying.” Panel B shows search intensity for “School Bullying” and panel C shows search intensity for “Cyberbullying.”
The regressions include fixed effects for month (2-12) and year (2016-2019). Also shown are 95 percent confidence intervals calculated
with heteroskedasticity robust standard errors. The sample contains search data from January 2016 through December 2019.
13
16. Figure 3: Relationship Between Overall Bullying in YRBS and Searches for Bullying (Pre-COVID)
14
16
18
20
22
Percentage
of
Students
Bullied
10 20 30 40 50
Search Intensity for Bullying
Notes: The figure above presents the relationship between the proportion of students who were bullied and search intensity in Google
Trends for a composite search term that includes “School Bullying” and “Cyberbullying.” Each circle represents a state, which is
weighted by its 2019 population. Data include the 2013 through 2019 YRBS survey results and Google searches from the same time
period. The population-weighted correlation coefficient is 0.45.
14
17. Figure 4: Nationwide Event Study of Search Intensity for Bullying
-1
-.5
0
.5
Log(search
intensity)
Feb 19 Aug 19 Feb 20 Aug 20 Feb 21
(A) Bullying
-1
-.5
0
.5
Log(search
intensity)
Feb 19 Aug 19 Feb 20 Aug 20 Feb 21
(B) School Bullying
-1
-.5
0
.5
Log(search
intensity)
Feb 19 Aug 19 Feb 20 Aug 20 Feb 21
(C) Cyberbullying
Notes: The figure above shows event study coefficients estimating the difference in the logarithm of monthly search intensity across all
50 U.S., states relative to the same months in prior years. We control for state fixed effects, adjusting for seasonality using fixed effects
for month of year (1-12), and include a linear time trend to control for secular trends over time. Also shown are 95 percent confidence
intervals corresponding to heteroskedasticity robust standard errors clustered by state and month. Panel A shows search intensity for
a composite search term that includes “school bullying” and “cyberbullying.” Panel B shows search intensity for “school bullying”
and panel C shows search intensity for “cyberbullying.” The vertical dashed line is drawn between February and March 2020, during
which time nearly all public schools shifted to remote learning.
15
18. Figure 5: Relationship Between Searches for Bullying and School Instructional Modes (2020-21)
5
10
15
20
25
30
Search
Intensity
for
Bullying
0 20 40 60 80 100
Percent Only Virtual Instruction
(A) Virtual Instruction
5
10
15
20
25
30
Search
Intensity
for
Bullying
0 20 40 60 80 100
Percent Traditional In-person Instruction
(B) In-person Instruction
Notes: The figure above presents the relationship between school instructional modes and search intensity in Google Trends for a
composite search term that includes “school bullying” and “cyberbullying.” Panel A presents this relationship based on the percentage
of schools offering only virtual instruction. Panel B presents this relationship based on the percentage of schools offering only in-
person instruction. Each circle represents a state, which is weighted by its 2019 population. Google searches and data from Burbio on
school instructional modes spans September 2020 to February 2021.
16
19. Table 1: Changes in Search Intensity for Bullying Following Pandemic-Induced Shifts to Remote Learning
Bullying School Bullying Cyberbullying
(1) (2) (3)
(A) Overall Pre-Post Changes
Post COVID -0.318∗∗∗
-0.397∗∗∗
-0.223∗∗
(0.071) (0.068) (0.092)
(B) Changes by Specific Time Periods
Post COVID 19-20 SY (3/20–5/20) -0.388∗∗∗
-0.438∗∗∗
-0.353∗∗∗
(0.091) (0.131) (0.038)
Post COVID Summer 2020 (6/20–8/20) 0.003 -0.117 0.189∗∗
(0.032) (0.090) (0.089)
Post COVID 20-21 SY (9/20–2/21) -0.440∗∗∗
-0.516∗∗∗
-0.361∗∗∗
(0.067) (0.047) (0.108)
(C) Changes by Proportion of Schools In-Person
Proportion of Schools In-Person (9/20–2/21) 0.342∗∗∗
0.309∗∗∗
0.411∗∗∗
(0.102) (0.097) (0.123)
Post COVID 20-21 SY (9/20–2/21) -0.553∗∗∗
-0.618∗∗∗
-0.498∗∗∗
(0.055) (0.042) (0.082)
N 3,100 3,100 3,100
Notes: Heteroskedasticity robust standard errors clustered by state and month are in parentheses (* p<.10 ** p<.05 *** p<.01).
Each column in each panel regresses the logarithm of search intensity for the specific topic. Panel A includes a single indicator for
periods on or after March 2020. Panel B includes a set of three indicator for three distinct post-pandemic time periods: The end of
the spring 2020 semester (March 2020 through May 2020), the summer period in 2020 (June 2020 through August 2020), and finally
the beginning of the 2020–2021 school year (September 2020 through February 2021). Panel C estimates the relationship between
bullying and school instruction mode in the 2020-21 school year using the percentage of schools that are offering full-time in-person
instruction. This measure is collected at the state by month level from September 2020 through February 2021. We control for state
fixed effects in addition to adjusting for seasonality using month fixed effects and a linear time trend. The sample contains search
data from January 2016 through February 2021.
17
20. A Data details
A.1 Google Trends
Our measures of bullying search intensity come from Google Trends, which makes publicly available
monthly internet search behavior both nationally and by state. The publicly available measure of search be-
havior for a given term or topic is “search intensity”, which calculates the fraction of a given area’s Google
searches devoted to that term or topic. Raw search volume and raw search intensity are not available. In-
stead, Google Trends normalizes measures of search intensity to allow for comparison of relative intensity
over time and across states. Each monthly measure of search intensity for a given term or topic in a state is
divided by the total searches in that same state and month. The resulting raw measure of search intensity
is therefore scaled on a range of 0 to 100 based on a term’s proportion to all searches on all terms.
We then compare the relative intensity across keywords to re-normalize them so that each monthly
measure can be compared across terms, geography, and time. Given the challenge of interpreting such
magnitudes, we often use the logarithm of search intensity so that estimates can be interpreted as percent
changes. We implicitly assume increased search intensity for a term or topic corresponds to increased raw
search volume, given evidence that overall Google search volumes did not change substantially during the
pandemic.6
We focus on three primary measures related to online searches for bullying. Our first measure is for the
topic of “School Bullying” and the second measure is for the topic of “Cyberbullying.” The third measure
is the combination of the two terms, which we refer to simply as “Bullying.” In addition to these three
measures based on topics, we also derive three analogous measures based on search terms instead of topics.
Topics represent a group of terms that share the same concept in any language whereas terms include only
the specific term. Searching for the topic of “School Bullying” will include results that not only include the
phrase “School Bullying” but also similar keywords in English and other languages.7
6One private firm, Statista, estimates that monthly US-based Google search volumes were 12.7 billion in April 2020, compared to
11.9 in January 2020, and that such search volumes have held fairly steady between 10 and 13 billion since 2015. See “Number of
explicit core search queries powered by search engines in the United States as of April 2020”, accessed at https://www.statista.
com/statistics/265796/us-search-engines-ranked-by-number-of-core-searches through the Wayback Machine’s
July 17, 2020 archive.
7Though it is impossible to determine the precise list of keywords included in each topic, Google Trends provides the following
illustrative example: If you search the topic ”London,” your search includes results for topics such as: “Capital of the UK” and
“Londres,” which is “London” in Spanish.
18
21. A.2 Youth Risk Behavior Survey
To evaluate the predictive validity of Google searches for bullying, school bullying, and cyberbullying in
the pre-pandemic period, we rely on survey data from the YRBS between 2013 and 2019. The YRBS is con-
ducted by the Centers for Disease Control and Prevention (CDC) in partnership with state health agencies
every two years to measure health behaviors and experiences among high school students in each state.
Questions focus on four main areas: Health behaviors and experiences related to sexual behavior, high-
risk substance use, violence victimization, and mental health and suicide. The survey is self-administered
anonymously by using a computer-scannable questionnaire booklet and takes one class period (approxi-
mately 45 minutes) to complete.
We use responses from the four most recent biennial surveys prior the pandemic (i.e., 2013, 2015, 2017,
2019) and focus on two bullying-related questions: “During the past 12 months, have you ever been bullied
on school property?” and “During the past 12 months, have you ever been electronically bullied?” We ag-
gregate individual responses to these questions using state sampling weights to generate measures that are
representative of high school population in each state in each year.8
Therefore, the first question measures
the fraction of each state’s high school population who indicated that they were bullied in school and the
second question measures the fraction of each state’s high school population that was bullied online.
A.3 Burbio
Over the course of the pandemic, the private firm Burbio has regularly tracked the learning modes of over
1,200 school districts representing over 35,000 schools in 50 states.9
Burbio checks school district websites,
Facebook pages, local news stories and other publicly available information to determine which learning
mode currently in place. School districts are checked every 72 hours for updates and Burbio generates an
updated database of school instructional modes once a week.
School district learning modes are categorized as either traditional, hybrid or virtual. “Traditional”
refers to students attending in-person every day. “Hybrid” refers to students being divided into cohorts and
attending 2-3 days in-person and 2-3 days virtually. “Virtual” refers to students learning entirely remotely.
Burbio to each district a learning mode based on the most in-person option available to the general student
population. A district offering both traditional and virtual options would be categorized as “traditional”.
If learning modes vary by grade, districts are assigned a value proportional to the fraction of grades using
8For more information, see Underwood et al. (2020).
9For details about how the sample of districts is constructed, see https://about.burbio.com/methodology/.
19
22. that learning mode. For example, if grades K-5 are traditional and grades 6-12 are virtual, the district would
be labeled as 46 percent traditional and 54 percent virtual.
Burbio then aggregates those district fractions traditional, hybrid and virtual up to the county level by
weighting each district by its student enrollment. We then further aggregate those county numbers up to
the state level, again weighting by county-level student enrollment. The final result is a weekly state-level
data set with the fraction of schools (or school grades) offering various learning modes.
20
23. B Regression analysis details
We estimate changes in search intensity for bullying following COVID-19 using both a month-by-month
event study specification and a before-after specification. Before conducting these analyses, we first remove
seasonality and secular time trends from our search intensity measures. Searches for bullying typically peak
in the beginning of the school year and fall substantially during the summer months. Because COVID-
19substantially disrupted these natural rhythms in search intensity, we adjust for seasonality and secular
time trends using only the data from the pre-pandemic sample period, which avoids potentially over-
correcting for seasonality due to pandemic-induced changes. We therefore generate residuals for the natural
logarithm of search intensity in each state s in time period t as follows:
Log(SearchIntensityst) = β1Y ear + µm(t) + εt, (1)
where µm(t) indicates a set of 12 fixed effects for the month of year (i.e., 1 through 12), and β1 captures any
secular time trends in the years before COVID-19 (i.e., 2016 through 2019). We then remove these monthly
effects and the linear time trend from searches over the full sample period by extrapolating these effects to
the post-pandemic period. Let Log(SearchIntensity∗
st) denote this adjusted measure, which accounts for
seasonal fluctuations and secular trends. Using this adjusted, we then fit our event study as follows:
Log(SearchIntensity∗
st) =
−1
X
t=−12
βt Beforet +
11
X
t=1
βt Aftert + αPriorY earst + Γs + εt. (2)
We regress the adjusted logarithm of search intensity for state s in time t on a vector of month indicators
t. Here, t indicates the event month, which identifies months relative to February 2020, which was the last
month before states began closing schools. Before and After are indicators for month t falling before or
after February 2020. Note that by adjusting SearchIntensity∗
st for month of year m(t) (i.e., 1 through 12)
and time trends, coefficients βt can be interpreted as differences in search intensity compared to the same
months in prior years. Exclusion of the February 2020 indicator, and inclusion of state fixed effects (Γs) and
a PriorY ears indicator for months between January 2016 and January 2019, means the coefficients βt can
be interpreted as month t’s deviation from calendar-predicted search intensity relative to February 2020 in
state s.
The nationwide before-after specification replaces the vector of weekly pre- and post-pandemic indica-
21
24. tors with a single post-pandemic indicator as follows:
Log(SearchIntensity∗
st) = βPostCOV IDt + Γs + εt. (3)
Again, by adjusting for calendar effects and including state fixed effects, β can be interpreted as the overall
post-pandemic change in search intensity compared to those same weeks in state s in prior years. In the first
before-after specifications, we simply include one indicator for the entire sample period following COVID-
19 (i.e, March 2020 through February 2021).10
This difference-in-difference estimator β from Equation 3 is
the average of the March 2020 through January 2021 event study coefficients β1 through β11 from Equation
2.
We then modify the specification described in Equation 2 to separately examine three distinct time peri-
ods: the end of the spring 2020 school year (March 2020 through May 2020), the summer of 2020 (June 2020
through August 2020), and the first half of the 2020-2021 school year (Sept 2020 through February 2021). We
do so by replacing PostCOV IDt in Equation 2 with three separate indicators corresponding to each time
period:
Log(SearchIntensity∗
st) = β1PostSpringt + β2PostSummert + β3PostFallt + Γs + εt. (4)
Finally, to study how search intensity changed differentially by states’ school instructional modes, we
modify Equation 4 by interacting the PostFallt indicator with a measure of the percentage of schools that
offered in-person instruction in state s during the first half of the 2020-2021 school year (InPersons):
Log(SearchIntensity∗
st) = β1PostSpringt+β2PostSummert+β3PostFallt+β4(PostFallt)∗(InPersons)+Γs+εt.
(5)
All regressions use standard errors clustered by state and week and are weighted by state population to
be nationally representative at the individual level.
10See Table C.2 for a list of state-by-state school closure dates, which all begin in March 2020.
22
26. Figure C.1: Relationship Between Bullying in YRBS and Search Intensity for Bullying
15
20
25
Percentage
of
Students
Bullied
in
School
10 15 20 25
Search Intensity for School Bullying
(A) School Bullying
12
14
16
18
20
Percentage
of
Students
Bullied
Online
5 10 15 20 25
Search Intensity for Cyberbullying
(B) Cyberbullying
Notes: The figure above presents the relationship between the percentage of students who were bullied in school (Panel A) or online
(Panel B) and search intensity for “School Bullying” and “Cyberbullying” repsectively. Each circle represents a state, which is weighted
by its 2019 population. Data include the 2013 through 2019 YRBS survey results and Google searches from the same time period. The
population-weighted correlation coefficients are 0.42 for school bullying (Panel A) and 0.42 for cyberbullying (Panel B).
24
27. Figure C.2: Relationship Between Searches for School Bullying and School Instructional Modes (2020-21)
4
6
8
10
12
14
Search
Intensity
for
School
Bullying
0 20 40 60 80 100
Percent Only Virtual Instruction
(A) Virtual Instruction
4
6
8
10
12
14
Search
Intensity
for
School
Bullying
0 20 40 60 80 100
Percent Traditional In-person Instruction
(B) In-person Instruction
Notes: The figure above presents the relationship between school instructional modes and search intensity in Google Trends for “school
bullying.” Panel A presents this relationship based on the percentage of schools offering only virtual instruction. Panel B presents this
relationship based on the percentage of schools offering only in-person instruction. Each circle represents a state, which is weighted
by its 2019 population. Google searches and data from Burbio on school instructional modes spans September 2020 to February 2021.
25
28. Figure C.3: Relationship Between Searches for Cyberbullying and School Instructional Modes (2020-21)
0
5
10
15
Search
Intensity
for
School
Bullying
0 20 40 60 80 100
Percent Only Virtual Instruction
(A) Virtual Instruction
0
5
10
15
Search
Intensity
for
School
Bullying
0 20 40 60 80 100
Percent Traditional In-person Instruction
(B) In-person Instruction
Notes: The figure above presents the relationship between school instructional modes and search intensity in Google Trends for “cyber-
bullying.” Panel A presents this relationship based on the percentage of schools offering only virtual instruction. Panel B presents this
relationship based on the percentage of schools offering only in-person instruction. Each circle represents a state, which is weighted
by its 2019 population. Google searches and data from Burbio on school instructional modes spans September 2020 to February 2021.
26
29. Table C.1: Relationship Between Bullying and Student Reports of Hopelessness and Suicidal Ideation
Sad or Considered Attempted
Hopeless Suicide Suicide
(1) (2) (3)
Bullied 0.287∗∗∗
0.223∗∗∗
0.123∗∗∗
(0.001) (0.001) (0.001)
BMI Index 0.003∗∗∗
0.002∗∗∗
0.002∗∗∗
(0.000) (0.000) (0.000)
Overweight 0.014∗∗∗
0.012∗∗∗
0.003∗
(0.002) (0.002) (0.002)
Obese 0.014∗∗∗
0.015∗∗∗
-0.002
(0.003) (0.003) (0.002)
Female 0.151∗∗∗
0.075∗∗∗
0.024∗∗∗
(0.001) (0.001) (0.001)
Ameircan Indian / Alaska Native 0.003 -0.009∗∗
0.036∗∗∗
(0.005) (0.004) (0.004)
Asian -0.065∗∗∗
-0.055∗∗∗
-0.024∗∗∗
(0.003) (0.003) (0.003)
Black -0.049∗∗∗
-0.049∗∗∗
0.010∗∗∗
(0.003) (0.002) (0.003)
Hispanic / Latino 0.016∗∗∗
-0.030∗∗∗
0.006∗∗∗
(0.003) (0.002) (0.002)
Native Hawaiian / other PI -0.013∗∗∗
-0.027∗∗∗
0.032∗∗∗
(0.005) (0.004) (0.004)
White -0.066∗∗∗
-0.053∗∗∗
-0.035∗∗∗
(0.002) (0.002) (0.002)
Year Fixed Effects Yes Yes Yes
Grade Fixed Effects Yes Yes Yes
N 655,384 596,497 432,681
Notes: Heteroskedasticity robust standard errors are in parentheses (* p<.10 ** p<.05 *** p<.01). Each column in each panel re-
gresses an indicator of whether a student indicated feeling sad or hopeless (Column 1), considered suicide (Column 2), or attempted
suicide (Column 3). In addition to the controls presented, we include fixed effects for year and grade. The sample contains data
from students who completed the YRBS survey from 2013 thorough 2019.
27
30. Table C.2: School Closure Dates by State
Legal State closure Date closed Public school
State status start date for the year enrollment
Alabama Ordered March 19 April 6 744,930
Alaska Ordered March 16 April 9 132,737
Arizona Ordered March 16 March 30 1,123,137
Arkansas Ordered March 17 April 6 493,447
California Recommended March 19 April 1 6,309,138
Colorado Ordered March 23 April 20 905,019
Connecticut Ordered March 17 May 5 535,118
Delaware Ordered March 16 April 24 136,264
District of Columbia Ordered March 16 April 17 85,850
Florida Recommended March 16 April 18 2,816,791
Georgia Ordered March 18 April 1 1,764,346
Hawaii Ordered March 23 April 17 181,550
Idaho Recommended March 24 April 6 297,200
Illinois Ordered March 17 April 17 2,026,718
Indiana Ordered March 20 April 2 1,049,547
Iowa Ordered March 16 April 17 509,831
Kansas Ordered March 18 March 17 494,347
Kentucky Recommended March 16 April 20 684,017
Louisiana Ordered March 16 April 15 716,293
Maine Recommended March 16 March 31 180,512
Maryland Ordered March 16 May 6 886,221
Massachusetts Ordered March 17 April 21 964,514
Michigan Ordered March 16 April 2 1,528,666
Minnesota Ordered March 18 April 23 875,021
Mississippi Ordered March 20 April 14 483,150
Missouri Ordered March 23 April 9 915,040
Montana Closure expired March 16 n/a 146,375
Nebraska Ordered March 23 April 3 319,194
Nevada Ordered March 16 April 21 473,744
New Hampshire Ordered March 16 April 16 180,888
New Jersey Ordered March 18 May 4 1,410,421
New Mexico Ordered March 16 March 26 336,263
New York Ordered March 18 May 1 2,729,776
North Carolina Ordered March 16 April 24 1,550,062
North Dakota Ordered March 16 May 1 109,706
Ohio Ordered March 17 April 20 1,710,143
Oklahoma Ordered March 17 March 25 693,903
Oregon Ordered March 16 April 8 606,277
Pennsylvania Ordered March 16 April 9 1,727,497
Puerto Rico Ordered March 16 April 24 365,181
Rhode Island Ordered March 23 April 23 142,150
South Carolina Ordered March 16 April 22 771,250
South Dakota Recommended March 16 April 6 136,302
Tennessee Recommended March 20 April 15 1,001,562
Texas Ordered March 23 April 17 5,360,849
Utah Ordered March 16 April 14 659,801
Vermont Ordered March 18 March 26 88,428
Virginia Ordered March 16 March 23 1,287,026
Washington Ordered March 17 April 6 1,101,711
West Virginia Ordered March 16 April 21 273,855
Wisconsin Ordered March 18 April 16 864,432
Wyoming Closure expired March 16 n/a 94,170
Notes: Data come from Education Week’s “Coronavirus and School Closures” website, last updated on May 15, 2020. All closure
dates refer to 2020.
28
31. Table C.3: Correlations Coefficients of State-level YRBS and Google Trends Measures of Bullying
YRBS YRBS YRBS Google Google Google
Overall School Cyber Overall School Cyber
Bullying Bullying Bullying Bullying Bullying Bullying
(1) (2) (3) (4) (5) (6)
YRBS Overall Bullying 1.000
YRBS School Bullying 0.982 1.000
(0.000)
YRBS Cyberbullying 0.973 0.913 1.000
(0.000) (0.000)
Google Overall Bullying 0.445 0.437 0.432 1.000
(0.003) (0.003) (0.003)
Google School Bullying 0.430 0.415 0.423 0.957 1.000
(0.004) (0.006) (0.004) (0.000)
Google Cyber Bullying 0.442 0.439 0.422 0.979 0.889 1.000
(0.003) (0.003) (0.004) (0.000) (0.000)
Notes: P-values in parentheses. Data are at the state level and weighted by each state’s 2019 population. Data include the 2013
through 2019 YRBS survey results and Google searches from the same time period.
29
32. Suggested Citation: Bacher-Hicks, A., Goodman, J., Greif Green, J., Hold, M.K. (2021). The COVID-19
Pandemic Disrupted Both School Bullying and Cyberbullying (Working Paper 2021-8). Wheelock Educational
Policy Center. Available at wheelockpolicycenter.org.
OUR MISSION
The Wheelock Educational Policy Center (WEPC) conducts and disseminates rigorous, policy-relevant education research in
partnership with local, state, and federal policymakers and stakeholders to improve pk-20 educational opportunities and holistic
outcomes for underserved students.
www.wheelockpolicycenter.org
wheelockpolicy@bu.edu