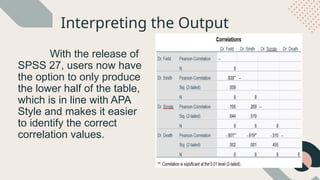
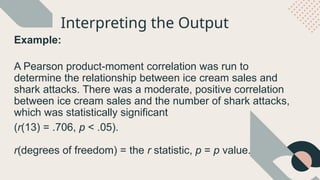
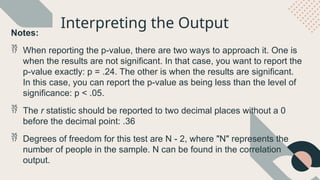
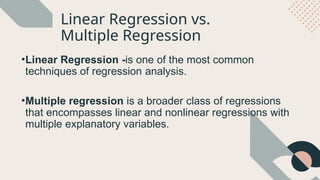
CORRELATIONAL
RESEARCH
Prepared and Presented by:
Jhe Kent H. Sallegue
Correlational Research
Correlational research is a type of non-experimental
research method in which a researcher measures two variables
and understands and assesses the statistical relationship between
them with no influence from any extraneous variable. In statistical
analysis, distinguishing between categorical data and numerical
data is essential, as categorical data involves distinct categories or
labels, while numerical data consists of measurable quantities.
Positive Correlation
01
No Correlation
02 Negative Correlation
03
Types of Correlational Research
Mainly three types of correlational research have been identified:
Non-experimental
01
Dynamic
02 Backward-looking
03
Characteristics of Correlational Research
Correlational research has three main characteristics, they are:
Person’s r
The Pearson correlation is appropriate when
both variables being compared are of a continuous
level of measurement (interval or ratio). Use the Levels
of Measurement tab to learn more about determining
the appropriate level of measurement for your
variables.
•Independence of cases
•Linearity
•No significant outline
•Homoscedacticity
Assumptions
•Analyze > Correlate > Bivariate
•Move variables of interest into the "Variables" box
(they must be scale variables)
•Select "Pearson" as the test.
•You may use the "Options" button to select
descriptive statistics you wish to include as well.
•Click "OK" to run the test.
Running Pearson Correlation in SPSS
Interpreting the Output
The results will
generate in a matrix. You can
ignore any boxes that show a "1"
as the correlation value as these
are simply the variable correlated
with itself. These values will form
a diagonal across the matrix that
can be used to help you focus on
the correct values. You only need
to explore the correlation
values on half of the matrix. APA
Style uses the bottom half.
Interpreting the Output
With the release of
SPSS 27, users now have
the option to only produce
the lower half of the table,
which is in line with APA
Style and makes it easier
to identify the correct
correlation values.
Interpreting the Output
Example:
A Pearson product-moment correlation was run to
determine the relationship between ice cream sales and
shark attacks. There was a moderate, positive correlation
between ice cream sales and the number of shark attacks,
which was statistically significant
(r(13) = .706, p < .05).
r(degrees of freedom) = the r statistic, p = p value.
Interpreting the Output
Notes:
 When reporting the p-value, there are two ways to approach it. One is
when the results are not significant. In that case, you want to report the
p-value exactly: p = .24. The other is when the results are significant.
In this case, you can report the p-value as being less than the level of
significance: p < .05.
 The r statistic should be reported to two decimal places without a 0
before the decimal point: .36
 Degrees of freedom for this test are N - 2, where "N" represents the
number of people in the sample. N can be found in the correlation
output.
Linear Regression vs.
Multiple Regression
•Linear Regression -is one of the most common
techniques of regression analysis.
•Multiple regression is a broader class of regressions
that encompasses linear and nonlinear regressions with
multiple explanatory variables.
There are several main reasons people use
regression analysis:
1. To predict future economic conditions, trends, or
values
2. To determine the relationship between two or more
variables
3. To understand how one variable changes when
another changes
Linear Regression
Also called simple regression, linear regression
establishes the relationship between two variables. Linear
regression is graphically depicted using a straight line with the
slope defining how the change in one variable impacts a
change in the other. The y-intercept of a linear regression
relationship represents the value of one variable when the
value of the other is 0.
For example, in the linear regression formula of y = 3x + 7,
there is only one possible outcome of 'y' if 'x' is defined as 2.
Multiple Regression
For complex connections between data, the
relationship might be explained by more than one
variable. In this case, an analyst uses multiple regression
which attempts to explain a dependent variable using
more than one independent variable.
There are two main uses for Multiple
Regression Analysis
1. Determine the dependent variable based on multiple
independent variables.
2. Determine how strong the relationship is between
each variable.
TAKE NOTE:
A company can not only use regression
analysis to understand certain situations, like
why customer service calls are dropping, but
also to make forward-looking predictions, like
sales figures in the future.
Linear Regression vs.
Multiple Regression Example
Daily Change in Stock Price = (Coefficient)(Daily Change in Trading
Volume) + (y-intercept)
If the stock price increases $0.10 before any trades occur and increases $0.01
for every share sold, the linear regression outcome is:
Daily Change in Stock Price = ($0.01)(Daily Change in Trading Volume) +
$0.10
However, the analyst realizes there are several other factors to consider including
the company's P/E ratio, dividends, and prevailing inflation rate. The analyst can
perform multiple regression to determine which—and how strongly—each of
these variables impacts the stock price:
Daily Change in Stock Price = (Coefficient)(Daily Change in Trading
Volume) + (Coefficient)(Company's P/E Ratio) + (Coefficient)(Dividend) +
(Coefficient)(Inflation Rate)
Thank you!
Jhe Kent H. Sallegue

Correlational Research.pptx Correlational Research.pptx

  • 1.
  • 2.
    Correlational Research Correlational researchis a type of non-experimental research method in which a researcher measures two variables and understands and assesses the statistical relationship between them with no influence from any extraneous variable. In statistical analysis, distinguishing between categorical data and numerical data is essential, as categorical data involves distinct categories or labels, while numerical data consists of measurable quantities.
  • 3.
    Positive Correlation 01 No Correlation 02Negative Correlation 03 Types of Correlational Research Mainly three types of correlational research have been identified:
  • 4.
    Non-experimental 01 Dynamic 02 Backward-looking 03 Characteristics ofCorrelational Research Correlational research has three main characteristics, they are:
  • 5.
    Person’s r The Pearsoncorrelation is appropriate when both variables being compared are of a continuous level of measurement (interval or ratio). Use the Levels of Measurement tab to learn more about determining the appropriate level of measurement for your variables.
  • 6.
    •Independence of cases •Linearity •Nosignificant outline •Homoscedacticity Assumptions
  • 7.
    •Analyze > Correlate> Bivariate •Move variables of interest into the "Variables" box (they must be scale variables) •Select "Pearson" as the test. •You may use the "Options" button to select descriptive statistics you wish to include as well. •Click "OK" to run the test. Running Pearson Correlation in SPSS
  • 8.
    Interpreting the Output Theresults will generate in a matrix. You can ignore any boxes that show a "1" as the correlation value as these are simply the variable correlated with itself. These values will form a diagonal across the matrix that can be used to help you focus on the correct values. You only need to explore the correlation values on half of the matrix. APA Style uses the bottom half.
  • 9.
    Interpreting the Output Withthe release of SPSS 27, users now have the option to only produce the lower half of the table, which is in line with APA Style and makes it easier to identify the correct correlation values.
  • 10.
    Interpreting the Output Example: APearson product-moment correlation was run to determine the relationship between ice cream sales and shark attacks. There was a moderate, positive correlation between ice cream sales and the number of shark attacks, which was statistically significant (r(13) = .706, p < .05). r(degrees of freedom) = the r statistic, p = p value.
  • 11.
    Interpreting the Output Notes: When reporting the p-value, there are two ways to approach it. One is when the results are not significant. In that case, you want to report the p-value exactly: p = .24. The other is when the results are significant. In this case, you can report the p-value as being less than the level of significance: p < .05.  The r statistic should be reported to two decimal places without a 0 before the decimal point: .36  Degrees of freedom for this test are N - 2, where "N" represents the number of people in the sample. N can be found in the correlation output.
  • 12.
    Linear Regression vs. MultipleRegression •Linear Regression -is one of the most common techniques of regression analysis. •Multiple regression is a broader class of regressions that encompasses linear and nonlinear regressions with multiple explanatory variables.
  • 13.
    There are severalmain reasons people use regression analysis: 1. To predict future economic conditions, trends, or values 2. To determine the relationship between two or more variables 3. To understand how one variable changes when another changes
  • 14.
    Linear Regression Also calledsimple regression, linear regression establishes the relationship between two variables. Linear regression is graphically depicted using a straight line with the slope defining how the change in one variable impacts a change in the other. The y-intercept of a linear regression relationship represents the value of one variable when the value of the other is 0. For example, in the linear regression formula of y = 3x + 7, there is only one possible outcome of 'y' if 'x' is defined as 2.
  • 15.
    Multiple Regression For complexconnections between data, the relationship might be explained by more than one variable. In this case, an analyst uses multiple regression which attempts to explain a dependent variable using more than one independent variable.
  • 16.
    There are twomain uses for Multiple Regression Analysis 1. Determine the dependent variable based on multiple independent variables. 2. Determine how strong the relationship is between each variable.
  • 17.
    TAKE NOTE: A companycan not only use regression analysis to understand certain situations, like why customer service calls are dropping, but also to make forward-looking predictions, like sales figures in the future.
  • 18.
    Linear Regression vs. MultipleRegression Example Daily Change in Stock Price = (Coefficient)(Daily Change in Trading Volume) + (y-intercept) If the stock price increases $0.10 before any trades occur and increases $0.01 for every share sold, the linear regression outcome is: Daily Change in Stock Price = ($0.01)(Daily Change in Trading Volume) + $0.10 However, the analyst realizes there are several other factors to consider including the company's P/E ratio, dividends, and prevailing inflation rate. The analyst can perform multiple regression to determine which—and how strongly—each of these variables impacts the stock price: Daily Change in Stock Price = (Coefficient)(Daily Change in Trading Volume) + (Coefficient)(Company's P/E Ratio) + (Coefficient)(Dividend) + (Coefficient)(Inflation Rate)
  • 19.