Download as PDF, PPTX

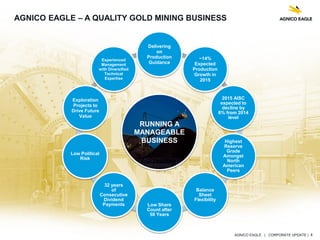
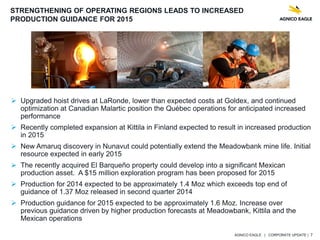
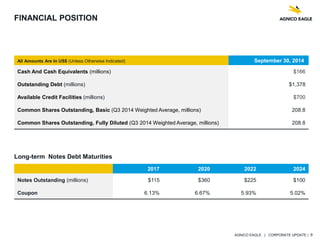
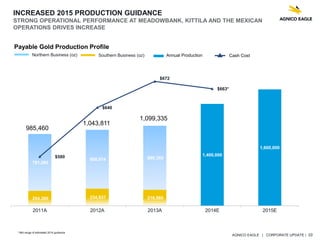
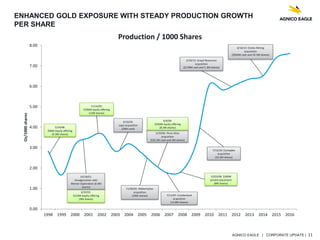
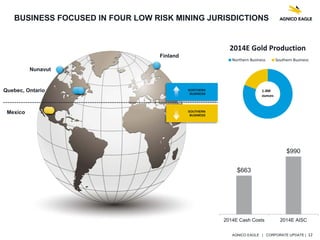


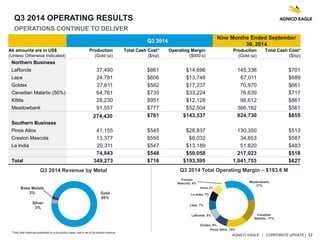

Agnico Eagle provided a corporate update for January 2015 including the following key points: - 2015 gold production is expected to increase 14% to approximately 1.6 million ounces compared to 2014, driven by higher production at Meadowbank, Kittila, and Mexican operations. Total cash costs per ounce are expected to decline 6% from 2014. - The company has manageable expansion capital requirements with projects like the Kittila plant expansion and Pinos shaft completion expected to increase production capacity. - Agnico Eagle has financial flexibility with a net debt of $1.2 billion and $700 million in undrawn credit lines to fund future growth.


