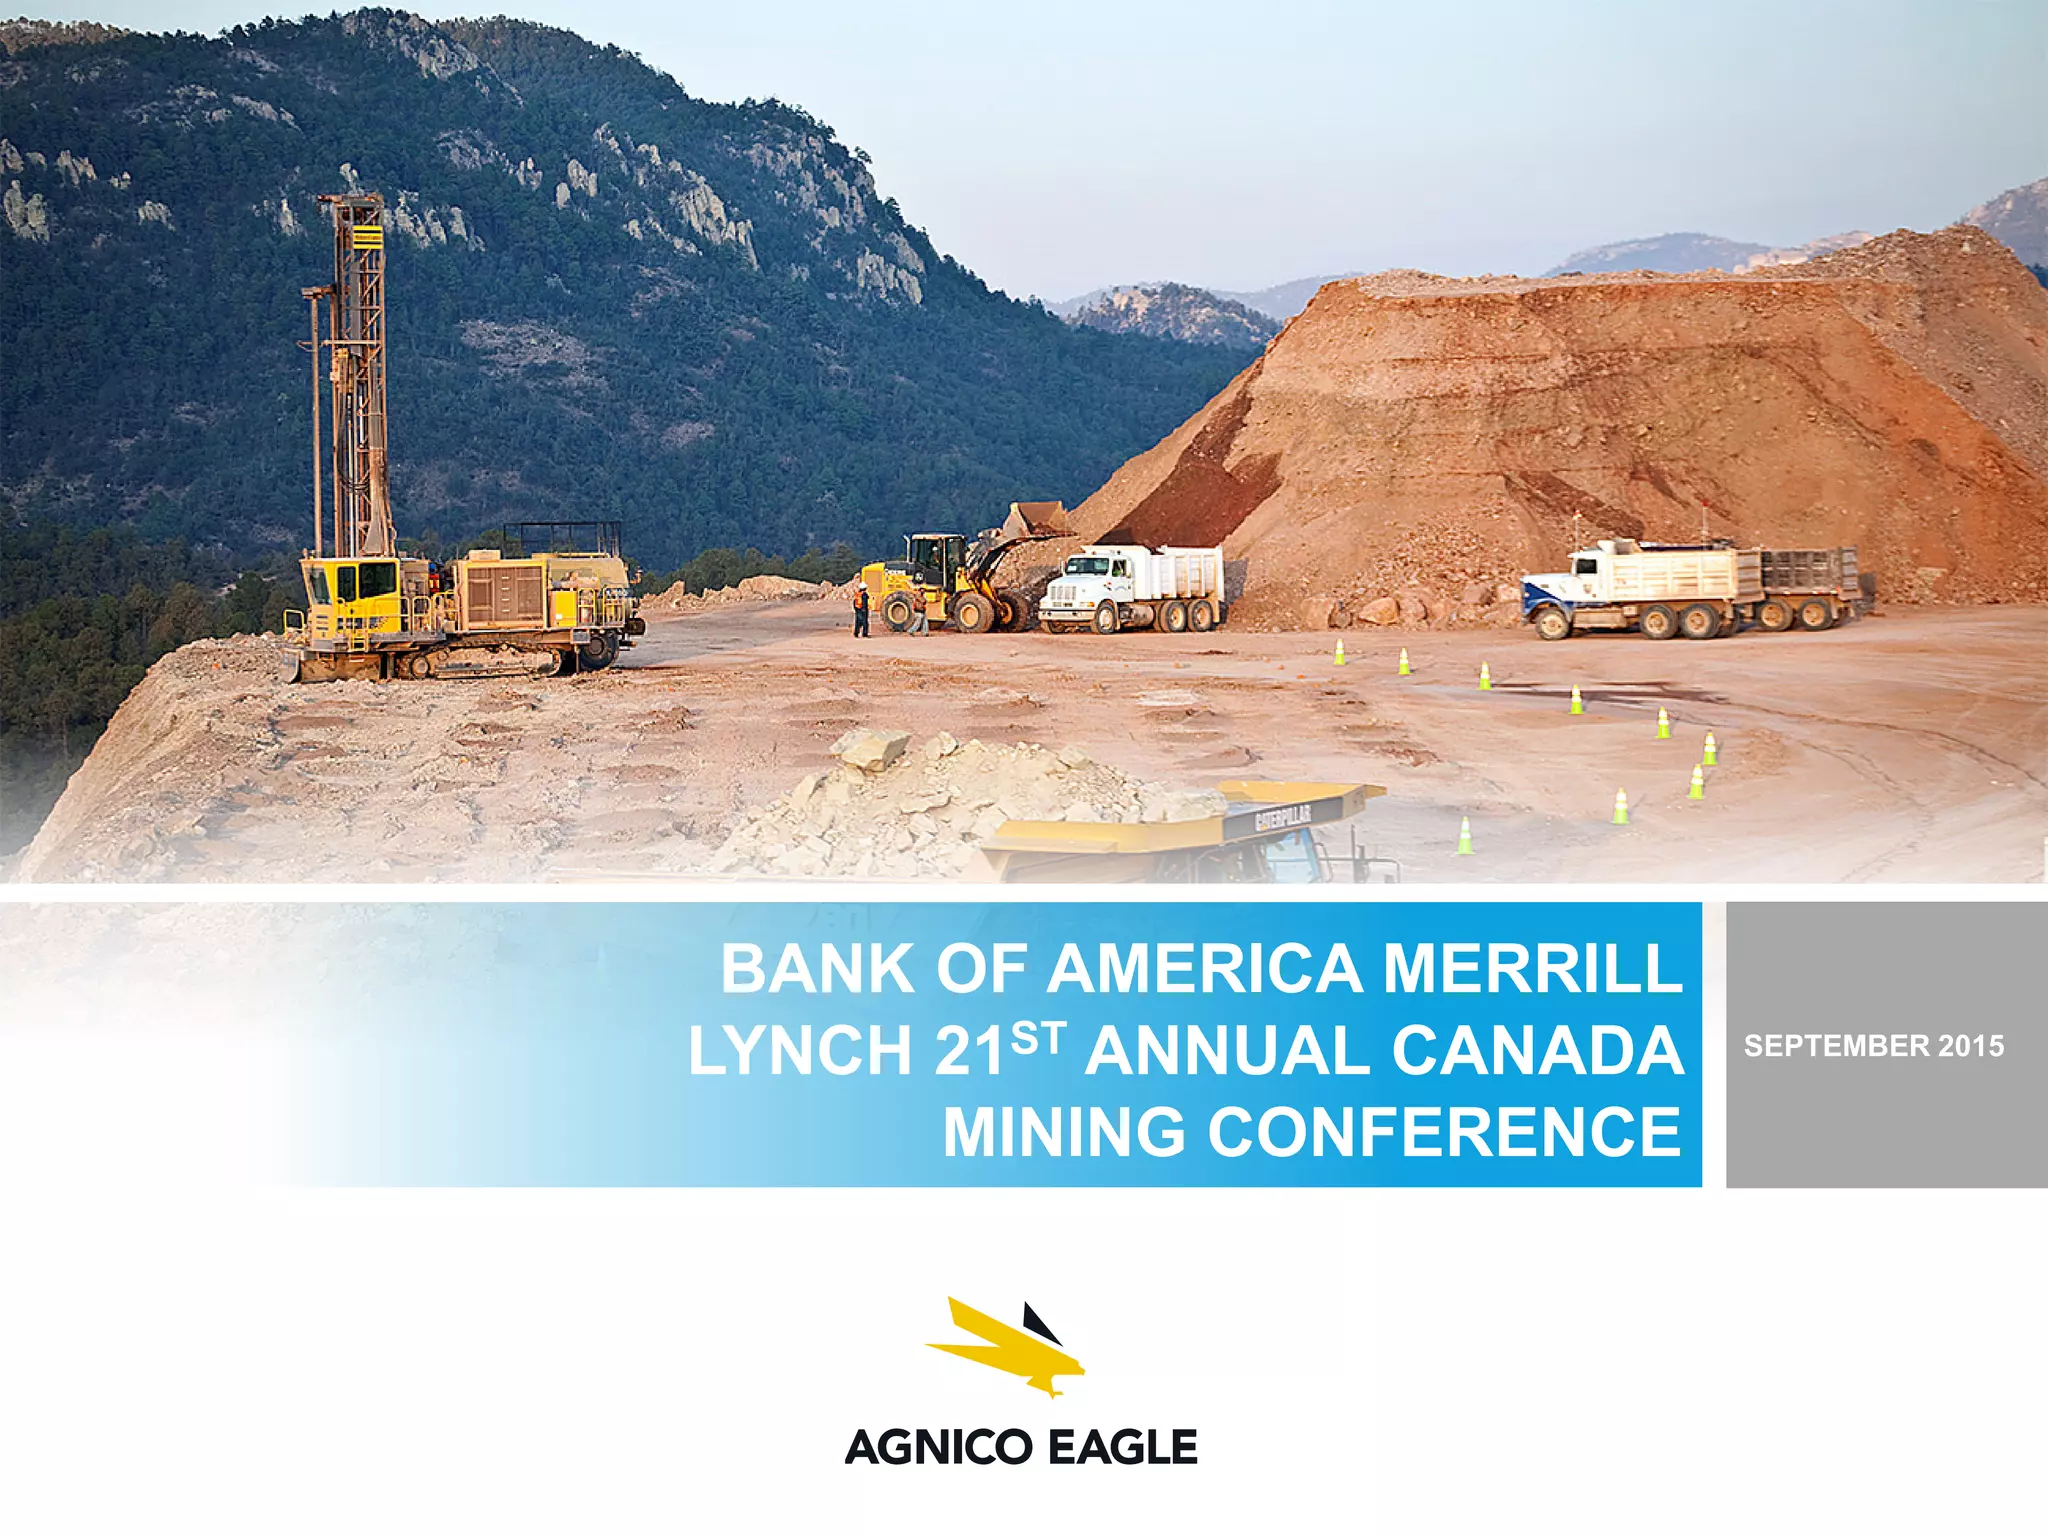
BANK OF AMERICA MERRILL
LYNCH 21ST ANNUAL CANADA
MINING CONFERENCE
SEPTEMBER 2015
AGNICO EAGLE | BAML 21ST ANNUAL CANADA MINING CONFERENCE | 2
Forward-Looking Statements
The information in this presentation has been prepared as at September 10, 2015. Certain statements contained in this document constitute “forward-looking
statements” within the meaning of the United States Private Securities Litigation Reform Act of 1995 and “forward-looking information” under the provisions of
Canadian provincial securities laws and are referred to herein as “forward-looking statements”. When used in this document, the words “expect”, “estimate”,
“forecast”, “will”, “planned” and similar expressions are intended to identify forward-looking statements. Such statements include without limitation: the Company's
forward-looking production guidance, including estimated ore grades, project timelines, drilling results, metal production, mine estimates horizons, production, total
cash costs per ounce, minesite costs per tonne; all-in sustaining costs and cash flows; the estimated timing and conclusions of technical reports and other studies;
the methods by which ore will be extracted or processed; statements concerning expansion projects, recovery rates, mill throughput, and projected exploration
expenditures, including costs and other estimates upon which such projections are based; estimates of depreciation expense, general and administrative expense
and tax rates; the impact of maintenance shutdowns; statements regarding timing and amounts of capital expenditures and other assumptions; estimates of future
reserves, resources, mineral production, optimization efforts and sales; estimates of mine life; estimates of future mining costs, total cash costs, minesite costs, all-in
sustaining costs and other expenses; estimates of future capital expenditures and other cash needs, and expectations as to the funding thereof; statements and
information as to the projected development of certain ore deposits, including estimates of exploration, development and production and other capital costs, and
estimates of the timing of such exploration, development and production or decisions with respect to such exploration, development and production; estimates of
reserves and resources, and statements and information regarding anticipated future exploration; the anticipated timing of events with respect to the Company’s
mine sites and statements and information regarding the sufficiency of the Company’s cash resources and other statements and information regarding anticipated
trends with respect to the Company's operations, exploration and the funding thereof. Such statements and information reflect the Company’s views as at the date
of this document and are subject to certain risks, uncertainties and assumptions, and undue reliance should not be placed on such statements and information.
Forward-looking statements are necessarily based upon a number of factors and assumptions that, while considered reasonable by Agnico Eagle as of the date of
such statements, are inherently subject to significant business, economic and competitive uncertainties and contingencies. The material factors and assumptions
used in the preparation of the forward-looking statements contained herein, which may prove to be incorrect, include, but are not limited to, the assumptions set
forth herein and in management's discussion and analysis (“MD&A”) and the Company's Annual Information Form (“AIF”) for the year ended December 31, 2014
filed with Canadian securities regulators and that are included in its Annual Report on Form 40-F for the year ended December 31, 2014 (“Form 40-F”) filed with the
U.S. Securities and Exchange Commission (the “SEC”) as well as: that there are no significant disruptions affecting operations; that production, permitting and
expansion at each of Agnico Eagle's properties proceeds on a basis consistent with current expectations and plans; that the relevant metals prices, exchange rates
and prices for key mining and construction supplies will be consistent with Agnico Eagle's expectations; that Agnico Eagle's current estimates of mineral reserves,
mineral resources, mineral grades and metal recovery are accurate; that there are no material delays in the timing for completion of ongoing growth projects; that
the Company's current plans to optimize production are successful; and that there are no material variations in the current tax and regulatory environment. Many
factors, known and unknown could cause the actual results to be materially different from those expressed or implied by such forward-looking statements and
information. Such risks include, but are not limited to: the volatility of prices of gold and other metals; uncertainty of mineral reserves, mineral resources, mineral
grades and mineral recovery estimates; uncertainty of future production, capital expenditures, and other costs; currency fluctuations; financing of additional capital
requirements; cost of exploration and development programs; mining risks; community protests; risks associated with foreign operations; governmental and
environmental regulation; the volatility of the Company’s stock price; and risks associated with the Company’s by-product metal derivative strategies. For a more
detailed discussion of such risks and other factors that may affect the Company’s ability to achieve the expectations set forth in the forward-looking statements
contained in this document, see the AIF and MD&A filed on SEDAR at www.sedar.com and included in the Form 40-F filed on EDGAR at www.sec.gov, as well as
the Company’s other filings with the Canadian securities regulators and the SEC. The Company does not intend, and does not assume any obligation, to update
these forward-looking statements and information other than as required by law. For a detailed breakdown of the Company’s reserve and resource position see the
Company’s press release dated April 30, 2015.
AGNICO EAGLE | BAML 21ST ANNUAL CANADA MINING CONFERENCE | 3
Notes to Investors
Note Regarding the Use of Non-GAAP Financial Measures
This presentation discloses certain measures, including ‘‘total cash costs per ounce’’,‘‘minesite costs per tonne’’ and “all-in sustaining costs” that are not
recognized measures under IFRS. This data may not be comparable to data presented by other gold producers. For a reconciliation of these measures to the
most directly comparable financial information presented in the consolidated financial statements prepared in accordance with IFRS and for an explanation of how
management uses these measures, see “Non-GAAP Financial Performance Measures” in the MD&A filed on SEDAR at www.sedar.com and included in the Form
6-K filed on EDGAR at www.sec.gov, as well as the Company’s other filings with the Canadian securities regulators and the SEC. Total cash costs per ounce of
gold produced is presented on both a by-product basis (deducting by-product metal revenues from production costs) and co-product basis (before by-product
metal revenues). Total cash costs per ounce of gold produced on a by-product basis is calculated by adjusting production costs as recorded in the consolidated
statements of income (loss) for by-product revenues, unsold concentrate inventory production costs, smelting, refining and marketing charges and other
adjustments, and then dividing by the number of ounces of gold produced. Total cash costs per ounce of gold produced on a co-product basis is calculated in the
same manner as total cash costs per ounce of gold produced on a by-product basis except that no adjustment for by-product metal revenues is made.
Accordingly, the calculation of total cash costs per ounce of gold produced on a co-product basis does not reflect a reduction in production costs or smelting,
refining and marketing charges associated with the production and sale of by-product metals. Total cash costs per ounce of gold produced is intended to provide
information about the cash generating capabilities of the Company’s mining operations. Management also uses these measures to monitor the performance of
the Company’s mining operations. As market prices for gold are quoted on a per ounce basis, using the total cash cost per ounce of gold produced on a by-
product basis measure allows management to assess a mine’s cash generating capabilities at various gold prices. Management is aware that these per ounce
measures of performance can be affected by fluctuations in and exchange rates. and, in the case of total cash costs per ounce of gold produced on a by-product
basis, by-product metal prices. Management compensates for these inherent limitations by using these measures in conjunction with minesite costs per tonne
(discussed below) as well as other data prepared in accordance with IFRS. Management also performs sensitivity analyses in order to quantify the effects of
fluctuating exchange rates and metal prices. This presentation also contains information as to estimated future total cash costs per ounce, all-in sustaining costs
and minesite costs per tonne. The estimates are based upon the total cash costs per ounce, all-in sustaining costs and minesite costs per tonne that the
Company expects to incur to mine gold at its mines and projects and, consistent with the reconciliation of these actual costs referred to above, do not include
production costs attributable to accretion expense and other asset retirement costs, which will vary over time as each project is developed and mined. It is
therefore not practicable to reconcile these forward-looking Non-GAAP financial measures to the most comparable IFRS measure.
Note Regarding Production Guidance
The gold production guidance is based on the Company’s mineral reserves but includes contingencies and assumes metal prices and foreign exchange rates that
are different from those used in the reserve estimates. These factors and others mean that the gold production guidance presented in this presentation does not
reconcile exactly with the production models used to support these mineral reserves.
AGNICO EAGLE | BAML 21ST ANNUAL CANADA MINING CONFERENCE | 4
Agnico Eagle – Running a High Quality, Manageable Business
Quality Reserves
Moderate Balance
Sheet
Declining Operating
Costs – Significant
FX Tailwind
Long Track Record
of Exploration
Success
Assets DeliveringDisciplined Share
Issuance
Project Pipeline
Expected
to Drive Future
Production Growth
Consistent
Dividend Payer
Low Political Risk
Operating Regions
Experienced
Management,
Proven Strategy
A PREMIUM
GOLD COMPANY
AGNICO EAGLE | BAML 21ST ANNUAL CANADA MINING CONFERENCE | 5
H1 2015 Operating Results
Strong production and cost performance
H1 2015
All amounts are in US$
(Unless Otherwise Indicated)
Production
(Gold oz)
Total Cash Cost*
($/oz)
Operating Margin
($000’s)
Northern Business
LaRonde 122,900 $656 $62,813
Lapa 45,370 $615 $26,038
Goldex 55,712 $585 $34,778
Canadian Malartic (50%) 136,334 $621 $79,456
Kittila 86,640 $727 $43,560
Meadowbank 179,799 $672 $96,177
626,755 $653 $342,822
Southern Business
Pinos Altos 100,753 $371 $79,190
Creston Mascota 28,054 $421 $21,377
La India 52,326 $414 $39,424
181,133 $391 $139,991
Total 807,888 $595 $482,813
H1 2015 Total Operating Margin – $482.8 MH1 2015 Revenue by Metal
Meadowbank,
20%
Canadian
Malartic, 17%
Pinos Altos, 17%
LaRonde, 13%
Kittila, 9%
La India, 8%
Goldex, 7%
Lapa, 5%
Creston
Mascota, 4%
*Total cash costs are presented on a by-product basis, that is net of by-product revenue
Gold
95%
Silver
4%
Base Metals
1%
AGNICO EAGLE | BAML 21ST ANNUAL CANADA MINING CONFERENCE | 6
Stable Production and Good Cost Profile
LaRonde, Kittila, La India and Canadian Malartic are key production drivers over the next three years
* Approximate mid range of estimated 2015 cost guidance
294 315 310 310
1,135
1,285 1,290
1,190
1,429
1,600 1,600
1,500
2014A 2015E 2016E 2017E
Payable Gold Production Profile
Northern Business (‘000 oz) Southern Business (‘000 oz)
2014A 2015E
AISC $954 $880*
TCC $637 $610*
AGNICO EAGLE | BAML 21ST ANNUAL CANADA MINING CONFERENCE | 7
Gold Price Remains Strong in Local Currencies
Currency weakness provides strong tailwind
90%
100%
110%
120%
130%
140%
150%
160%
170%
180%
USD Gold CAD Gold EUR Gold MXN Gold
Gold Price in Local Currencies
USD CAD EUR MXN
Jan. 1, 2010 $1,097 $1,155 €766 14,377
MXN
Aug. 28, 2015 $1,134 $1,496 €1,014 18,988
MXN
% Change 3% 30% 32% 32%
Source: Bloomberg
Gold Production (Ozs) Currency Exposure
Currency 2015E Production
(Ozs)
% of Production
CAD 1,100,000 69%
EUR 185,000 12%
MXN 315,000 19%
AGNICO EAGLE | BAML 21ST ANNUAL CANADA MINING CONFERENCE | 8
Solid Financial Flexibility
Improved balance sheet in H1 2015, continued focus on debt reduction
Strong Available Liquidity - $1.0B*
Long-term Debt Maturities
*As at June 30, 2015
 Approximately $179 million of debt
repayments in H1 2015
 Manageable debt repayment schedule
 $1.2 billion of outstanding debt as of
June 30, 2015
 Low share count of 217 million fully
diluted after 58 years of operating
history
$184M
$825M
Cash and cash equivalents Undrawn credit facilities
C$20 C$20
US$115
US$360
US$225
US$100
$0
$50
$100
$150
$200
$250
$300
$350
$400
2016 2017 2020 2022 2024
AGNICO EAGLE | BAML 21ST ANNUAL CANADA MINING CONFERENCE | 9
2.13
1.74 1.89
3.16
6.08
5.82
6.10
6.36
6.67
7.47
0
1
2
3
4
5
6
7
8
2006 2007 2008 2009 2010 2011 2012 2013 2014 2015
Oz/1000shares
Production / 1000 Shares
Rising Production Per Share
AGNICO EAGLE | BAML 21ST ANNUAL CANADA MINING CONFERENCE | 10
Steady Growth in Reserve and Resources per Share
30.95 35.75 39.81 32.82
60.61 57.35
71.00
58.54 62.95
13.52
21.08
21.92 40.27
39.65
56.88
47.32
55.84
70.08
107.93
125.47
124.79
117.98
131.20
110.72
109.08
97.55
93.24
0
50
100
150
200
250
2006 2007 2008 2009 2010 2011 2012 2013 2014
Oz/1000shares
Inferred resources / 1000 Shares M&I resources / 1000 Shares Reserve / 1000 Shares
 Approximately 95% of current reserves estimated to be mineable at cash costs below $950
per ounce
 Reserve sensitivity: A $150 per ounce move in the gold price (all other assumptions
unchanged) results in approximately a 6% change in reserves
AGNICO EAGLE | BAML 21ST ANNUAL CANADA MINING CONFERENCE | 11
Upper Beaver*
Strong Exploration/Development Pipeline Supports Future Growth
Hammond Reef*
El Barqueno
Meliadine
Amaruq
Pinos Altos Satellites
La India Expansion Potential
LaRonde III
Odyssey*
Rimpi and New Parallel Zone
at KittilaPandora*
Goldex Deep
Advanced Exploration Approaching Development
Mine Site –
Expansion/Extension
*50% AEM Ownership
NORTHERN
BUSINESS
AGNICO EAGLE | BAML 21ST ANNUAL CANADA MINING CONFERENCE | 13
PRODUCTION H1 2015 PRODUCTION HIGHLIGHTS
LaRonde
122,900 ozs
at a total cash cost of
$656/oz
 New conveyor and connection to internal ramp at the 281 level
expected to be completed by the end of Q3 2015, which should
improve mining flexibility
 Studies are continuing to assess the potential to extend the reserve
base and carry out mining between the 311 and 371 levels (a depth of
3.1 to 3.7 km below the surface)
Canadian
Malartic GP (50%)
136,334 ozs
at a total cash cost of
$621/oz
 Further optimization initiatives include:
 Improvements to SAG mill liners to reduce number of planned
shutdowns
 Maintaining mining throughput levels at two million tonnes per
month in the higher grade North zone
 Waste rock backfilling of the Gouldie pit to reduce haulage
distances and noise
 Permitting activities for the Barnat Extension and deviation of Highway
117 remain on schedule with receipt of permits expected in late 2016
Goldex
55,712 ozs
at a total cash cost of
$585/oz
 Goldex Deep 1 Project approved for production
 Gold production expected to average >100,000 oz per year through
2024 at an average annual total cash cost per ounce of
approximately $620
Lapa
45,370 ozs
at a total cash cost of
$615/oz
 2015 is the last full year of production based on current mine
plan. Additional exploration drilling is ongoing in the Zulapa Z7 zone
at depth which, if successful, could extend the mine life
Abitibi Region
Solid and growing production base in Quebec
AGNICO EAGLE | BAML 21ST ANNUAL CANADA MINING CONFERENCE | 14
 Approximately 80-85% of ore
now accessed from below level
245
 Three mining horizons now
operational providing improved
access to higher grade reserves
 Annual gold production
expected to reach 350,000 ozs
in 2019
 Exploration is targeting reserve
and resource development from
the 311 to 371 levels (a depth of
3.1 to 3.7 km)
Laronde - Lower Mine Production Increasing
AGNICO EAGLE | BAML 21ST ANNUAL CANADA MINING CONFERENCE | 15
Mine Life Extended Through 2024
 New mining area includes lower part of the
Dx zone and top of the D zone
 Zone developed from current infrastructure,
no change in mining method
 Mining rate expected to be ~6,000 tpd, at an
average grade of 1.69 g/t gold
 Minesite costs per tonne are estimated at
~C$35 to C$40
 Development capital forecast to be ~$135 to
$140 million. Total sustaining capital over the
expected seven year mine life is estimated to
be ~$60 to $70 million
 The advancement of the Deep 1 project also
unlocks significant upside through the
potential for additional mineral resource
conversion in Deep 1, potential for mining at
Deep 2 (below Level 120), and potential to
develop the Akasaba West deposit
Goldex Deep 1 Project
AGNICO EAGLE | BAML 21ST ANNUAL CANADA MINING CONFERENCE | 16
Nunavut – Production, Development And Exploration
Platform supported by logistical centre in the Abitibi
Val d’Or
Meliadine
Meadowbank
Amaruq
AGNICO EAGLE | BAML 21ST ANNUAL CANADA MINING CONFERENCE | 17
EXPLORATION AND DEVELOPMENT HIGHLIGHTS
Meliadine
 Optimization studies continue on the large reserve and resource base at Meliadine
 Inuit impact benefits agreement (IIBA) signed July 2015
 Project on track for a potential late 2019 startup (pending a construction decision), 2015 capital
budget has been increased by $22 million to expand the existing surface and underground
infrastructure, and prepare for the 2016 work program
Amaruq
 35% increase in resources reported in August 2015*. Project now contains 2.0 million ounces of
inferred resources (9.7 million tonnes at 6.47 g/t gold)
 Phase 2 drill program underway to expand and further infill known deposits
 Amaruq could potentially be developed as a satellite to Meadowbank
Nunavut
Arctic platform starting to gain momentum
PRODUCTION H1 2015 PRODUCTION HIGHLIGHTS
Meadowbank
179,799 ozs
at a total cash cost of
$672/oz
 Vault pit expansion extends Meadowbank production to Q3 2018
 Mine life extension expected to shorten potential production gap
associated with the start-up of a possible satellite operation at Amaruq
 Meadowbank 2015 capital budget increased by $27 million to develop
Vault extension (higher deferred stripping and purchase of additional
haul trucks)
*For additional details on the updated Amaruq resource see Presentation Appendix and AEM August 19, 2015 press release
AGNICO EAGLE | BAML 21ST ANNUAL CANADA MINING CONFERENCE | 18
Amaruq Project
Infill drilling results in 35% increase to inferred resources since year-end 2014
Amaruq deposits now host ~2.02 million ounces of inferred gold resources (9.7 million
tonnes at 6.5 g/t)
AGNICO EAGLE | BAML 21ST ANNUAL CANADA MINING CONFERENCE | 19
Grade capped 60 g/t over estimate true width
Amaruq Project – Updated Whale Tail Resource
155 drill holes included in the resource estimation
AMQ15-310
6.7 g/t Au / 32.3 m
AMQ15-296
7.4 g/t Au / 6.0 m
And 9.4 g/t Au / 16.9 m
And 7.2 g/t Au / 6.0 m
AMQ15-280
12.5 g/t Au / 5.8 m
AMQ15-321
5.5 g/t Au / 21.9 m
Incl. 7.9 g/t Au / 7.1 m
AMQ15-291
10.6 g/t Au / 8.7 m
And 6.1 g/t Au / 8.0 m
AMQ15-302
9.3 g/t Au / 4.2 m
AMQ15-262
6.9 g/t Au / 14.2 m
And 5.6 g/t Au / 8.5 m
AMQ15-265
5.5 g/t Au / 15.0 m
And 7.7 g/t Au / 5.6 m
AMQ15-330
10.4 g/t Au / 21.9 m
And 7.5 g/t Au / 3.5 m
And 5.9 g/t Au / 9.1 m
AMQ15-251
5.7 g/t Au / 19.2 m
Incl. 6.5 g/t Au / 14.3 m
AMQ15-311
4.9 g/t Au / 9.2 m
And 10.8 g/t Au / 8.2 m
And 4.9 g/t Au / 7.5 m
AMQ15-289
4.4 g/t Au / 7.7 m
And 10.6 g/t Au / 5.6 m
And 5.9 g/t Au / 45.0 m
Incl. 9.0 g/t Au / 13.0 m
AMQ15-318
5.4 g/t Au / 10.1 m
And 12.6 g/t Au / 6.1 m
7.4 g/t Au / 4.7 m
AMQ15-319
23.9 g/t Au / 4.2 m
AMQ15-345A
10.0 g/t Au / 10.3 m
And 7.6 g/t Au / 28.3 m
And 9.6 g/t Au / 3.5 m
And 5.1 g/t Au / 6.6 m
AMQ15-351
10.8 g/t Au / 6.9 m
Incl. 15.1 g/t Au / 4.2 m
AMQ15-343
10.8 g/t Au / 9.7 m
AMQ15-328
2.8 g/t Au / 38.9 m
Incl. 6.2 g/t Au / 7.6 m
AGNICO EAGLE | BAML 21ST ANNUAL CANADA MINING CONFERENCE | 20Grade capped 60 g/t over estimate true width
Amaruq Project - Phase Two Drilling Underway
AMQ15-310
6.7 g/t Au / 32.3 m
AMQ15-304
4.5 g/t Au / 5.4 m
AMQ15-296
7.4 g/t Au / 6.0 m
And 9.4 g/t Au / 16.9 m
And 7.2 g/t Au / 6.0 m
AMQ15-280
12.5 g/t Au / 5.8 m
AMQ15-321
5.5 g/t Au / 21.9 m
Incl. 7.9 g/t Au / 7.1 m
AMQ15-275
4.6 g/t Au / 4.8 m
AMQ15-291
10.6 g/t Au / 8.7 m
And 6.1 g/t Au / 8.0 m
AMQ15-302
9.3 g/t Au / 4.2 m
AMQ15-266
6.2 g/t Au / 4.5 m
AMQ15-262
6.9 g/t Au / 14.2 m
And 5.6 g/t Au / 8.5 m
AMQ15-265
5.5 g/t Au / 15.0 m
And 7.7 g/t Au / 5.6 m
AMQ15-330
10.4 g/t Au / 21.9 m
And 7.5 g/t Au / 3.5 m
And 5.9 g/t Au / 9.1 m
AMQ15-251
5.7 g/t Au / 19.2 m
Incl. 6.5 g/t Au / 14.3 m
AMQ15-311
4.9 g/t Au / 9.2 m
And 10.8 g/t Au / 8.2 m
And 4.9 g/t Au / 7.5 m
AMQ15-289
4.4 g/t Au / 7.7 m
And 10.6 g/t Au / 5.6 m
And 5.9 g/t Au / 45.0 m
Incl. 9.0 g/t Au / 13.0 m
AMQ15-318
5.4 g/t Au / 10.1 m
And 12.6 g/t Au / 6.1 m
And 7.4 g/t Au / 4.7 m
AMQ15-319
23.9 g/t Au / 4.2 m
AMQ15-345A
10.0 g/t Au / 10.3 m
And 7.6 g/t Au / 28.3 m
And 9.6 g/t Au / 3.5 m
And 5.1 g/t Au / 6.6 m
AMQ15-351
10.8 g/t Au / 6.9 m
Incl. 15.1 g/t Au / 4.2 m
AMQ15-343
10.8 g/t Au / 9.7 m
AMQ15-328
2.8 g/t Au / 38.9 m
Incl. 6.2 g/t Au / 7.6 m
An additional 50,000 metres of drilling expected to be completed in Q3 2015
AGNICO EAGLE | BAML 21ST ANNUAL CANADA MINING CONFERENCE | 21
2013 – 500 ha
2014 – 10,000 ha
2015 (Arial +Ground) – 68,000 ha
Amaruq Project - Regional Exploration
Developing new targets along the belt
AGNICO EAGLE | BAML 21ST ANNUAL CANADA MINING CONFERENCE | 22
Amaruq Project
Regional prospecting and geochemical sampling has outlined additional targets
AGNICO EAGLE | BAML 21ST ANNUAL CANADA MINING CONFERENCE | 23
Meliadine Development Project
Current focus on optimization of the resource base and potential production scenarios
Proven and probable gold reserves: 3.3 million ounces
Indicated gold resources: 3.3 million ounces
Inferred gold resources: 3.5 million ounces
For additional details on Meliadine reserves and resources see Presentation Appendix and AEM April 30, 2015 press release
AGNICO EAGLE | BAML 21ST ANNUAL CANADA MINING CONFERENCE | 24
EXPLORATION AND DEVELOPMENT HIGHLIGHTS
Rimpi
Development
 Drilling on the Rimpi Zone has outlined a significant zone of mineralization with potentially wider
widths and better grades than those currently being mined
 Main underground ramp at Kittilä is being extended to reach the Rimpi Zone and facilitate further
exploration. A surface ramp is also being driven into the Rimpi Zone
Kuotko
Satellite
Deposit
 Located just 15 km north of the Kittilä mine, studies are underway to assess the viability of mining the
deposit by open pit. Drilling is underway to infill and potentially expand the existing 170,000 ounce
inferred resource
Kittilä
Reviewing opportunities to increase production
PRODUCTION H1 2015 PRODUCTION HIGHLIGHTS
Kittilä
86,640 ozs
at a total cash cost of
$727/oz
 During the fourth quarter of 2014, mill expansion ramped up to the
4,000 tpd nameplate capacity (early indications have shown that the
plant can potentially exceed this capacity)
 Drilling continues to expand new parallel mineralized zone discovered
in April 2015. This zone could provide a new potential ore source
AGNICO EAGLE | BAML 21ST ANNUAL CANADA MINING CONFERENCE | 25
Kittila Mine – Composite Longitudinal Section
ROU10-037
10.2 g/t Au / 5.6 m
ROU14-009
7.3 g/t Au / 2.4 m
ROD14-005
5.7 g/t Au / 2.7 m
And 3.1 g/t Au / 3.7 m
ROD14-004F
5.3 g/t Au / 10.0 m
ROD-0763-15-602B
5.2 g/t Au / 8.2 m
ROD14-003
7.8 g/t Au / 11.5 m
Incl. 12.5 g/t Au / 3.6 m
ROD14-005
7.0 g/t Au / 7.0 m
ROD14-003
5.3 g/t Au / 3.1 m
ROU15603
5.2 g/t Au / 13.3 m
Incl. 6.1 g/t Au / 7.1 m
New Zone - potential to
increase reserves
AGNICO EAGLE | BAML 21ST ANNUAL CANADA MINING CONFERENCE | 26
Kittila Mine
New Parallel zone could support increased production levels
 The new zone is located ~150 meters east
of the main zone
 A recent hole yielded 5.2 g/t over 13.3
metres. Up dip projection could be in close
proximity to the main Rimpi exploration
ramp
 A second underground heavy drill rig will be
added to further assess the extent of this
new parallel zone
 Higher throughput levels, the discovery of a
new parallel zone of gold mineralization,
and potential development of the higher-
grade Rimpi zone opens up the potential
for increased production levels and further
optimization of the mine plan
SOUTHERN
BUSINESS
AGNICO EAGLE | BAML 21ST ANNUAL CANADA MINING CONFERENCE | 28
Mexico – Solid Production Platform and Project Pipeline
(Advanced Exploration)
(Exploration)
AGNICO EAGLE | BAML 21ST ANNUAL CANADA MINING CONFERENCE | 29
Mexico – Growing Production With Low and Stable Costs
Payable Production
200
300
400
500
600
700
800
40,000
50,000
60,000
70,000
80,000
90,000
100,000
Q1 12 Q2 12 Q3 12 Q4 12 Q1 13 Q2 13 Q3 13 Q4 13 Q1 14 Q2 14 Q3 14 Q4 14 Q1 15 Q2 15
AgKozs
Auozs
Au Ag
Direct Operating Costs
$-
$10,000
$20,000
$30,000
$40,000
$50,000
$60,000
Q1 12 Q2 12 Q3 12 Q4 12 Q1 13 Q2 13 Q3 13 Q4 13 Q1 14 Q2 14 Q3 14 Q4 14 Q1 15 Q2 15
ThousandsofUSD
AGNICO EAGLE | BAML 21ST ANNUAL CANADA MINING CONFERENCE | 30
PRODUCTION H1 2015 PRODUCTION HIGHLIGHTS
Pinos Altos
100,753 ozs
at a total cash cost of
$371/oz
 Construction continues on the Phase IV heap leach pad
 The Pinos Altos shaft remains on schedule for completion in 2016
 Evaluation of satellite deposits continues. In-fill and conversion drilling
is 50% complete on the Sinter deposit with the expectation of adding
this to the Pinos Altos mine plan in 2020
Creston
Mascota
28,054 ozs
at a total cash cost of
$421/oz
 In April 2015, higher grade mineralization was discovered at the
bottom of the pit and outside the block model. Additional drilling is
underway to test for continuity, and results are being compiled
 In H2 2015, infill and conversion drilling is planned on the Bravo
satellite zone. If successful, this could potentially extend the Creston
Mascota mine life
La India
52,326 ozs
at a total cash cost of
$414/oz
 Development of second phase leach pad continues. This pad provides
capacity for the current planned life-of-mine production and ~5.0
million tonnes of additional stacking
 Block model reconciliation remains favorable. Infill drilling and
technical studies are underway to refine the model. This information
is expected to be incorporated into year-end 2015 reserve and
resource estimates
 Re-evaluation of historical drill core at La India has better quantified
areas with gold bearing sulphide mineralization. Preliminary
metallurgical testing indicates that some of this material may be heap
leachable, with potential to reassign a portion of the sulphide material
back into the resource category
Mexico
Record gold & silver production in H1 2015
AGNICO EAGLE | BAML 21ST ANNUAL CANADA MINING CONFERENCE | 31
Pinos Altos Satellite Zones
Infill drill programs planned at Sinter and Bravo deposits in 2015
AGNICO EAGLE | BAML 21ST ANNUAL CANADA MINING CONFERENCE | 32
Potential
additional
heap leach
Exploration
potential
between the pits
La India Exploration Upside
 Resource halos around current pits require additional drilling
 Good exploration potential between Main and La India Zones and surrounding
claim packages
 Possible upside from refining the block model, and potential to reassign a portion
of sulphide mineralization back into the resource category
Evaluating potential to expand production/extend mine life
AGNICO EAGLE | BAML 21ST ANNUAL CANADA MINING CONFERENCE | 33
El Barqueño Project
 Excellent land package with access, infrastructure, and favorable topography
 Historic heap leach and open pit operation
 Business friendly state of Jalisco
 Conceptual planning and technical work- SBU office in Tucson
 Land consolidation, baseline permitting, and community work is in progress
 10 drills currently working on the property
 Initial resource expected by year-end 2015
Near-term development potential in central Mexico
AGNICO EAGLE | BAML 21ST ANNUAL CANADA MINING CONFERENCE | 34
El Barqueño Project
Main mineralized trend has at least 8km of strike potential
El Barqueno
Ar/Ar 58 Ma
Shambala
Areas of
Mapping &
Sampling
Areas of
Drilling
YTD
Angostura: 21 Holes for 5,073 m
Azteca-Zapoteca: 55 Holes for 11,037 m
Peña de Oro: 50 Holes for 11,859 m
Total: 126 Holes for 27,969 m
APPENDIX
AGNICO EAGLE | BAML 21ST ANNUAL CANADA MINING CONFERENCE | 36
Gold and Silver Reserves and Resources
December 31, 2014
Gold Silver
Tonnes
(000’s)
Gold
(g/t)
Gold
(ounces) (000’s)
Tonnes
(000’s)
Silver
(g/t)
Silver
(ounces) (000’s)
Proven & Probable
Reserves
Northern Business 209,756 2.57 17,299 20,532 19.38 12,793
Southern Business 48,955 1.70 2,678 24,073 63.59 49,212
Total 258,711 2.40 19,976 44,605 43.24 62,005
Measured & Indicated
Resources
Northern Business 248,346 1.70 13,575 6,791 23.35 5,097
Southern Business 68,633 0.65 1,439 14,167 37.93 17,277
Total 316,979 1.47 15,013 20,958 33.21 22,374
Inferred Resources
Northern Business 109,177 3.38 11,867 8,794 17.40 4,920
Southern Business 99,669 0.51 1,621 17,107 23.47 12,908
Total 208,847 2.01 13,487 25,901 21.41 17,828
See AEM April 30, 2015 press release for detailed breakdown of reserves and resources. Reserves are not a subset of resources.
AGNICO EAGLE | BAML 21ST ANNUAL CANADA MINING CONFERENCE | 37
Copper, Zinc and Lead Reserves and Resources
December 31, 2014
Copper Zinc Lead
Tonnes
(000’s)
Copper
(%)
Copper
(tonnes)
Tonnes
(000’s)
Zinc
(%)
Zinc
(tonnes)
Tonnes
(000’s)
Lead
(%)
Lead
(tonnes)
Proven & Probable
Reserves
Northern Business 20,532 0.25 51,250 20,532 0.64 131,231 20,532 0.04 8,076
Southern Business
Total 20,532 0.25 51,250 20,532 0.64 131,231 20,532 0.04 8,076
Measured & Indicated
Resources
Northern Business 6,791 0.24 16,076 6,791 1.01 68,645 6,791 0.11 7,622
Southern Business
Total 6,791 0.24 16,076 6,791 1.01 68,645 6,791 0.11 7,622
Inferred Resources
Northern Business 8,794 0.26 22,552 8,794 0.84 73,977 8,794 0.07 6,359
Southern Business
Total 8,794 0.26 22,552 8,794 0.84 73,977 8,794 0.07 6,359
See AEM April 30, 2015 press release for detailed breakdown of reserves and resources. Reserves are not a subset of resources.
AGNICO EAGLE | BAML 21ST ANNUAL CANADA MINING CONFERENCE | 38
Mineral Reserves and Resources by Project
December 31, 2014*
Northern Business Gold
Tonnes (Mt) Gold (g/t) Gold (Moz)
LaRonde mine
Proven Reserves 4.5 3.76 0.5
Probable Reserves 16.1 5.60 2.9
Measured & Indicated Resource 6.8 3.26 0.7
Inferred Resource 8.8 4.23 1.2
Meadowbank mine
Proven Reserves 1.1 1.50 0.1
Probable Reserves 10.7 3.24 1.1
Measured & Indicated Resource 7.5 3.30 0.8
Inferred Resource 3.3 3.96 0.4
Amaruq Project**
Inferred Resource 9.7 6.47 2.0
Canadian Malartic mine (50% Interest)
Proven Reserves 25.0 0.92 0.7
Probable Reserves 102.0 1.10 3.6
Measured & Indicated Resource (Undiluted) 35.6 0.85 1.0
Inferred Resource 22.7 0.76 0.6
Meliadine project
Proven Reserves 0.03 7.31 0.01
Probable Reserves 13.9 7.44 3.3
Indicated Resource 20.2 5.06 3.3
Inferred Resource 14.1 7.65 3.5
Kittila mine
Proven Reserves 0.9 4.41 0.1
Probable Reserves 27.6 4.95 4.4
Measured & Indicated Resource 14.2 2.96 1.4
Inferred Resource 8.9 4.30 1.2
Goldex mine
Proven Reserves 0.2 1.70 0.01
Probable Reserves 6.9 1.49 0.3
Measured & Indicated Resource 33.8 1.93 2.1
Inferred Resource 29.2 1.64 1.5
Lapa mine
Proven Reserves 0.8 5.87 0.2
Probable Reserves 0.1 5.50 0.01
Indicated Resource 1.1 4.29 0.1
Inferred Resource 1.1 6.30 0.2
Southern Business Gold
Tonnes (Mt) Gold (g/t) Gold (Moz)
Pinos Altos mine
Proven Reserves 2.4 3.27 0.3
Probable Reserves 15.8 2.97 1.5
Indicated Resource 11.9 1.84 0.7
Inferred Resource 12.6 1.22 0.5
Creston Mascota mine
Proven Reserves 0.2 0.76 0.005
Probable Reserves 5.7 1.27 0.2
Indicated Resource 2.2 0.68 0.05
Inferred Resource 4.5 1.07 0.2
La India mine
Proven Reserves 0.1 0.53 0.002
Probable Reserves 24.8 0.85 0.7
Measured & Indicated Resource 54.5 0.39 0.7
Inferred Resource 82.6 0.37 1.0
*See AEM April 30, 2015 press release for detailed breakdown of mineral reserves
and resources. Reserves are not a subset of resources. **Amaruq mineral
resources are as of June 30, 2015. See AEM Aug 19, 2015 press release for
detailed breakdown of mineral resources at Amaruq.
AGNICO EAGLE | BAML 21ST ANNUAL CANADA MINING CONFERENCE | 39
Notes to Investors Regarding the Use of Resources
Cautionary Note to Investors Concerning Estimates of Measured and Indicated Resources
This document uses the terms “measured resources” and “indicated resources”. Investors are advised that while those terms are recognized and required by
Canadian regulations, the SEC does not recognize them. Investors are cautioned not to assume that any part or all of mineral deposits in these categories will
ever be converted into reserves.
Cautionary Note to Investors Concerning Estimates of Inferred Resources
This document also uses the term “inferred resources”. Investors are advised that while this term is recognized and required by Canadian regulations, the SEC
does not recognize it. “Inferred resources” have a great amount of uncertainty as to their existence, and great uncertainty as to their economic and legal
feasibility. It cannot be assumed that all or any part of an inferred mineral resource will ever be upgraded to a higher category. Under Canadian rules, estimates of
inferred mineral resources may not form the basis of feasibility or pre-feasibility studies, except in rare cases. Investors are cautioned not to assume that part or
all of an inferred resource exists, or is economically or legally mineable.
Scientific and Technical Data
Cautionary Note To U.S. Investors - The SEC permits U.S. mining companies, in their filings with the SEC, to disclose only those mineral deposits that a
company can economically and legally extract or produce. Agnico Eagle reports mineral resource and reserve estimates in accordance with the CIM guidelines
for the estimation, classification and reporting of resources and reserves in accordance with the Canadian securities regulatory authorities' (the "CSA") National
Instrument 43-101 Standards of Disclosure for Mineral Projects ("NI 43-101"). These standards are similar to those used by the SEC’s Industry Guide No. 7, as
interpreted by Staff at the SEC ("Guide 7"). However, the definitions in NI 43-101 differ in certain respects from those under Guide 7. Accordingly, mineral reserve
information contained herein may not be comparable to similar information disclosed by U.S. companies. Under the requirements of the SEC, mineralization may
not be classified as a "reserve" unless the determination has been made that the mineralization could be economically and legally produced or extracted at the
time the reserve determination is made. A "final" or "bankable" feasibility study is required to meet the requirements to designate reserves under Industry Guide 7.
Agnico Eagle uses certain terms in this presentation, such as "measured", "indicated", and "inferred", and "resources" that the SEC guidelines strictly prohibit
U.S. registered companies from including in their filings with the SEC.
Prior to 2013, reserves for all properties were typically estimated using historic three-year average metals prices and foreign exchange rates in accordance with
the SEC guidelines. These guidelines require the use of prices that reflect current economic conditions at the time of reserve determination, which the Staff of the
SEC has interpreted to mean historic three-year average prices. Given the current lower commodity price environment, Agnico Eagle has decided to use price
assumptions that are below the three-year averages. The assumptions used for the mineral reserves estimates at all mines and advanced projects as of
December 31, 2014, reported by the Company on April 30, 2015, are $1,150 per ounce gold, $18.00 per ounce silver, $1.00 per pound zinc, $3.00 per pound
copper, $0.91 per pound lead and C$/US$, US$/Euro and MXP/US$ exchange rates of 1.08, 1.30 and 13.00, respectively. The June 30, 2015 Amaruq mineral
resource uses the same parameters as the December 31, 2014 mineral reserve and resource estimates.
For the reserves estimate at the Canadian Malartic mine, the Company has decided to continue to report the reserves estimated as of June 15, 2014, reported by
the Company in a news release dated August 13, 2014, minus the production to the end of 2014. The assumptions used were $1,300 per ounce gold, a cut-off
grade between 0.28 g/t and 0.35 g/t gold (depending on the deposit), and a C$/US$ exchange rate of 1.10.
NI 43-101 requires mining companies to disclose reserves and resources using the subcategories of "proven" reserves, "probable" reserves, "measured"
resources, "indicated" resources and "inferred" resources. Mineral resources that are not mineral reserves do not have demonstrated economic viability.
AGNICO EAGLE | BAML 21ST ANNUAL CANADA MINING CONFERENCE | 40
Notes to Investors Regarding the Use of Resources
A mineral reserve is the economically mineable part of a measured and/or indicated mineral resource. It includes diluting materials and allowances for losses,
which may occur when the material is mined or extracted and is defined by studies at pre-feasibility or feasibility level as appropriate that include application of
modifying factors. Such studies demonstrate that, at the time of reporting, extraction could reasonably be justified.
Modifying factors are considerations used to convert mineral resources to mineral reserves. These include, but are not restricted to, mining, processing,
metallurgical, infrastructure, economic, marketing, legal, environmental, social and governmental factors.
A proven mineral reserve is the economically mineable part of a measured mineral resource. A proven mineral reserve implies a high degree of confidence in the
modifying factors. A probable mineral reserve is the economically mineable part of an indicated and, in some circumstances, a measured mineral resource. The
confidence in the modifying factors applying to a probable mineral reserve is lower than that applying to a proven mineral reserve.
A mineral resource is a concentration or occurrence of solid material of economic interest in or on the Earth's crust in such form, grade or quality and quantity that
there are reasonable prospects for eventual economic extraction. The location, quantity, grade or quality, continuity and other geological characteristics of a
mineral resource are known, estimated or interpreted from specific geological evidence and knowledge, including sampling.
A measured mineral resource is that part of a mineral resource for which quantity, grade or quality, densities, shape and physical characteristics are estimated
with confidence sufficient to allow the application of modifying factors to support detailed mine planning and final evaluation of the economic viability of the
deposit. Geological evidence is derived from detailed and reliable exploration, sampling and testing and is sufficient to confirm geological and grade or quality
continuity between points of observation. An indicated mineral resource is that part of a mineral resource for which quantity, grade or quality, densities, shape and
physical characteristics are estimated with sufficient confidence to allow the application of modifying factors in sufficient detail to support mine planning and
evaluation of the economic viability of the deposit. Geological evidence is derived from adequately detailed and reliable exploration, sampling and testing and is
sufficient to assume geological and grade or quality continuity between points of observation. An inferred mineral resource is that part of a mineral resource for
which quantity and grade or quality are estimated on the basis of limited geological evidence and sampling. Geological evidence is sufficient to imply but not
verify geological and grade or quality continuity.
Investors are cautioned not to assume that part or all of an inferred resource exists, or is economically or legally mineable.
A feasibility study is a comprehensive technical and economic study of the selected development option for a mineral project that includes appropriately detailed
assessments of applicable modifying factors together with any other relevant operational factors and detailed financial analysis that are necessary to
demonstrate, at the time of reporting, that extraction is reasonably justified (economically mineable). The results of the study may reasonably serve as the basis
for a final decision by a proponent or financial institution to proceed with, or finance, the development of the project. The confidence level of the study will be
higher than that of a Pre-Feasibility Study.
The effective date for all of the Company's mineral resource and reserve estimates in this presentation is December 31, 2014, other than Amaruq, which is at
June 30, 2015. Additional information about each of the mineral projects that is required by NI 43-101, sections 3.2 and 3.3 and paragraphs 3.4 (a), (c) and (d)
can be found in the Technical Reports filed by Agnico Eagle, which may be found at www.sedar.com. Other important operating information can be found in the
Company's AIF and Form 40-F.
The scientific and technical information contained herein has been approved by Daniel Doucet, Senior Corporate Director, Reserve Development, and/or Alain
Blackburn, Senior Vice-President, Exploration. Both Mr. Doucet and Mr. Blackburn are designated Ing. with the Ordre des ingenieurs du Québec and qualified
persons as defined by NI 43-101.
Trading Symbol:
AEM on TSX & NYSE
Investor Relations:
416-947-1212
info@agnicoeagle.com
agnicoeagle.com

BAML 21st Annual Canada Mining Conference

  • 1.
    BANK OF AMERICAMERRILL LYNCH 21ST ANNUAL CANADA MINING CONFERENCE SEPTEMBER 2015
  • 2.
    AGNICO EAGLE |BAML 21ST ANNUAL CANADA MINING CONFERENCE | 2 Forward-Looking Statements The information in this presentation has been prepared as at September 10, 2015. Certain statements contained in this document constitute “forward-looking statements” within the meaning of the United States Private Securities Litigation Reform Act of 1995 and “forward-looking information” under the provisions of Canadian provincial securities laws and are referred to herein as “forward-looking statements”. When used in this document, the words “expect”, “estimate”, “forecast”, “will”, “planned” and similar expressions are intended to identify forward-looking statements. Such statements include without limitation: the Company's forward-looking production guidance, including estimated ore grades, project timelines, drilling results, metal production, mine estimates horizons, production, total cash costs per ounce, minesite costs per tonne; all-in sustaining costs and cash flows; the estimated timing and conclusions of technical reports and other studies; the methods by which ore will be extracted or processed; statements concerning expansion projects, recovery rates, mill throughput, and projected exploration expenditures, including costs and other estimates upon which such projections are based; estimates of depreciation expense, general and administrative expense and tax rates; the impact of maintenance shutdowns; statements regarding timing and amounts of capital expenditures and other assumptions; estimates of future reserves, resources, mineral production, optimization efforts and sales; estimates of mine life; estimates of future mining costs, total cash costs, minesite costs, all-in sustaining costs and other expenses; estimates of future capital expenditures and other cash needs, and expectations as to the funding thereof; statements and information as to the projected development of certain ore deposits, including estimates of exploration, development and production and other capital costs, and estimates of the timing of such exploration, development and production or decisions with respect to such exploration, development and production; estimates of reserves and resources, and statements and information regarding anticipated future exploration; the anticipated timing of events with respect to the Company’s mine sites and statements and information regarding the sufficiency of the Company’s cash resources and other statements and information regarding anticipated trends with respect to the Company's operations, exploration and the funding thereof. Such statements and information reflect the Company’s views as at the date of this document and are subject to certain risks, uncertainties and assumptions, and undue reliance should not be placed on such statements and information. Forward-looking statements are necessarily based upon a number of factors and assumptions that, while considered reasonable by Agnico Eagle as of the date of such statements, are inherently subject to significant business, economic and competitive uncertainties and contingencies. The material factors and assumptions used in the preparation of the forward-looking statements contained herein, which may prove to be incorrect, include, but are not limited to, the assumptions set forth herein and in management's discussion and analysis (“MD&A”) and the Company's Annual Information Form (“AIF”) for the year ended December 31, 2014 filed with Canadian securities regulators and that are included in its Annual Report on Form 40-F for the year ended December 31, 2014 (“Form 40-F”) filed with the U.S. Securities and Exchange Commission (the “SEC”) as well as: that there are no significant disruptions affecting operations; that production, permitting and expansion at each of Agnico Eagle's properties proceeds on a basis consistent with current expectations and plans; that the relevant metals prices, exchange rates and prices for key mining and construction supplies will be consistent with Agnico Eagle's expectations; that Agnico Eagle's current estimates of mineral reserves, mineral resources, mineral grades and metal recovery are accurate; that there are no material delays in the timing for completion of ongoing growth projects; that the Company's current plans to optimize production are successful; and that there are no material variations in the current tax and regulatory environment. Many factors, known and unknown could cause the actual results to be materially different from those expressed or implied by such forward-looking statements and information. Such risks include, but are not limited to: the volatility of prices of gold and other metals; uncertainty of mineral reserves, mineral resources, mineral grades and mineral recovery estimates; uncertainty of future production, capital expenditures, and other costs; currency fluctuations; financing of additional capital requirements; cost of exploration and development programs; mining risks; community protests; risks associated with foreign operations; governmental and environmental regulation; the volatility of the Company’s stock price; and risks associated with the Company’s by-product metal derivative strategies. For a more detailed discussion of such risks and other factors that may affect the Company’s ability to achieve the expectations set forth in the forward-looking statements contained in this document, see the AIF and MD&A filed on SEDAR at www.sedar.com and included in the Form 40-F filed on EDGAR at www.sec.gov, as well as the Company’s other filings with the Canadian securities regulators and the SEC. The Company does not intend, and does not assume any obligation, to update these forward-looking statements and information other than as required by law. For a detailed breakdown of the Company’s reserve and resource position see the Company’s press release dated April 30, 2015.
  • 3.
    AGNICO EAGLE |BAML 21ST ANNUAL CANADA MINING CONFERENCE | 3 Notes to Investors Note Regarding the Use of Non-GAAP Financial Measures This presentation discloses certain measures, including ‘‘total cash costs per ounce’’,‘‘minesite costs per tonne’’ and “all-in sustaining costs” that are not recognized measures under IFRS. This data may not be comparable to data presented by other gold producers. For a reconciliation of these measures to the most directly comparable financial information presented in the consolidated financial statements prepared in accordance with IFRS and for an explanation of how management uses these measures, see “Non-GAAP Financial Performance Measures” in the MD&A filed on SEDAR at www.sedar.com and included in the Form 6-K filed on EDGAR at www.sec.gov, as well as the Company’s other filings with the Canadian securities regulators and the SEC. Total cash costs per ounce of gold produced is presented on both a by-product basis (deducting by-product metal revenues from production costs) and co-product basis (before by-product metal revenues). Total cash costs per ounce of gold produced on a by-product basis is calculated by adjusting production costs as recorded in the consolidated statements of income (loss) for by-product revenues, unsold concentrate inventory production costs, smelting, refining and marketing charges and other adjustments, and then dividing by the number of ounces of gold produced. Total cash costs per ounce of gold produced on a co-product basis is calculated in the same manner as total cash costs per ounce of gold produced on a by-product basis except that no adjustment for by-product metal revenues is made. Accordingly, the calculation of total cash costs per ounce of gold produced on a co-product basis does not reflect a reduction in production costs or smelting, refining and marketing charges associated with the production and sale of by-product metals. Total cash costs per ounce of gold produced is intended to provide information about the cash generating capabilities of the Company’s mining operations. Management also uses these measures to monitor the performance of the Company’s mining operations. As market prices for gold are quoted on a per ounce basis, using the total cash cost per ounce of gold produced on a by- product basis measure allows management to assess a mine’s cash generating capabilities at various gold prices. Management is aware that these per ounce measures of performance can be affected by fluctuations in and exchange rates. and, in the case of total cash costs per ounce of gold produced on a by-product basis, by-product metal prices. Management compensates for these inherent limitations by using these measures in conjunction with minesite costs per tonne (discussed below) as well as other data prepared in accordance with IFRS. Management also performs sensitivity analyses in order to quantify the effects of fluctuating exchange rates and metal prices. This presentation also contains information as to estimated future total cash costs per ounce, all-in sustaining costs and minesite costs per tonne. The estimates are based upon the total cash costs per ounce, all-in sustaining costs and minesite costs per tonne that the Company expects to incur to mine gold at its mines and projects and, consistent with the reconciliation of these actual costs referred to above, do not include production costs attributable to accretion expense and other asset retirement costs, which will vary over time as each project is developed and mined. It is therefore not practicable to reconcile these forward-looking Non-GAAP financial measures to the most comparable IFRS measure. Note Regarding Production Guidance The gold production guidance is based on the Company’s mineral reserves but includes contingencies and assumes metal prices and foreign exchange rates that are different from those used in the reserve estimates. These factors and others mean that the gold production guidance presented in this presentation does not reconcile exactly with the production models used to support these mineral reserves.
  • 4.
    AGNICO EAGLE |BAML 21ST ANNUAL CANADA MINING CONFERENCE | 4 Agnico Eagle – Running a High Quality, Manageable Business Quality Reserves Moderate Balance Sheet Declining Operating Costs – Significant FX Tailwind Long Track Record of Exploration Success Assets DeliveringDisciplined Share Issuance Project Pipeline Expected to Drive Future Production Growth Consistent Dividend Payer Low Political Risk Operating Regions Experienced Management, Proven Strategy A PREMIUM GOLD COMPANY
  • 5.
    AGNICO EAGLE |BAML 21ST ANNUAL CANADA MINING CONFERENCE | 5 H1 2015 Operating Results Strong production and cost performance H1 2015 All amounts are in US$ (Unless Otherwise Indicated) Production (Gold oz) Total Cash Cost* ($/oz) Operating Margin ($000’s) Northern Business LaRonde 122,900 $656 $62,813 Lapa 45,370 $615 $26,038 Goldex 55,712 $585 $34,778 Canadian Malartic (50%) 136,334 $621 $79,456 Kittila 86,640 $727 $43,560 Meadowbank 179,799 $672 $96,177 626,755 $653 $342,822 Southern Business Pinos Altos 100,753 $371 $79,190 Creston Mascota 28,054 $421 $21,377 La India 52,326 $414 $39,424 181,133 $391 $139,991 Total 807,888 $595 $482,813 H1 2015 Total Operating Margin – $482.8 MH1 2015 Revenue by Metal Meadowbank, 20% Canadian Malartic, 17% Pinos Altos, 17% LaRonde, 13% Kittila, 9% La India, 8% Goldex, 7% Lapa, 5% Creston Mascota, 4% *Total cash costs are presented on a by-product basis, that is net of by-product revenue Gold 95% Silver 4% Base Metals 1%
  • 6.
    AGNICO EAGLE |BAML 21ST ANNUAL CANADA MINING CONFERENCE | 6 Stable Production and Good Cost Profile LaRonde, Kittila, La India and Canadian Malartic are key production drivers over the next three years * Approximate mid range of estimated 2015 cost guidance 294 315 310 310 1,135 1,285 1,290 1,190 1,429 1,600 1,600 1,500 2014A 2015E 2016E 2017E Payable Gold Production Profile Northern Business (‘000 oz) Southern Business (‘000 oz) 2014A 2015E AISC $954 $880* TCC $637 $610*
  • 7.
    AGNICO EAGLE |BAML 21ST ANNUAL CANADA MINING CONFERENCE | 7 Gold Price Remains Strong in Local Currencies Currency weakness provides strong tailwind 90% 100% 110% 120% 130% 140% 150% 160% 170% 180% USD Gold CAD Gold EUR Gold MXN Gold Gold Price in Local Currencies USD CAD EUR MXN Jan. 1, 2010 $1,097 $1,155 €766 14,377 MXN Aug. 28, 2015 $1,134 $1,496 €1,014 18,988 MXN % Change 3% 30% 32% 32% Source: Bloomberg Gold Production (Ozs) Currency Exposure Currency 2015E Production (Ozs) % of Production CAD 1,100,000 69% EUR 185,000 12% MXN 315,000 19%
  • 8.
    AGNICO EAGLE |BAML 21ST ANNUAL CANADA MINING CONFERENCE | 8 Solid Financial Flexibility Improved balance sheet in H1 2015, continued focus on debt reduction Strong Available Liquidity - $1.0B* Long-term Debt Maturities *As at June 30, 2015  Approximately $179 million of debt repayments in H1 2015  Manageable debt repayment schedule  $1.2 billion of outstanding debt as of June 30, 2015  Low share count of 217 million fully diluted after 58 years of operating history $184M $825M Cash and cash equivalents Undrawn credit facilities C$20 C$20 US$115 US$360 US$225 US$100 $0 $50 $100 $150 $200 $250 $300 $350 $400 2016 2017 2020 2022 2024
  • 9.
    AGNICO EAGLE |BAML 21ST ANNUAL CANADA MINING CONFERENCE | 9 2.13 1.74 1.89 3.16 6.08 5.82 6.10 6.36 6.67 7.47 0 1 2 3 4 5 6 7 8 2006 2007 2008 2009 2010 2011 2012 2013 2014 2015 Oz/1000shares Production / 1000 Shares Rising Production Per Share
  • 10.
    AGNICO EAGLE |BAML 21ST ANNUAL CANADA MINING CONFERENCE | 10 Steady Growth in Reserve and Resources per Share 30.95 35.75 39.81 32.82 60.61 57.35 71.00 58.54 62.95 13.52 21.08 21.92 40.27 39.65 56.88 47.32 55.84 70.08 107.93 125.47 124.79 117.98 131.20 110.72 109.08 97.55 93.24 0 50 100 150 200 250 2006 2007 2008 2009 2010 2011 2012 2013 2014 Oz/1000shares Inferred resources / 1000 Shares M&I resources / 1000 Shares Reserve / 1000 Shares  Approximately 95% of current reserves estimated to be mineable at cash costs below $950 per ounce  Reserve sensitivity: A $150 per ounce move in the gold price (all other assumptions unchanged) results in approximately a 6% change in reserves
  • 11.
    AGNICO EAGLE |BAML 21ST ANNUAL CANADA MINING CONFERENCE | 11 Upper Beaver* Strong Exploration/Development Pipeline Supports Future Growth Hammond Reef* El Barqueno Meliadine Amaruq Pinos Altos Satellites La India Expansion Potential LaRonde III Odyssey* Rimpi and New Parallel Zone at KittilaPandora* Goldex Deep Advanced Exploration Approaching Development Mine Site – Expansion/Extension *50% AEM Ownership
  • 12.
  • 13.
    AGNICO EAGLE |BAML 21ST ANNUAL CANADA MINING CONFERENCE | 13 PRODUCTION H1 2015 PRODUCTION HIGHLIGHTS LaRonde 122,900 ozs at a total cash cost of $656/oz  New conveyor and connection to internal ramp at the 281 level expected to be completed by the end of Q3 2015, which should improve mining flexibility  Studies are continuing to assess the potential to extend the reserve base and carry out mining between the 311 and 371 levels (a depth of 3.1 to 3.7 km below the surface) Canadian Malartic GP (50%) 136,334 ozs at a total cash cost of $621/oz  Further optimization initiatives include:  Improvements to SAG mill liners to reduce number of planned shutdowns  Maintaining mining throughput levels at two million tonnes per month in the higher grade North zone  Waste rock backfilling of the Gouldie pit to reduce haulage distances and noise  Permitting activities for the Barnat Extension and deviation of Highway 117 remain on schedule with receipt of permits expected in late 2016 Goldex 55,712 ozs at a total cash cost of $585/oz  Goldex Deep 1 Project approved for production  Gold production expected to average >100,000 oz per year through 2024 at an average annual total cash cost per ounce of approximately $620 Lapa 45,370 ozs at a total cash cost of $615/oz  2015 is the last full year of production based on current mine plan. Additional exploration drilling is ongoing in the Zulapa Z7 zone at depth which, if successful, could extend the mine life Abitibi Region Solid and growing production base in Quebec
  • 14.
    AGNICO EAGLE |BAML 21ST ANNUAL CANADA MINING CONFERENCE | 14  Approximately 80-85% of ore now accessed from below level 245  Three mining horizons now operational providing improved access to higher grade reserves  Annual gold production expected to reach 350,000 ozs in 2019  Exploration is targeting reserve and resource development from the 311 to 371 levels (a depth of 3.1 to 3.7 km) Laronde - Lower Mine Production Increasing
  • 15.
    AGNICO EAGLE |BAML 21ST ANNUAL CANADA MINING CONFERENCE | 15 Mine Life Extended Through 2024  New mining area includes lower part of the Dx zone and top of the D zone  Zone developed from current infrastructure, no change in mining method  Mining rate expected to be ~6,000 tpd, at an average grade of 1.69 g/t gold  Minesite costs per tonne are estimated at ~C$35 to C$40  Development capital forecast to be ~$135 to $140 million. Total sustaining capital over the expected seven year mine life is estimated to be ~$60 to $70 million  The advancement of the Deep 1 project also unlocks significant upside through the potential for additional mineral resource conversion in Deep 1, potential for mining at Deep 2 (below Level 120), and potential to develop the Akasaba West deposit Goldex Deep 1 Project
  • 16.
    AGNICO EAGLE |BAML 21ST ANNUAL CANADA MINING CONFERENCE | 16 Nunavut – Production, Development And Exploration Platform supported by logistical centre in the Abitibi Val d’Or Meliadine Meadowbank Amaruq
  • 17.
    AGNICO EAGLE |BAML 21ST ANNUAL CANADA MINING CONFERENCE | 17 EXPLORATION AND DEVELOPMENT HIGHLIGHTS Meliadine  Optimization studies continue on the large reserve and resource base at Meliadine  Inuit impact benefits agreement (IIBA) signed July 2015  Project on track for a potential late 2019 startup (pending a construction decision), 2015 capital budget has been increased by $22 million to expand the existing surface and underground infrastructure, and prepare for the 2016 work program Amaruq  35% increase in resources reported in August 2015*. Project now contains 2.0 million ounces of inferred resources (9.7 million tonnes at 6.47 g/t gold)  Phase 2 drill program underway to expand and further infill known deposits  Amaruq could potentially be developed as a satellite to Meadowbank Nunavut Arctic platform starting to gain momentum PRODUCTION H1 2015 PRODUCTION HIGHLIGHTS Meadowbank 179,799 ozs at a total cash cost of $672/oz  Vault pit expansion extends Meadowbank production to Q3 2018  Mine life extension expected to shorten potential production gap associated with the start-up of a possible satellite operation at Amaruq  Meadowbank 2015 capital budget increased by $27 million to develop Vault extension (higher deferred stripping and purchase of additional haul trucks) *For additional details on the updated Amaruq resource see Presentation Appendix and AEM August 19, 2015 press release
  • 18.
    AGNICO EAGLE |BAML 21ST ANNUAL CANADA MINING CONFERENCE | 18 Amaruq Project Infill drilling results in 35% increase to inferred resources since year-end 2014 Amaruq deposits now host ~2.02 million ounces of inferred gold resources (9.7 million tonnes at 6.5 g/t)
  • 19.
    AGNICO EAGLE |BAML 21ST ANNUAL CANADA MINING CONFERENCE | 19 Grade capped 60 g/t over estimate true width Amaruq Project – Updated Whale Tail Resource 155 drill holes included in the resource estimation AMQ15-310 6.7 g/t Au / 32.3 m AMQ15-296 7.4 g/t Au / 6.0 m And 9.4 g/t Au / 16.9 m And 7.2 g/t Au / 6.0 m AMQ15-280 12.5 g/t Au / 5.8 m AMQ15-321 5.5 g/t Au / 21.9 m Incl. 7.9 g/t Au / 7.1 m AMQ15-291 10.6 g/t Au / 8.7 m And 6.1 g/t Au / 8.0 m AMQ15-302 9.3 g/t Au / 4.2 m AMQ15-262 6.9 g/t Au / 14.2 m And 5.6 g/t Au / 8.5 m AMQ15-265 5.5 g/t Au / 15.0 m And 7.7 g/t Au / 5.6 m AMQ15-330 10.4 g/t Au / 21.9 m And 7.5 g/t Au / 3.5 m And 5.9 g/t Au / 9.1 m AMQ15-251 5.7 g/t Au / 19.2 m Incl. 6.5 g/t Au / 14.3 m AMQ15-311 4.9 g/t Au / 9.2 m And 10.8 g/t Au / 8.2 m And 4.9 g/t Au / 7.5 m AMQ15-289 4.4 g/t Au / 7.7 m And 10.6 g/t Au / 5.6 m And 5.9 g/t Au / 45.0 m Incl. 9.0 g/t Au / 13.0 m AMQ15-318 5.4 g/t Au / 10.1 m And 12.6 g/t Au / 6.1 m 7.4 g/t Au / 4.7 m AMQ15-319 23.9 g/t Au / 4.2 m AMQ15-345A 10.0 g/t Au / 10.3 m And 7.6 g/t Au / 28.3 m And 9.6 g/t Au / 3.5 m And 5.1 g/t Au / 6.6 m AMQ15-351 10.8 g/t Au / 6.9 m Incl. 15.1 g/t Au / 4.2 m AMQ15-343 10.8 g/t Au / 9.7 m AMQ15-328 2.8 g/t Au / 38.9 m Incl. 6.2 g/t Au / 7.6 m
  • 20.
    AGNICO EAGLE |BAML 21ST ANNUAL CANADA MINING CONFERENCE | 20Grade capped 60 g/t over estimate true width Amaruq Project - Phase Two Drilling Underway AMQ15-310 6.7 g/t Au / 32.3 m AMQ15-304 4.5 g/t Au / 5.4 m AMQ15-296 7.4 g/t Au / 6.0 m And 9.4 g/t Au / 16.9 m And 7.2 g/t Au / 6.0 m AMQ15-280 12.5 g/t Au / 5.8 m AMQ15-321 5.5 g/t Au / 21.9 m Incl. 7.9 g/t Au / 7.1 m AMQ15-275 4.6 g/t Au / 4.8 m AMQ15-291 10.6 g/t Au / 8.7 m And 6.1 g/t Au / 8.0 m AMQ15-302 9.3 g/t Au / 4.2 m AMQ15-266 6.2 g/t Au / 4.5 m AMQ15-262 6.9 g/t Au / 14.2 m And 5.6 g/t Au / 8.5 m AMQ15-265 5.5 g/t Au / 15.0 m And 7.7 g/t Au / 5.6 m AMQ15-330 10.4 g/t Au / 21.9 m And 7.5 g/t Au / 3.5 m And 5.9 g/t Au / 9.1 m AMQ15-251 5.7 g/t Au / 19.2 m Incl. 6.5 g/t Au / 14.3 m AMQ15-311 4.9 g/t Au / 9.2 m And 10.8 g/t Au / 8.2 m And 4.9 g/t Au / 7.5 m AMQ15-289 4.4 g/t Au / 7.7 m And 10.6 g/t Au / 5.6 m And 5.9 g/t Au / 45.0 m Incl. 9.0 g/t Au / 13.0 m AMQ15-318 5.4 g/t Au / 10.1 m And 12.6 g/t Au / 6.1 m And 7.4 g/t Au / 4.7 m AMQ15-319 23.9 g/t Au / 4.2 m AMQ15-345A 10.0 g/t Au / 10.3 m And 7.6 g/t Au / 28.3 m And 9.6 g/t Au / 3.5 m And 5.1 g/t Au / 6.6 m AMQ15-351 10.8 g/t Au / 6.9 m Incl. 15.1 g/t Au / 4.2 m AMQ15-343 10.8 g/t Au / 9.7 m AMQ15-328 2.8 g/t Au / 38.9 m Incl. 6.2 g/t Au / 7.6 m An additional 50,000 metres of drilling expected to be completed in Q3 2015
  • 21.
    AGNICO EAGLE |BAML 21ST ANNUAL CANADA MINING CONFERENCE | 21 2013 – 500 ha 2014 – 10,000 ha 2015 (Arial +Ground) – 68,000 ha Amaruq Project - Regional Exploration Developing new targets along the belt
  • 22.
    AGNICO EAGLE |BAML 21ST ANNUAL CANADA MINING CONFERENCE | 22 Amaruq Project Regional prospecting and geochemical sampling has outlined additional targets
  • 23.
    AGNICO EAGLE |BAML 21ST ANNUAL CANADA MINING CONFERENCE | 23 Meliadine Development Project Current focus on optimization of the resource base and potential production scenarios Proven and probable gold reserves: 3.3 million ounces Indicated gold resources: 3.3 million ounces Inferred gold resources: 3.5 million ounces For additional details on Meliadine reserves and resources see Presentation Appendix and AEM April 30, 2015 press release
  • 24.
    AGNICO EAGLE |BAML 21ST ANNUAL CANADA MINING CONFERENCE | 24 EXPLORATION AND DEVELOPMENT HIGHLIGHTS Rimpi Development  Drilling on the Rimpi Zone has outlined a significant zone of mineralization with potentially wider widths and better grades than those currently being mined  Main underground ramp at Kittilä is being extended to reach the Rimpi Zone and facilitate further exploration. A surface ramp is also being driven into the Rimpi Zone Kuotko Satellite Deposit  Located just 15 km north of the Kittilä mine, studies are underway to assess the viability of mining the deposit by open pit. Drilling is underway to infill and potentially expand the existing 170,000 ounce inferred resource Kittilä Reviewing opportunities to increase production PRODUCTION H1 2015 PRODUCTION HIGHLIGHTS Kittilä 86,640 ozs at a total cash cost of $727/oz  During the fourth quarter of 2014, mill expansion ramped up to the 4,000 tpd nameplate capacity (early indications have shown that the plant can potentially exceed this capacity)  Drilling continues to expand new parallel mineralized zone discovered in April 2015. This zone could provide a new potential ore source
  • 25.
    AGNICO EAGLE |BAML 21ST ANNUAL CANADA MINING CONFERENCE | 25 Kittila Mine – Composite Longitudinal Section ROU10-037 10.2 g/t Au / 5.6 m ROU14-009 7.3 g/t Au / 2.4 m ROD14-005 5.7 g/t Au / 2.7 m And 3.1 g/t Au / 3.7 m ROD14-004F 5.3 g/t Au / 10.0 m ROD-0763-15-602B 5.2 g/t Au / 8.2 m ROD14-003 7.8 g/t Au / 11.5 m Incl. 12.5 g/t Au / 3.6 m ROD14-005 7.0 g/t Au / 7.0 m ROD14-003 5.3 g/t Au / 3.1 m ROU15603 5.2 g/t Au / 13.3 m Incl. 6.1 g/t Au / 7.1 m New Zone - potential to increase reserves
  • 26.
    AGNICO EAGLE |BAML 21ST ANNUAL CANADA MINING CONFERENCE | 26 Kittila Mine New Parallel zone could support increased production levels  The new zone is located ~150 meters east of the main zone  A recent hole yielded 5.2 g/t over 13.3 metres. Up dip projection could be in close proximity to the main Rimpi exploration ramp  A second underground heavy drill rig will be added to further assess the extent of this new parallel zone  Higher throughput levels, the discovery of a new parallel zone of gold mineralization, and potential development of the higher- grade Rimpi zone opens up the potential for increased production levels and further optimization of the mine plan
  • 27.
  • 28.
    AGNICO EAGLE |BAML 21ST ANNUAL CANADA MINING CONFERENCE | 28 Mexico – Solid Production Platform and Project Pipeline (Advanced Exploration) (Exploration)
  • 29.
    AGNICO EAGLE |BAML 21ST ANNUAL CANADA MINING CONFERENCE | 29 Mexico – Growing Production With Low and Stable Costs Payable Production 200 300 400 500 600 700 800 40,000 50,000 60,000 70,000 80,000 90,000 100,000 Q1 12 Q2 12 Q3 12 Q4 12 Q1 13 Q2 13 Q3 13 Q4 13 Q1 14 Q2 14 Q3 14 Q4 14 Q1 15 Q2 15 AgKozs Auozs Au Ag Direct Operating Costs $- $10,000 $20,000 $30,000 $40,000 $50,000 $60,000 Q1 12 Q2 12 Q3 12 Q4 12 Q1 13 Q2 13 Q3 13 Q4 13 Q1 14 Q2 14 Q3 14 Q4 14 Q1 15 Q2 15 ThousandsofUSD
  • 30.
    AGNICO EAGLE |BAML 21ST ANNUAL CANADA MINING CONFERENCE | 30 PRODUCTION H1 2015 PRODUCTION HIGHLIGHTS Pinos Altos 100,753 ozs at a total cash cost of $371/oz  Construction continues on the Phase IV heap leach pad  The Pinos Altos shaft remains on schedule for completion in 2016  Evaluation of satellite deposits continues. In-fill and conversion drilling is 50% complete on the Sinter deposit with the expectation of adding this to the Pinos Altos mine plan in 2020 Creston Mascota 28,054 ozs at a total cash cost of $421/oz  In April 2015, higher grade mineralization was discovered at the bottom of the pit and outside the block model. Additional drilling is underway to test for continuity, and results are being compiled  In H2 2015, infill and conversion drilling is planned on the Bravo satellite zone. If successful, this could potentially extend the Creston Mascota mine life La India 52,326 ozs at a total cash cost of $414/oz  Development of second phase leach pad continues. This pad provides capacity for the current planned life-of-mine production and ~5.0 million tonnes of additional stacking  Block model reconciliation remains favorable. Infill drilling and technical studies are underway to refine the model. This information is expected to be incorporated into year-end 2015 reserve and resource estimates  Re-evaluation of historical drill core at La India has better quantified areas with gold bearing sulphide mineralization. Preliminary metallurgical testing indicates that some of this material may be heap leachable, with potential to reassign a portion of the sulphide material back into the resource category Mexico Record gold & silver production in H1 2015
  • 31.
    AGNICO EAGLE |BAML 21ST ANNUAL CANADA MINING CONFERENCE | 31 Pinos Altos Satellite Zones Infill drill programs planned at Sinter and Bravo deposits in 2015
  • 32.
    AGNICO EAGLE |BAML 21ST ANNUAL CANADA MINING CONFERENCE | 32 Potential additional heap leach Exploration potential between the pits La India Exploration Upside  Resource halos around current pits require additional drilling  Good exploration potential between Main and La India Zones and surrounding claim packages  Possible upside from refining the block model, and potential to reassign a portion of sulphide mineralization back into the resource category Evaluating potential to expand production/extend mine life
  • 33.
    AGNICO EAGLE |BAML 21ST ANNUAL CANADA MINING CONFERENCE | 33 El Barqueño Project  Excellent land package with access, infrastructure, and favorable topography  Historic heap leach and open pit operation  Business friendly state of Jalisco  Conceptual planning and technical work- SBU office in Tucson  Land consolidation, baseline permitting, and community work is in progress  10 drills currently working on the property  Initial resource expected by year-end 2015 Near-term development potential in central Mexico
  • 34.
    AGNICO EAGLE |BAML 21ST ANNUAL CANADA MINING CONFERENCE | 34 El Barqueño Project Main mineralized trend has at least 8km of strike potential El Barqueno Ar/Ar 58 Ma Shambala Areas of Mapping & Sampling Areas of Drilling YTD Angostura: 21 Holes for 5,073 m Azteca-Zapoteca: 55 Holes for 11,037 m Peña de Oro: 50 Holes for 11,859 m Total: 126 Holes for 27,969 m
  • 35.
  • 36.
    AGNICO EAGLE |BAML 21ST ANNUAL CANADA MINING CONFERENCE | 36 Gold and Silver Reserves and Resources December 31, 2014 Gold Silver Tonnes (000’s) Gold (g/t) Gold (ounces) (000’s) Tonnes (000’s) Silver (g/t) Silver (ounces) (000’s) Proven & Probable Reserves Northern Business 209,756 2.57 17,299 20,532 19.38 12,793 Southern Business 48,955 1.70 2,678 24,073 63.59 49,212 Total 258,711 2.40 19,976 44,605 43.24 62,005 Measured & Indicated Resources Northern Business 248,346 1.70 13,575 6,791 23.35 5,097 Southern Business 68,633 0.65 1,439 14,167 37.93 17,277 Total 316,979 1.47 15,013 20,958 33.21 22,374 Inferred Resources Northern Business 109,177 3.38 11,867 8,794 17.40 4,920 Southern Business 99,669 0.51 1,621 17,107 23.47 12,908 Total 208,847 2.01 13,487 25,901 21.41 17,828 See AEM April 30, 2015 press release for detailed breakdown of reserves and resources. Reserves are not a subset of resources.
  • 37.
    AGNICO EAGLE |BAML 21ST ANNUAL CANADA MINING CONFERENCE | 37 Copper, Zinc and Lead Reserves and Resources December 31, 2014 Copper Zinc Lead Tonnes (000’s) Copper (%) Copper (tonnes) Tonnes (000’s) Zinc (%) Zinc (tonnes) Tonnes (000’s) Lead (%) Lead (tonnes) Proven & Probable Reserves Northern Business 20,532 0.25 51,250 20,532 0.64 131,231 20,532 0.04 8,076 Southern Business Total 20,532 0.25 51,250 20,532 0.64 131,231 20,532 0.04 8,076 Measured & Indicated Resources Northern Business 6,791 0.24 16,076 6,791 1.01 68,645 6,791 0.11 7,622 Southern Business Total 6,791 0.24 16,076 6,791 1.01 68,645 6,791 0.11 7,622 Inferred Resources Northern Business 8,794 0.26 22,552 8,794 0.84 73,977 8,794 0.07 6,359 Southern Business Total 8,794 0.26 22,552 8,794 0.84 73,977 8,794 0.07 6,359 See AEM April 30, 2015 press release for detailed breakdown of reserves and resources. Reserves are not a subset of resources.
  • 38.
    AGNICO EAGLE |BAML 21ST ANNUAL CANADA MINING CONFERENCE | 38 Mineral Reserves and Resources by Project December 31, 2014* Northern Business Gold Tonnes (Mt) Gold (g/t) Gold (Moz) LaRonde mine Proven Reserves 4.5 3.76 0.5 Probable Reserves 16.1 5.60 2.9 Measured & Indicated Resource 6.8 3.26 0.7 Inferred Resource 8.8 4.23 1.2 Meadowbank mine Proven Reserves 1.1 1.50 0.1 Probable Reserves 10.7 3.24 1.1 Measured & Indicated Resource 7.5 3.30 0.8 Inferred Resource 3.3 3.96 0.4 Amaruq Project** Inferred Resource 9.7 6.47 2.0 Canadian Malartic mine (50% Interest) Proven Reserves 25.0 0.92 0.7 Probable Reserves 102.0 1.10 3.6 Measured & Indicated Resource (Undiluted) 35.6 0.85 1.0 Inferred Resource 22.7 0.76 0.6 Meliadine project Proven Reserves 0.03 7.31 0.01 Probable Reserves 13.9 7.44 3.3 Indicated Resource 20.2 5.06 3.3 Inferred Resource 14.1 7.65 3.5 Kittila mine Proven Reserves 0.9 4.41 0.1 Probable Reserves 27.6 4.95 4.4 Measured & Indicated Resource 14.2 2.96 1.4 Inferred Resource 8.9 4.30 1.2 Goldex mine Proven Reserves 0.2 1.70 0.01 Probable Reserves 6.9 1.49 0.3 Measured & Indicated Resource 33.8 1.93 2.1 Inferred Resource 29.2 1.64 1.5 Lapa mine Proven Reserves 0.8 5.87 0.2 Probable Reserves 0.1 5.50 0.01 Indicated Resource 1.1 4.29 0.1 Inferred Resource 1.1 6.30 0.2 Southern Business Gold Tonnes (Mt) Gold (g/t) Gold (Moz) Pinos Altos mine Proven Reserves 2.4 3.27 0.3 Probable Reserves 15.8 2.97 1.5 Indicated Resource 11.9 1.84 0.7 Inferred Resource 12.6 1.22 0.5 Creston Mascota mine Proven Reserves 0.2 0.76 0.005 Probable Reserves 5.7 1.27 0.2 Indicated Resource 2.2 0.68 0.05 Inferred Resource 4.5 1.07 0.2 La India mine Proven Reserves 0.1 0.53 0.002 Probable Reserves 24.8 0.85 0.7 Measured & Indicated Resource 54.5 0.39 0.7 Inferred Resource 82.6 0.37 1.0 *See AEM April 30, 2015 press release for detailed breakdown of mineral reserves and resources. Reserves are not a subset of resources. **Amaruq mineral resources are as of June 30, 2015. See AEM Aug 19, 2015 press release for detailed breakdown of mineral resources at Amaruq.
  • 39.
    AGNICO EAGLE |BAML 21ST ANNUAL CANADA MINING CONFERENCE | 39 Notes to Investors Regarding the Use of Resources Cautionary Note to Investors Concerning Estimates of Measured and Indicated Resources This document uses the terms “measured resources” and “indicated resources”. Investors are advised that while those terms are recognized and required by Canadian regulations, the SEC does not recognize them. Investors are cautioned not to assume that any part or all of mineral deposits in these categories will ever be converted into reserves. Cautionary Note to Investors Concerning Estimates of Inferred Resources This document also uses the term “inferred resources”. Investors are advised that while this term is recognized and required by Canadian regulations, the SEC does not recognize it. “Inferred resources” have a great amount of uncertainty as to their existence, and great uncertainty as to their economic and legal feasibility. It cannot be assumed that all or any part of an inferred mineral resource will ever be upgraded to a higher category. Under Canadian rules, estimates of inferred mineral resources may not form the basis of feasibility or pre-feasibility studies, except in rare cases. Investors are cautioned not to assume that part or all of an inferred resource exists, or is economically or legally mineable. Scientific and Technical Data Cautionary Note To U.S. Investors - The SEC permits U.S. mining companies, in their filings with the SEC, to disclose only those mineral deposits that a company can economically and legally extract or produce. Agnico Eagle reports mineral resource and reserve estimates in accordance with the CIM guidelines for the estimation, classification and reporting of resources and reserves in accordance with the Canadian securities regulatory authorities' (the "CSA") National Instrument 43-101 Standards of Disclosure for Mineral Projects ("NI 43-101"). These standards are similar to those used by the SEC’s Industry Guide No. 7, as interpreted by Staff at the SEC ("Guide 7"). However, the definitions in NI 43-101 differ in certain respects from those under Guide 7. Accordingly, mineral reserve information contained herein may not be comparable to similar information disclosed by U.S. companies. Under the requirements of the SEC, mineralization may not be classified as a "reserve" unless the determination has been made that the mineralization could be economically and legally produced or extracted at the time the reserve determination is made. A "final" or "bankable" feasibility study is required to meet the requirements to designate reserves under Industry Guide 7. Agnico Eagle uses certain terms in this presentation, such as "measured", "indicated", and "inferred", and "resources" that the SEC guidelines strictly prohibit U.S. registered companies from including in their filings with the SEC. Prior to 2013, reserves for all properties were typically estimated using historic three-year average metals prices and foreign exchange rates in accordance with the SEC guidelines. These guidelines require the use of prices that reflect current economic conditions at the time of reserve determination, which the Staff of the SEC has interpreted to mean historic three-year average prices. Given the current lower commodity price environment, Agnico Eagle has decided to use price assumptions that are below the three-year averages. The assumptions used for the mineral reserves estimates at all mines and advanced projects as of December 31, 2014, reported by the Company on April 30, 2015, are $1,150 per ounce gold, $18.00 per ounce silver, $1.00 per pound zinc, $3.00 per pound copper, $0.91 per pound lead and C$/US$, US$/Euro and MXP/US$ exchange rates of 1.08, 1.30 and 13.00, respectively. The June 30, 2015 Amaruq mineral resource uses the same parameters as the December 31, 2014 mineral reserve and resource estimates. For the reserves estimate at the Canadian Malartic mine, the Company has decided to continue to report the reserves estimated as of June 15, 2014, reported by the Company in a news release dated August 13, 2014, minus the production to the end of 2014. The assumptions used were $1,300 per ounce gold, a cut-off grade between 0.28 g/t and 0.35 g/t gold (depending on the deposit), and a C$/US$ exchange rate of 1.10. NI 43-101 requires mining companies to disclose reserves and resources using the subcategories of "proven" reserves, "probable" reserves, "measured" resources, "indicated" resources and "inferred" resources. Mineral resources that are not mineral reserves do not have demonstrated economic viability.
  • 40.
    AGNICO EAGLE |BAML 21ST ANNUAL CANADA MINING CONFERENCE | 40 Notes to Investors Regarding the Use of Resources A mineral reserve is the economically mineable part of a measured and/or indicated mineral resource. It includes diluting materials and allowances for losses, which may occur when the material is mined or extracted and is defined by studies at pre-feasibility or feasibility level as appropriate that include application of modifying factors. Such studies demonstrate that, at the time of reporting, extraction could reasonably be justified. Modifying factors are considerations used to convert mineral resources to mineral reserves. These include, but are not restricted to, mining, processing, metallurgical, infrastructure, economic, marketing, legal, environmental, social and governmental factors. A proven mineral reserve is the economically mineable part of a measured mineral resource. A proven mineral reserve implies a high degree of confidence in the modifying factors. A probable mineral reserve is the economically mineable part of an indicated and, in some circumstances, a measured mineral resource. The confidence in the modifying factors applying to a probable mineral reserve is lower than that applying to a proven mineral reserve. A mineral resource is a concentration or occurrence of solid material of economic interest in or on the Earth's crust in such form, grade or quality and quantity that there are reasonable prospects for eventual economic extraction. The location, quantity, grade or quality, continuity and other geological characteristics of a mineral resource are known, estimated or interpreted from specific geological evidence and knowledge, including sampling. A measured mineral resource is that part of a mineral resource for which quantity, grade or quality, densities, shape and physical characteristics are estimated with confidence sufficient to allow the application of modifying factors to support detailed mine planning and final evaluation of the economic viability of the deposit. Geological evidence is derived from detailed and reliable exploration, sampling and testing and is sufficient to confirm geological and grade or quality continuity between points of observation. An indicated mineral resource is that part of a mineral resource for which quantity, grade or quality, densities, shape and physical characteristics are estimated with sufficient confidence to allow the application of modifying factors in sufficient detail to support mine planning and evaluation of the economic viability of the deposit. Geological evidence is derived from adequately detailed and reliable exploration, sampling and testing and is sufficient to assume geological and grade or quality continuity between points of observation. An inferred mineral resource is that part of a mineral resource for which quantity and grade or quality are estimated on the basis of limited geological evidence and sampling. Geological evidence is sufficient to imply but not verify geological and grade or quality continuity. Investors are cautioned not to assume that part or all of an inferred resource exists, or is economically or legally mineable. A feasibility study is a comprehensive technical and economic study of the selected development option for a mineral project that includes appropriately detailed assessments of applicable modifying factors together with any other relevant operational factors and detailed financial analysis that are necessary to demonstrate, at the time of reporting, that extraction is reasonably justified (economically mineable). The results of the study may reasonably serve as the basis for a final decision by a proponent or financial institution to proceed with, or finance, the development of the project. The confidence level of the study will be higher than that of a Pre-Feasibility Study. The effective date for all of the Company's mineral resource and reserve estimates in this presentation is December 31, 2014, other than Amaruq, which is at June 30, 2015. Additional information about each of the mineral projects that is required by NI 43-101, sections 3.2 and 3.3 and paragraphs 3.4 (a), (c) and (d) can be found in the Technical Reports filed by Agnico Eagle, which may be found at www.sedar.com. Other important operating information can be found in the Company's AIF and Form 40-F. The scientific and technical information contained herein has been approved by Daniel Doucet, Senior Corporate Director, Reserve Development, and/or Alain Blackburn, Senior Vice-President, Exploration. Both Mr. Doucet and Mr. Blackburn are designated Ing. with the Ordre des ingenieurs du Québec and qualified persons as defined by NI 43-101.
  • 41.
    Trading Symbol: AEM onTSX & NYSE Investor Relations: 416-947-1212 info@agnicoeagle.com agnicoeagle.com