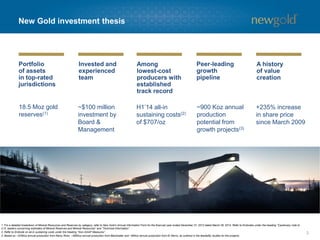
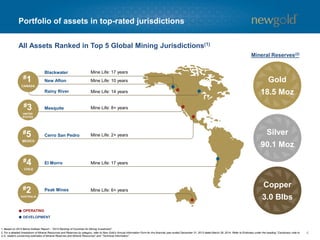
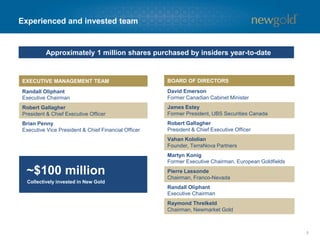
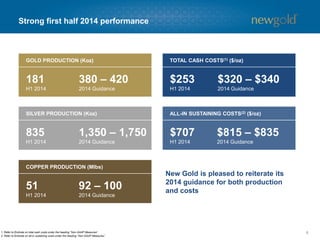
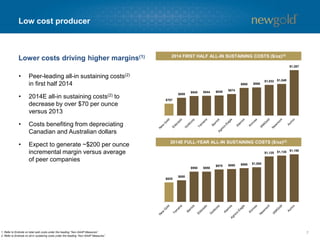
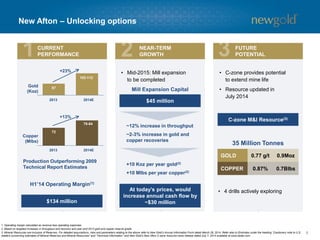
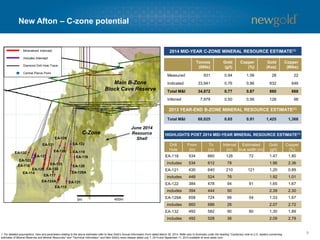
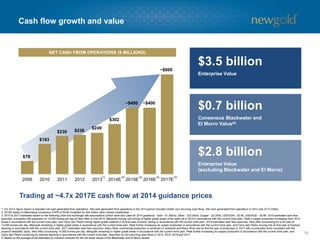
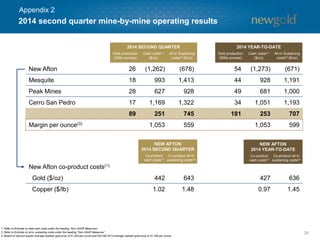
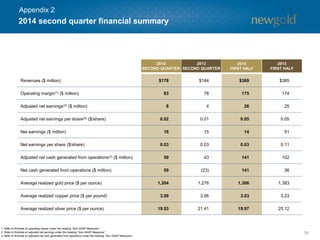
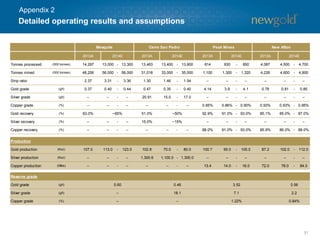
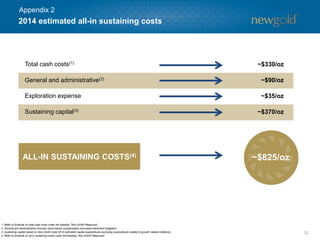
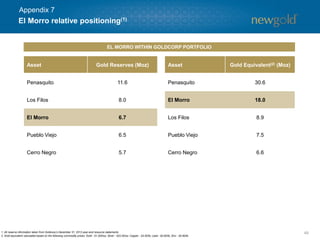
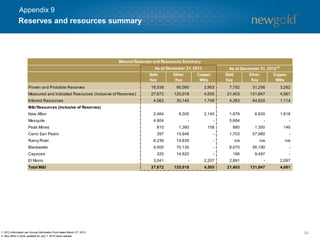
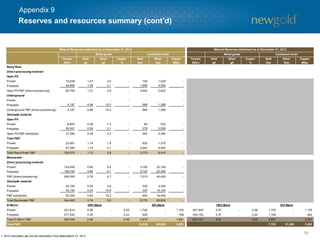
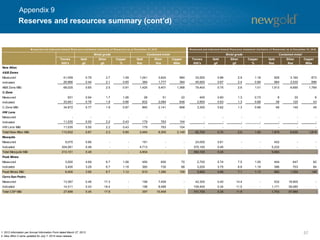
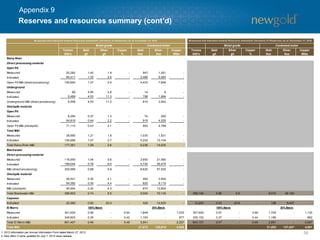
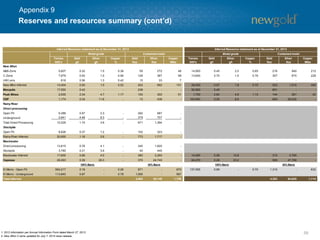
Denver Gold ForumSeptember 2014
Cautionary statements 
2 
All monetary amounts in U.S. dollars unless otherwise stated 
Total cash costs shown net of by-product sales unless otherwise stated 
CAUTIONARY NOTE REGARDING FORWARD-LOOKING STATEMENTS 
Certaininformationcontainedinthispresentation,includinganyinformationrelatingtoNewGold’sfuturefinancialoroperatingperformanceare“forwardlooking”.Allstatementsinthispresentation, otherthanstatementsofhistoricalfact,whichaddresseventsordevelopmentsthatNewGoldexpectstooccurare“forward-lookingstatements”.Forward-lookingstatementsarestatementsthatarenothistoricalfactsandaregenerally,butnotalways,identifiedbytheuseofforward-lookingterminologysuchas“plans”,“expects”,“isexpected”,“budget”,“scheduled”,“targeted”,“estimates”, “forecasts”,“intends”,“anticipates”,“projects”,“potential”,“believes”orvariationsofsuchwordsandphrasesorstatementsthatcertainactions,eventsorresults“may”,“could”,“would”,“should”, “might”or“willbetaken”,“occur”or“beachieved”orthenegativeconnotationofsuchterms.Forward-lookingstatementsinthispresentationinclude,amongothers,statementswithrespectto: guidanceforproduction,cashcostsandall-insustainingcosts;theresultsoftheRainyRiverFeasibilityStudy,includingtheexpectedproduction,costs,grades,plannedactivitiesforeachofthecompany’sprojects;andtargetedthroughputincreaseatNewAfton,targetedtimingforcommissioningandfullproductionrelatedtotheNewAftonmillexpansion,RainyRiverandsequencingofBlackwater. 
Allforward-lookingstatementsinthispresentationarebasedontheopinionsandestimatesofmanagementasofthedatesuchstatementsaremadeandaresubjecttoimportantriskfactorsanduncertainties,manyofwhicharebeyondNewGold’sabilitytocontrolorpredict.Certainmaterialassumptionsregardingourforward-lookingstatementsarediscussedinthispresentation,NewGold’smostrecentMD&A,itsAnnualInformationFormanditsTechnicalReportsfiledatwww.sedar.com.Inadditionto,andsubjectto,suchassumptionsdiscussedinmoredetailelsewhere,theforward-lookingstatementsinthispresentationarealsosubjecttothefollowingassumptions:(1)therebeingnosignificationdisruptionsaffectingNewGold’soperations;(2)politicalandlegaldevelopmentsinjurisdictionswhereNewGoldoperates,ormayinthefutureoperate,beingconsistentwithNewGold’scurrentexpectations;(3)theaccuracyofNewGold’scurrentmineralreserveandresourceestimates;(4)theexchangeratebetweentheCanadiandollar,Australiandollar,MexicanPesoandU.S.dollarbeingapproximatelyconsistentwithcurrentlevels;(5)pricesfordiesel, naturalgas,fueloil,electricityandotherkeysuppliesbeingapproximatelyconsistentwithcurrentlevels;(6)labourandmaterialcostsincreasingonabasisconsistentwithNewGold’scurrentexpectations;(7)permittingandarrangementswithFirstNationsandotherAboriginalgroupsinrespectofRainyRiverandBlackwaterbeingconsistentwithNewGold’scurrentexpectations;(8)allenvironmentalapprovals(includingtheenvironmentalassessmentprocessfortheBlackwaterandRainyRiverprojects),requiredpermits,licensesandauthorizationsbeingobtainedfromtherelevantgovernmentsandotherrelevantstakeholderswithintheexpectedtimelines;and(9)theresultsofthefeasibilitystudiesfortheRainyRiverandBlackwaterprojectsbeingrealized. 
Forward-lookingstatementsarenecessarilybasedonestimatesandassumptionsthatareinherentlysubjecttoknownandunknownrisks,uncertaintiesandotherfactorsthatmaycauseactualresults,levelofactivity,performanceorachievementstobemateriallydifferentfromthoseexpressedorimpliedbysuchforward-lookingstatements.Suchfactorsinclude,withoutlimitation: significantcapitalrequirements;pricevolatilityinthespotandforwardmarketsforcommodities;fluctuationsintheinternationalcurrencymarketsandintheratesofexchangeofthecurrenciesofCanada,theUnitedStates,Australia,MexicoandChile;discrepanciesbetweenactualandestimatedproduction,betweenactualandestimatedreservesandresourcesandbetweenactualandestimatedmetallurgicalrecoveries;changesinnationalandlocalgovernmentlegislationinCanada,theUnitedStates,Australia,MexicoandChileoranyothercountryinwhichNewGoldcurrentlyormayinthefuturecarryonbusiness;taxation;controls,regulationsandpoliticaloreconomicdevelopmentsinthecountriesinwhichNewGolddoesormaycarryonbusiness;thespeculativenatureofmineralexplorationanddevelopment,includingtherisksofobtainingandmaintainingthevalidityandenforceabilityofthenecessarylicensesandpermitsandcomplyingwiththepermittingrequirementsofeachjurisdictioninwhichNewGoldoperates,including,butnotlimitedto:inCanada,obtainingthenecessarypermitsfortheBlackwaterandRainyRiverprojects;inMexico,whereCerroSanPedrohasahistoryofongoinglegalchallengesrelatedtoourenvironmentalauthorization(EIS);andinChile,certainactivitiesbyElMorrohavebeendelayedduetolitigationrelatingtoitsenvironmentalpermit;thelackofcertaintywithrespecttoforeignlegalsystems,whichmaynotbeimmunefromtheinfluenceofpoliticalpressure,corruptionorotherfactorsthatareinconsistentwiththeruleoflaw;theuncertaintiesinherenttocurrentandfuturelegalchallengesNewGoldisormaybecomeapartyto;diminishingquantitiesorgradesofreservesandresources;competition;lossofkeyemployees;additionalfundingrequirements;risingcostsoflabour,supplies,fuelandequipment;actualresultsofcurrentexplorationorreclamationactivities; uncertaintiesinherenttominingeconomicstudiesincludingthefeasibilitystudiesforRainyRiverandBlackwater;theuncertaintywithrespecttoprevailingmarketconditionsnecessaryforapositivedevelopmentdecisionatBlackwater;changesinprojectparametersasplanscontinuetoberefined;accidents;labourdisputes;defectivetitletomineralclaimsorpropertyorcontestsoverclaimstomineralproperties;unexpecteddelaysandcostsinherenttoconsultingandaccommodatingrightsofFirstNationsandotherAboriginalgroups;uncertaintieswithrespecttoobtainingallnecessarysurfaceandotherlanduserightsortenureforRainyRiver;risks,uncertaintiesandunanticipateddelaysassociatedwithobtainingandmaintainingnecessarylicenses,permitsandauthorizationsandcomplyingwithpermittingrequirements,includingthoseassociatedwiththeenvironmentalassessmentprocessesforBlackwaterandRainyRiver.Inaddition,therearerisksandhazardsassociatedwiththebusinessofmineralexploration,developmentandmining,includingenvironmentaleventsandhazards,industrialaccidents,unusualorunexpectedformations,pressures,cave- ins,floodingandgoldbullionlosses(andtheriskofinadequateinsuranceorinabilitytoobtaininsurancetocovertheserisks)aswellas“RiskFactors”includedinNewGold’sdisclosuredocumentsfiledonandavailableatwww.sedar.com. 
Forward-lookingstatementsarenotguaranteesoffutureperformance,andactualresultsandfutureeventscouldmateriallydifferfromthoseanticipatedinsuchstatements.Alloftheforward- lookingstatementscontainedinthispresentationarequalifiedbythesecautionarystatements.NewGoldexpresslydisclaimsanyintentionorobligationtoupdateorreviseanyforward-lookingstatementswhetherasaresultofnewinformation,eventsorotherwise,exceptinaccordancewithapplicablesecuritieslaws. 
Thefootnotesandendnotestothispresentationcontainimportantinformation.Theendnotesarefoundattheendofthepresentation.
Portfolio of assetsin top-ratedjurisdictions 
Invested and experienced team 
Amonglowest-cost producers with established track record 
Peer-leading growth pipeline 
A history of value creation 
New Gold investment thesis 
3 
18.5 Moz gold reserves(1) 
~$100 million investment by Board & Management 
H1’14 all-in sustaining costs(2) of $707/oz 
~900 Kozannual production potential from growth projects(3) 
+235% increase in share price since March 2009 
1.For a detailed breakdown of Mineral Resources and Reserves by category, refer to New Gold’s Annual Information Form for the financial year ended December 31, 2013 dated March 28, 2014. Refer to Endnotes under the heading “Cautionary note to U.S. readers concerning estimates of Mineral Reserves and Mineral Resources” and “Technical Information”. 
2.Refer to Endnote on all-in sustaining costs under the heading “Non-GAAP Measures”. 
3.Based on ~325Koz annual production from Rainy River, ~485Koz annual production from Blackwater and ~90Koz annual production from ElMorro, as outlined in the feasibility studies for the projects. 
1.For a detailed breakdown of Mineral Resources and Reserves by category, refer to New Gold’s Annual Information Form for the financial year ended December 31, 2013 dated March 28, 2014. Refer to Endnotes under the heading “Cautionary note to U.S. readers concerning estimates of Mineral Reserves and Mineral Resources” and “Technical Information”. 
2.Refer to Endnote on all-in sustaining costs under the heading “Non-GAAP Measures”. 
3.Based on ~325Koz annual production from Rainy River, ~485Koz annual production from Blackwater and ~90Koz annual production from ElMorro, as outlined in the feasibility studies for the projects.
Portfolio of assets in top-rated jurisdictions 
Blackwater 
New Afton 
Rainy River 
Mesquite 
Cerro San Pedro 
El Morro 
Peak Mines 
Mine Life: 17 years 
Mine Life: 10 years 
Mine Life: 14 years 
Mine Life: 8+ years 
Mine Life: 2+ years 
Mine Life: 17 years 
Mine Life: 6+ years 
#1 
CANADA 
#3 
UNITED 
STATES 
#5 
MEXICO 
#4 
CHILE 
#2 
AUSTRALIA 
OPERATING 
DEVELOPMENT 
4 
All Assets Ranked in Top 5 Global Mining Jurisdictions(1) 
1. Based on 2014 BehreDolbearReport –“2014 Ranking of Countries for Mining Investment”. 
2. For a detailed breakdown of Mineral Resources and Reserves by category, refer to New Gold’s Annual Information Form for the financial year ended December 31, 2013 dated March 28, 2014. Refer to Endnotes under the heading “Cautionary note to U.S. readers concerning estimates of Mineral Reserves and Mineral Resources” and “Technical Information”. 
Gold 
18.5 Moz 
Silver 
90.1 Moz 
Copper 
3.0 Blbs 
Mineral Reserves(2)
Experienced and invested team 
5 
BOARD OF DIRECTORS 
David EmersonFormer Canadian Cabinet Minister 
James EsteyFormer President, UBS Securities Canada 
Robert GallagherPresident & Chief ExecutiveOfficer 
VahanKololianFounder, TerraNovaPartners 
MartynKonigFormer Executive Chairman, European Goldfields 
Pierre LassondeChairman, Franco-Nevada 
Randall OliphantExecutive Chairman 
Raymond ThrelkeldChairman, NewmarketGold 
EXECUTIVE MANAGEMENT TEAM 
RandallOliphant 
Executive Chairman 
Robert GallagherPresident & Chief ExecutiveOfficer 
Brian PennyExecutive Vice President & Chief Financial Officer 
Approximately 1 million shares purchased by insiders year-to-date 
~$100 million 
Collectively invested in New Gold
6 
1. Refer to Endnote on total cash costs under the heading “Non-GAAP Measures”. 
2. Refer to Endnote on all-in sustaining costs under the heading “Non-GAAP Measures”. 
Strong first half 2014 performance 
New Gold is pleased to reiterate its 2014 guidance for both production and costs 
GOLD PRODUCTION (Koz) 
181H1 2014 
380 –4202014 Guidance 
SILVER PRODUCTION (Koz) 
835H1 2014 
1,350 –1,7502014 Guidance 
COPPER PRODUCTION (Mlbs) 
51H1 2014 
92 –1002014 Guidance 
TOTAL CASH COSTS(1)($/oz) 
$253H1 2014 
$320 –$3402014 Guidance 
ALL-IN SUSTAINING COSTS(2)($/oz) 
$707H1 2014 
$815 –$8352014 Guidance
Low cost producer 
•Peer-leading all-in sustaining costs(2) in first half 2014 
•2014E all-in sustaining costs(2)to decrease by over $70 per ounce versus 2013 
•Costs benefiting from depreciating Canadian and Australian dollars 
•Expect to generate ~$200 per ounce incremental margin versus average of peer companies 
7 
Lower costs driving higher margins(1) 
1. Refer to Endnote on total cash costs under the heading “Non-GAAP Measures”. 
2. Refer to Endnote on all-in sustaining costs under the heading “Non-GAAP Measures”. 
2014 FIRST HALF ALL-IN SUSTAINING COSTS ($/oz)(2) 
2014E FULL-YEAR ALL-IN SUSTAINING COSTS ($/oz)(2) 
$707 
$809 
$840 
$844 
$849 
$874 
$980 
$988 
$1,032 
$1,048 
$1,287 
$825 
$850 
$950 
$950 
$975 
$980 
$990 
$1,000 
$1,125 
$1,135 
$1,150
8 
New Afton –Unlocking options 
87 
102-112 
Gold (Koz) 
72 
78-84 
Copper (Mlbs) 
2013 
2014E 
2013 
2014E 
+23% 
+13% 
•C-zone provides potential to extend mine life 
•Resource updated in July 2014 
•4 drills actively exploring 
C-zone M&I Resource(3) 
35 Million Tonnes 
H1’14 Operating Margin(1) 
$45 million 
~12% increase in throughput 
~2-3% increase in gold and copper recoveries 
+10 Kozper year gold(2) 
+10 Mlbsper year copper(2) 
1. Operating margin calculated as revenue less operating expenses. 
2. Based on targeted increases in throughput and recovery and year-end 2013 gold and copper reserve grade. 
3. Mineral Resources are inclusive of Reserves. For detailed assumptions, risks and parameters relating to the above refer to New Gold’s Annual Information Form dated March 28, 2014. Refer also to Endnotes under the heading “Cautionary note to U.S. readers concerning estimates of Mineral Reserves and Mineral Resources” and “Technical Information” and New Gold’s New Afton C-zone resource news release dated July 7, 2014 available at www.sedar.com. 
Production Outperforming 2009 Technical Report Estimates 
Mill Expansion Capital 
CURRENT 
PERFORMANCE 
NEAR-TERM 
GROWTH 
FUTURE 
POTENTIAL 
•Mid-2015: Mill expansion to be completed 
At today’s prices, would increase annual cash flow by 
~$30 million 
$134 million 
GOLD 
0.77 g/t 
0.9Moz 
COPPER 
0.87% 
0.7Blbs
New Afton –C-zone potential 
9 
Tonnes (000s) 
Gold 
(g/t) 
Copper 
(%) 
Gold 
(Koz) 
Copper 
(Mlbs) 
Measured 
931 
0.94 
1.06 
28 
22 
Indicated 
33,941 
0.76 
0.86 
832 
646 
Total M&I 
34,872 
0.77 
0.87 
860 
668 
Inferred 
7,979 
0.50 
0.56 
128 
98 
Total M&I 
68,025 
0.65 
0.91 
1,425 
1,368 
2014 MID-YEAR C-ZONE MINERAL RESOURCE ESTIMATE(1) 
1. For detailed assumptions, risks and parameters relating to the above estimates refer to New Gold’s Annual Information Formdated March 28, 2014. Refer also to Endnotes under the heading “Cautionary note to U.S. readers concerning estimates of Mineral Reserves and Mineral Resources” and “Technical Information” and New Gold’s news release dated July 7, 2014 and September 11, 2014 available at www.sedar.com. 
2013 YEAR-END B-ZONE MINERAL RESOURCE ESTIMATE(1) 
Drill 
Hole 
From 
(m) 
To 
(m) 
Interval 
(m) 
Estimated true width (m) 
Gold (g/t) 
Copper (%) 
EA-118 
534 
660 
126 
72 
1.47 
1.80 
includes 
534 
612 
78 
1.96 
2.36 
EA-121 
430 
640 
210 
121 
1.20 
0.89 
includes 
448 
524 
76 
1.92 
1.01 
EA-122 
384 
478 
94 
91 
1.65 
1.67 
includes 
394 
444 
50 
2.39 
2.30 
EA-129A 
658 
724 
66 
54 
1.33 
1.67 
includes 
660 
686 
26 
2.07 
2.72 
EA-132 
492 
582 
90 
80 
1.30 
1.89 
includes 
492 
528 
36 
2.09 
2.78 
HIGHLIGHTS POST 2014 MID-YEAR MINERAL RESOURCE ESTIMATE(1) 
Mineralized Intercept 
Includes Intercept 
Diamond Drill Hole Trace 
Central Pierce Point 
EA-132 
EA-123 
EA-114 
EA-118 
EA-127 
EA-121 
EA-126 
EA-128 
EA-133 
EA-125 
EA-124A 
EA-131 
EA-115 
EA-129A 
EA-120 
EA-116 
EA-122 
EA-119 
EA-117 
C-Zone 
Main B-Zone 
Block Cave Reserve 
June 2014 
Resource Shell 
0m 
400m 
EA-130
10 
Rainy River –Project overview 
1. Based on 2014 BehreDolbearReport –“2014 Ranking of Countries for Mining Investment”. 
2. Mineral Resources are inclusive of Reserves. For a detailed breakdown of Mineral Resources and Reserves by category, refer to New Gold’sAnnual Information Form for the financial year ended December 31, 2013 dated March 28, 2014. Refer to Endnotes under the heading “Cautionary note to U.S. readers concerning estimates of Mineral Reserves and Mineral Resources” and “Technical Information”. 
3. Refer to Endnote on total cash costs under the heading “Non-GAAP Measures”. 
4. Refer to Endnote on all-in sustaining costs under the heading “Non-GAAP Measures”. 
1.44 g/t 
~325 Koz 
$613/oz 
$736/oz 
FIRST NINE YEARS –GRADE, PRODUCTION, COSTS 
JURISDICTION 
MANAGEABLE CAPITAL 
RESOURCE SCALE AND POTENTIAL 
Ontario, Canada 
17km tie-in to power/ close to regional infrastructure 
•$885 million at $0.95 US$/C$ exchange rate 
•~70% of capital denominated in Canadian dollars 
Reserves(2)+3.8 Moz 
M&I Resources(2)+6.2 Moz 
Land Package +169 km2 
Average 
Head Grade 
Average Annual Production 
Average Total 
Cash Costs(3) 
Average All-in Sustaining Costs(4) 
Country Ranking(1) 
$0.05 change in exchange rate ~$141 million in pre-tax NAV 
#1
11 
Rainy River –Progress milestones 
2014 
2015 
2016 
Q1 
Q2 
Q3 
Q4 
Q1 
Q2 
Q3 
Q4 
Q1 
Q2 
Q3 
Q4 
Complete FeasibilityStudy 
Submit Environmental Assessment Report 
Order Long LeadEquipment 
Award EPCMContract 
Detailed Engineering & Procurement 
ProvincialEnvironmental Assessment Approval 
Federal Environmental Assessment Approval 
Deliveryof Mobile Equipment 
Power LineConstruction 
Process Plant Construction 
Tailings & Water Management Facilities Construction 
CommencePre-Strip & Pit Development 
Commissioning 
Targeted milestones 
1. Near-term milestones based on company plans which are consistent with timelines presented in the Rainy River Technical Report, entitled “Feasibility Study of the Rainy River Project, Ontario, Canada” dated February 14, 2014 and available on SEDAR. 
2017 –First full year of production
12 
Rainy River –Progress update 
Project Development Capital Costs 
Description 
Cost ($ million) 
Direct Costs 
Process Equipment 
$127 
Process Facilities –Construction 
$170 
Site Development 
$111 
OpenPit Mine Equipment 
$81 
Overburdenand Waste Stripping 
$80 
Tailingsand Water Management 
$48 
Power Line and Roads 
$21 
Total Direct Capital Costs 
$638 
Owner's and Indirect Costs 
Owner's Costs 
$76 
EPCM 
$48 
Other Indirects 
$53 
Total Owner's&Indirect Capital Costs 
$177 
Subtotal 
$815 
Contingency 
$70 
Total Project (at US$/C$-0.95) 
$885 
43% of pricing locked in 
98% of pricing locked in 
AMEC engaged as EPCM partner 
1. Project development capital costs based on Rainy River Technical Report, entitled “Feasibility Study of the Rainy River Project, Ontario, Canada” dated February 14, 2014 and available on SEDAR. 
~70% of capital costs denominated in Canadian dollars
13 
Rainy River –Value creation through development 
INVESTMENT 
VALUE POTENTIAL 
$300million 
Acquisition cost 
50%/ 
Cash 
50% 
Shares 
$885million 
Development capital estimate(1) 
$1.2billion 
Total investment 
Average annual after-tax cash flow(2)(4) 
Potential cash flow multiple range(3) 
Implied value potential 
$215million 
10-12x 
Development of Rainy River presents opportunity for $1.0 -$1.4 billion 
of potential value creation 
$2.2-$2.6billion 
1. Based on $0.95 US$/C$ foreign exchange rate. 
2. Based on first five years at $1,300 per ounce gold, $22 per ounce silver and $0.95 US$/C$ foreign exchange rate. 
3. Potential multiple range based on New Gold’s current P/2014E CFPS multiple. 
4. Based on the Technical Report on Feasibility Study for the Rainy River Project dated effective January 16, 2014.
Blackwater 
14 
UPSIDE 
GOLD RESOURCE 
British Columbia, Canada 
BLACKWATER 
Regional Upside 
Significant Gold Resource 
Jurisdiction 
#1 
Country Ranking(1) 
~1,100 km2Land Package 
Initial resource at Capoose 
Multiple newly identified targets 
1. Based on 2014 BehreDolbearReport –“2014 Ranking of Countries for Mining Investment”. 
2. Development capital assumes $0.95 USD/CDN exchange rate. 
3. Refer to Endnote on total cash costs under the heading “Non-GAAP Measures”. Total cash costs assume: Gold -$1,300/oz, Silver -$22.00/oz, USD/CDN -$0.95. 
4. Refer to Endnote on all-in sustaining costs under the heading “Non-GAAP Measures”. All-in sustaining costs assume: Gold -$1,300/oz, Silver -$22.00/oz, USD/CDN -$0.95. 
5. Mineral Resources are inclusive of Reserves. For a detailed breakdown of Mineral Resources and Reserves by category, refer to New Gold’s Annual Information Form for the financial year ended December 31, 2013 dated March 28, 2014. Refer to Endnotes under the heading “Cautionary note to U.S. readers concerning estimates of Mineral Reserves and Mineral Resources” and “Technical Information”. 
2013 Feasibility Study 
First nine years: 
485 Koz 
Annual Production 
~$1,865 million 
Development Capital(2) 
$555/oz 
Total Cash Costs(3) 
$685/oz 
All-in Sustaining Costs(4) 
$0.05 change in exchange rate ~$270 million in pre-tax NAV 
8.2 Moz 
Reserves(5) 
17-year 
Mine Life 
9.5 Moz M&I Resources(5)
15 
Blackwater –Value creation through development 
INVESTMENT 
VALUE POTENTIAL 
$630million 
100% 
Shares 
$1,865million 
Development capital estimate(1) 
Potential cash flow multiple range(3) 
$375million 
Development of Blackwater presents opportunity for $1.3 -$2.0 billion 
of potential value creation 
1. Based on $0.95 US$/C$ foreign exchange rate. 
2. Based on first five years at $1,300 per ounce gold, $22 per ounce silver and $0.95 US$/C$ foreign exchange rate. 
3. Potential multiple range based on New Gold’s current P/2014E CFPS multiple. 
4. Based on the Technical Report on Feasibility Study for the Blackwater Project dated effective January 16, 2014. 
Average annual after-tax cash flow(2)(4) 
Acquisition cost 
$2.5billion 
Total investment 
Implied value potential 
$3.8-$4.5billion 
10-12x
El Morro 
16 
Chile 
EL MORRO 
Unique Joint Venture Structure 
Gold/Copper Reserve & Resources (30%) 
Jurisdiction 
2011 Feasibility Study (30%) 
#4 
Country Ranking(1) 
Goldcorp 70% partner 
Funds 100% of capital 
New Gold retains portion of cash flow from mine start-up 
2.7 Moz@ 0.5 g/t 
Gold 
2.0 Blbs@ 0.5% Copper 
Life of mine: 
1. Based on 2014 BehreDolbearReport –“2014 Ranking of Countries for Mining Investment”. 
2. Refer to Endnote on total cash costs under the heading “Non-GAAP Measures”. Total cash costs assume: Gold -$1,200/oz, Copper -$2.75/lb, Chilean Peso/USD -$550. 
3. For a detailed breakdown of Mineral Resources and Reserves by category, refer to New Gold’s Annual Information Form for the financial year ended December 31, 2013 dated March 28, 2014. Refer to Endnotes under the heading “Cautionary note to U.S. readers concerning estimates of Mineral Reserves and Mineral Resources” and “Technical Information”. 
Reserves(3)– 
Open Pit 
Inferred Resources(3)– Potential Block Cave 
1.1 Moz@ 1.0 g/t 
Gold 
0.6 Blbs@ 0.8% Copper 
85 Mlbs 
Annual Copper Production 
($700/oz) 
Total Cash Costs(2) 
90 Koz 
Annual Gold Production
17 
Organic pipeline 
•Mesquite return to run rate (2015+) 
•New Afton expansion (mid-2015) 
•Rainy River development (2015/2016) 
•CSP to residual leaching (2016) 
Existing low cost production base to be further enhanced by our lower cost development projects(1) 
•Sequence Blackwaterdevelopment 
•El Morro advanced 
GOLD PRODUCTION 
1. Refer to Endnote on all-in sustaining costs under the heading “Non-GAAP Measures”. Rainy River and Blackwater life-of-mine all-in sustaining costs are estimated to be $736/oz and $685/oz, respectively, based on their respective Feasibility Studies. 
2. Based on mid-point of 2014 guidance. 
3. Based on expected annual production from current operations according to their respective mine plans, including positive production impact of New Afton’s mill expansion targeted for mid-2015, Mesquite mine plan moving into grades more in line with reserve grade, which is partially offset by Cerro San Pedro ceasing active mining and moving into residual leaching, and includes the first year of full production from Rainy River. Assumes on-time completion of Rainy River. 
4. Based on ~325Koz annual production from Rainy River, ~485Koz annual production from Blackwater and ~90Koz annual production from ElMorro as outlined in the Feasibility Studies for these projects, and production contribution from New Afton, Mesquite and the Peak Mines according to their respective mine plans. Assumes the timely development of Blackwater and El Morro. 
2014(2) 
2017(3) 
FuturePotential(4)
2009 
2010 
2011 
2012 
2013 
2014E 
2015E 
2016E 
2017E 
18 
Cash flow growth and value 
1. For 2013, figure shown is Adjusted net cash generated from operations. Net cash generated from operations in the 2013 period included certain non-recurring cash flows. Net cash generated from operations in 2013 was $172 million. 
2. 2014E based on Bloomberg consensus CFPS of $0.60 multiplied by 504 million basic shares outstanding. 
3. 2015 to 2017 estimates based on the following price and exchange rate assumptions (which were also used for 2014 guidance): Gold -$1,300/oz, Silver -$22.00/oz, Copper -$3.25/lb, USD/CDN -$0.90, USD/AUD -$0.88. 2015 estimated cash flow assumes: successful mill expansion to 14,000 tonnesper day at New Afton in mid-2015, Mesquite moving into mining of higher grade areas of the open pit in 2015 in accordance with the current mine plan, Peak’s copper production increasing from 2014 levels in accordance with the current mine plan, and Cerro San Pedro mining higher grade material in its final year of activemining in accordance with the current mine plan. 2016 estimated cash flow assumes: New Afton processing for a full year at 14,000 tonnesper day, Mesquite remaining in higher grade areas in accordance with the current mine plan, Peak further increasing its copper production in accordance with the current mine plan, and Cerro San Pedro moving into its first year of residual leaching in accordance with the current mine plan. 2017 estimated cash flow assumes: Rainy River commercial production is achieved on schedule and Rainy River has its first full year of production in 2017with a production level consistent with the project’s feasibility study, New Afton processing 14,000 tonnesper day, Mesquite remaining in higher grade areas in accordance with the current mine plan, Peak further increasing its copper production in accordance with the current mine plan, and Cerro San Pedro continuing its residual leaching in accordance with the current mine plan. Assumes no non-recurring cash flows in 2014, 2015, 2016 and 2017. 
4. Based on the average of the estimates by research analysts for the net asset values of the Blackwater and El Morro assets. 
NET CASH FROM OPERATIONS ($ MILLIONS) 
Trading at ~4.7x 2017E cash flow at 2014 guidance prices 
(2) 
(3) 
(3) 
(1) 
(3) 
$3.5 billion 
Enterprise Value 
$0.7 billion 
Consensus Blackwater and El Morro Value(4) 
$2.8 billion 
Enterprise Value (excluding Blackwater and El Morro) 
$79 
$230 
$183 
$236 
$249 
$302 
~$400 
~$400 
~$600
Catalysts 
19 
2014 costs declining versus 2013 
New Afton production and cash flow continues to increase 
New Afton C-zone exploration 
Rainy River regional exploration 
Blackwater regional exploration 
Rainy River permitting 
Blackwater permitting 
C-zone engineering study 
New Afton mill expansion 
Cash flow growth
A history of value creation 
Performance since March 2009 New Gold/Western Goldfields merger announcement 
20 
S&P/TSX Global Gold Index(1) 
Gold Price 
New Gold (NYSE) 
1. S&P/TSX Global Gold Index includes 37 gold companies in various stages of development/production. 
237% 
37% 
(27%)
New Gold investment thesis 
21 
A history of value creation 
Peer-leading 
growth pipeline 
Amonglowest-cost producers with established track record 
Invested and experienced team 
Portfolio of assetsin top-ratedjurisdictions 
Establishing the leading intermediate gold company
Appendices 
22 
Appendices 
Page 
1.Financial information23 
2.Consolidated operating performance28 
3.New Afton34 
4.Mesquite, Peak Mines, Cerro San Pedro 42 
5.Rainy River45 
6.Blackwater46 
7.El Morro47 
8.Exploration50 
9.Reserves and Resources notes54 
10.Commodity price/foreign exchange assumptions63
$414 mm 
$256 mm 
Liquidity Position 
$670 mm 
Cash and Equivalents(1) 
Undrawn Credit Facility(2) 
Strong balance sheet 
23 
1. Cash and equivalents as at June 30, 2014. 
2. $44 million of total $300 million at August 14, 2014 used for Letters of Credit. 
3. See Appendix 1 –Summary of debt for detailed breakdown of components of debt. 
•Face value $886 million in long-term debt(3) 
•Face value $300 million, 7.00% notes due in 2020 
•Face value $500 million, 6.25% notes due in 2022 
•$86 million in carried El Morro loan, payable out of El Morro project cash flow 
Appendix 1
Summary of debt 
24 
Undrawn CreditFacility 
SeniorUnsecured Notes (April 2012) 
SeniorUnsecured Notes (November 2012) 
El Morro Funding Loan 
Face Value 
$300 million(1) 
$300million 
$500 million 
$86million 
Maturity 
4 years with annual extensions permitted 
April 15, 2020 
November 15, 2022 
n/a 
Interest Rate 
See ‘Key features’ 
7.00% 
6.25% 
4.58% 
Payable 
Revolving credit 
Semi-annually 
Semi-annually 
Uponstart of production 
Conversion price 
n/a 
n/a 
n/a 
n/a 
Current trading value 
n/a 
~107 
~105 
n/a 
Key features 
•Normal financial covenants 
Interest Rate 
•2.00-3.25% over LIBOR based on ratios 
•Standby fee of 0.45- 0.73% 
•Senior unsecured 
•Redeemableafter April 15, 2016 at 103.5% down to 100% of face after 2018 
•Unlimited dividends if leverage ratio below 2:1 
•Senior unsecured 
•Redeemable after November 15, 2017 at par plus half coupon,declining ratably to par 
•Unlimited dividends if leverage ratio below 2:1 
New Goldto repay Goldcorp out of 80% of its 30% share of cash flow once El Morro starts production 
1. $44 million of total $300 million at August 14, 2014 used for Letters of Credit. 
Appendix 1
25 
2014 capital expenditures by category 
New Afton 
~$340 million 
Sustaining Capital: ~$145 million 
Growth Capital: ~$195 million 
Mesquite 
Peak Mines 
Cerro San Pedro 
Rainy River 
New Afton 
Cerro San Pedro 
Blackwater 
Total Capital 
Appendix 1 
•H1’14 -$54 million 
•H1’14 -$63 million
26 
Growth capital 
•Set out below is a breakdown of expected 2014 capital expenditures at each site divided into two categories –sustaining capital and growth capital (future production growth and mine life extension) 
New Afton -$115 million 
Rainy River -$105 million 
Mesquite -$40 million 
Sustaining capital 
48% 
52% 
100% 
100% 
•$60 million –~2,500 metredevelopment, two new trucks, dam raise and surface ventilation upgrade 
•$35 million –mill expansion 
•$20 million –C-zone scoping level engineering and capitalized exploration 
•$60 million –property, plant and equipment 
•$35 million –detailed engineering, studies, environmental monitoring and permitting 
•$10 million –capitalized exploration 
•$28 million –four new trucks and leach pad expansion 
•$12 million –major components/building and tank construction 
2014 capital expenditures by category 
Appendix 1
27 
Peak Mines -$40 million 
Cerro San Pedro -$28 million 
100% 
71% 
•$20 million –two haul trucks and site maintenance 
•$20 million –capitalized development and capitalized exploration 
•$20 million –capitalized stripping 
•$8 million –leach pad expansion 
2014 capital expenditures by category 
Growth capital 
Sustaining capital 
New Gold’s 30% share of estimated 2014 El Morro capital costs of 
$6 million fully carried by Goldcorp Inc. 
Blackwater -$15 million 
100% 
•$10 million –permitting 
•$5 million –engineering studies 
29% 
Appendix 1
New Afton 
26 
(1,262) 
(678) 
54 
(1,273) 
(671) 
Mesquite 
18 
993 
1,413 
44 
928 
1,191 
Peak Mines 
28 
627 
928 
49 
681 
1,000 
Cerro SanPedro 
17 
1,169 
1,322 
34 
1,051 
1,193 
89 
251 
745 
181 
253 
707 
Margin per ounce(3) 
1,053 
559 
1,053 
599 
New Afton co-product costs(1) 
Gold ($/oz) 
442 
643 
427 
636 
Copper($/lb) 
1.02 
1.48 
0.97 
1.45 
28 
1. Refer to Endnote on total cash costs under the heading “Non-GAAP Measures”. 
2. Refer to Endnote on all-in sustaining costs under the heading “Non-GAAP Measures”. 
3. Based on second quarter average realized gold price of $1,304 per ounce and first half 2014 average realized gold price of$1,306 per ounce. 
2014 SECOND QUARTER 
Gold production 
(000s ounces) 
Cash costs(1) ($/oz) 
All-in Sustaining costs(2) ($/oz) 
2014 YEAR-TO-DATE 
Gold production 
(000s ounces) 
Cash costs(1) ($/oz) 
All-in Sustaining costs(2) ($/oz) 
Co-product 
cash costs(1) 
Co-product all-in sustaining costs(2) 
NEW AFTON 
2014 SECOND QUARTER 
Co-product 
cash costs(1) 
Co-product all-in sustaining costs(2) 
NEW AFTON 
2014 YEAR-TO-DATE 
2014 second quarter mine-by-mine operating results 
Appendix 2
$465 
$418 
$446 
$421 
$377 
$320 - $340 
$478 
$557 
$643 
$766 $767 
29 
Among lowest cost producers in industry 
Industry 
New Gold 
2014E 
Incremental 
Benefit to NGD 
Shareholder 
2009 
(2) 
New Gold versus Industry Average Total Cash Costs,(1) Net of By-Product Credits 
1. Refer to Endnote on total cash costs under the heading “Non-GAAP Measures”. New Gold total cash costs based on 2014 guidance. 
2. Industry data per GFMS reports calculated net of by-product credits for the year ended December 31, 2013. 
Appendix 2
30 
2013 
SECOND QUARTER 
2014 
SECOND QUARTER 
Revenues ($ million) 
$178 
$184 
$369 
$385 
Operating margin(1)($ million) 
83 
78 
175 
174 
Adjusted net earnings(2)($ million) 
8 
4 
26 
25 
Adjusted netearnings per share(2)($/share) 
0.02 
0.01 
0.05 
0.05 
Net earnings ($ million) 
16 
15 
14 
51 
Net earningsper share ($/share) 
0.03 
0.03 
0.03 
0.11 
Adjustednet cash generated from operations(3)($ million) 
59 
43 
141 
102 
Net cash generated from operations ($ million) 
59 
(23) 
141 
36 
Averagerealized gold price ($ per ounce) 
1,304 
1,276 
1,306 
1,383 
Average realized copperprice ($ per pound) 
3.09 
3.06 
3.03 
3.23 
Average realized silver price ($ per ounce) 
19.53 
21.41 
19.97 
25.12 
1. Refer to Endnote on operating margin under the heading “Non-GAAP Measures”. 
2. Refer to Endnote on adjusted net earnings under the heading “Non-GAAP Measures”. 
3. Refer to Endnote on adjusted net cash generated from operations under the heading “Non-GAAP Measures”. 
2014 second quarter financial summary 
Appendix 2 
2013 
FIRST HALF 
2014 
FIRST HALF
31 
Detailed operating results and assumptions 
Appendix 2 
2013A2013A2013A2013ATonnes processed(000 tonnes)14,29713,000-13,30013,46313,400-13,800814830-8504,0874,500-4,700Tonnes mined(000 tonnes)48,20656,000-58,00031,01833,000-35,0001,1001,300-1,3204,2264,600-4,800Strip ratio2.373.31-3.361.301.46-1.54-------------- Gold grade(g/t)0.370.40-0.440.470.35-0.404.143.9-4.10.780.81-0.85Silver grade(g/t)-------20.9115.0-17.0-------------- Copper grade(%)--------------0.85%0.86%-0.90%0.93%0.93%-0.95% Gold recovery(%)63.0%51.0%92.9%91.0%-93.0%85.1%85.0%-87.0% Silver recovery(%)-------15.0%-------------- Copper recovery(%)--------------88.0%91.0%-93.0%85.9%86.0%-88.0% ProductionGold production(Koz)107.0113.0-123.0102.870.0-80.0100.795.0-105.087.2102.0-112.0Silver production (Koz)-------1,300.61,100.0-1,300.0-------------- Copper production(Mlbs)--------------13.414.0-16.072.078.0-84.0Reserve gradeGold grade(g/t) Silver grade(g/t) Copper grade(%) 3.527.11.22% 0.562.20.84% 0.60-- -- 0.4618.1-- Mesquite2014E2014ENew AftonCerro San Pedro2014EPeak Mines2014E~50% ~15% ~65%
32 
2014 total cash cost sensitivities 
Appendix 2 
Category Copper Price Silver Price AUD/USD CDN/USD MXN/USD Diesel 
Base Assumption $3.25 $20.00 $1.14 $1.11 $13.00 $3.25 
Sensitivity +/- $0.25 +/- $1.00 +/- $0.05 +/- $0.05 +/- $1.00 +/- $0.25 
Total Cash Costs(1) - Impact 
New Afton +/-$200 - - +/-$65 - - 
Mesquite - - - - - +/-$15 
Peak Mines +/-$40 - +/-$50 - - - 
Cerro San Pedro - +/-$15 - - +/-$50 - 
New Gold Consolidated +/-$60 +/-$5 +/-$15 +/-$15 +/-$10 +/-$5 
Total Cash Costs(1) - Sensitivities 
1. Refer to Endnote on total cash costs under the heading “Non-GAAP Measures”.
33 
1. Refer to Endnote on total cash costsunder the heading “Non-GAAP Measures”. 
2. General and administrative includes stock-based compensation and asset retirement obligation. 
3. Sustaining capital based on New Gold’s total 2014 estimated capital expenditures excluding expenditures related to growth-related initiatives. 
4. Refer to Endnote on all-in sustaining costs under the heading “Non-GAAP Measures”. 
2014 estimated all-in sustaining costs 
Total cash costs(1) 
~$330/oz 
General and administrative(2) 
~$90/oz 
Exploration expense 
~$35/oz 
Sustaining capital(3) 
~$370/oz 
ALL-IN SUSTAINING COSTS(4) 
~$825/oz 
Appendix 2
34 
New Afton –2014 guidance 
GOLD PRODUCTION (Koz) 
COPPER PRODUCTION (Mlbs) 
ALL-IN SUSTAINING COSTS(2)($/oz) 
TOTAL CASH COSTS(1)($/oz) 
102 –112 
78 –84 
($1,260) – ($1,240) 
($620) – ($600) 
TOTAL CASH COSTS(1) 
$440 – $460 
$1.10 – $1.20 
Co-Product Gold ($/oz) 
Co-Product Copper ($/lb) 
•Copper price -$3.25 per pound (2013A -$3.23 per pound) 
•Canadian dollar: U.S. dollar exchange – $1.11 
•$0.25 per pound change in copper equals ~$200 per ounce change in New Afton total cash costs 
•$0.01 change in Canadian dollar equals ~$15 per ounce change in New Afton total cash costs 
•Gold and copper production expected to increase due to: 
•Increase in average annual throughput rate 
•Increase in gold grades 
•Costs benefit from targeted increase in copper production, depreciating Canadian dollar and decrease in sustaining capital costs 
OVERVIEW 
KEY ASSUMPTIONS AND SENSITIVITIES 
1. Refer to Endnote on total cash costs under the heading “Non-GAAP Measures”. 
2. Refer to Endnote on all-in sustaining costs under the heading “Non-GAAP Measures”. 
Appendix 3
New Facilities 
To Tailings 
Surface Stockpile 
Mill schematic 
35 
North 
Appendix 3
New Afton –Expansion timeline 
36 
•EPCM contract award 
•Geotechnical and detailed engineering 
•Early works 
•Buried services relocation 
•Reagent tank relocation 
H1’15 
•Excavation 
•Foundations 
•Building construction 
•Building services 
•Vertimilldelivery 
•Piping/electrical 
•Instrumentation 
•Commissioning 
H2’14 
H1’14 
Appendix 3
Mill expansion capital estimates 
37 
Engineering, Constructionand Equipment 
$26 million 
Building and Site Works 
$12 million 
Owner’s Costs 
$2 million 
Contingency 
$5 million 
ESTIMATED EXPANSION CAPITAL 
$45 MILLION 
•Below is a summary of the key capital estimates for the expansion project 
Target: 14,000 tonnes per day at higher metal recoveries 
•~$35 million of capital to be spent in 2014 with remainder in 2015 
Appendix 3
38 
•C-zone originally identified through limited deep holes drilled from surface 
•Drilling from underground commenced in second half of 2012 
•During 2013 completed 41 holes totaling 26,800 metresand updated resource 
•In July 2014, announced 24% increase in Measured and Indicated resource over year-end 2013 figures 
•Mid-year resource includes an additional 15,143 metresof drilling in 20 core holes 
Tonnes (000s) 
Gold 
(g/t) 
Copper 
(%) 
Gold 
(Koz) 
Copper 
(Mlbs) 
Measured 
931 
0.94 
1.06 
28 
22 
Indicated 
33,941 
0.76 
0.86 
832 
646 
Total M&I 
34,872 
0.77 
0.87 
860 
668 
Inferred 
7,979 
0.50 
0.56 
128 
98 
2014 MID-YEAR C-ZONE(1) 
1. For a detailed breakdown of Mineral Resources and Reserves by category, refer to Appendix 2. Refer to Endnotes under the heading “Cautionary note to U.S. readers concerning estimates of Mineral Reserves and Mineral Resources” and “Technical Information”. C-zone resource updated on July 7, 2014. 
2. 2012 information per Annual Information Form dated March 27, 2013. 
2012 YEAR-END C-ZONE(2) 
Tonnes (000s) 
Gold 
(g/t) 
Copper 
(%) 
Gold 
(Koz) 
Copper 
(Mlbs) 
Measured 
400 
0.60 
0.73 
8 
6 
Indicated 
2,900 
0.63 
0.68 
58 
43 
Total M&I 
3,300 
0.62 
0.68 
66 
49 
Inferred 
13,600 
0.70 
0.76 
307 
228 
New Afton –C-zone resource expansion 
Appendix 3 
Tonnes (000s) 
Gold 
(g/t) 
Copper 
(%) 
Gold 
(Koz) 
Copper 
(Mlbs) 
Measured 
618 
0.75 
0.91 
15 
12 
Indicated 
25,223 
0.84 
0.91 
678 
504 
Total M&I 
25,842 
0.83 
0.91 
693 
516 
Inferred 
11,288 
0.63 
0.64 
227 
159 
2013 YEAR-END C-ZONE(1)
39 
New Afton –C-zone September 2014 exploration update(1) 
Appendix 3 
1. For detailed assumptions, risks and parameters relating to the above estimates refer to New Gold’s Annual Information Formdated March 28, 2014. Refer also to Endnotes under the heading “Cautionary note to U.S. readers concerning estimates of Mineral Reserves and Mineral Resources” and “Technical Information” and New Gold’s news release dated July 7, 2014 and September 11, 2014 available at www.sedar.com. 
Drill Hole 
From (m) 
To (m) 
Interval (m) 
True Width (m) 
Au (g/t) 
Cu (%) 
EA14-114 
0 
150 
150 
No assays 
150 
707 
557 
0.08 
0.02 
EA14-115 
0 
300 
300 
No assays 
300 
706 
406 
0.13 
0.03 
C-Zone 
706 
786 
80 
55 
1.07 
1.40 
Includes 
728 
752 
24 
1.82 
2.51 
786 
819 
33 
0.17 
0.14 
EA14-116 
0 
100 
100 
No assays 
100 
494 
394 
0.13 
0.03 
C-Zone 
494 
568 
74 
52 
0.95 
0.94 
Includes 
494 
534 
40 
1.49 
1.50 
568 
601 
33 
0.14 
0.12 
EA14-117 
0 
2 
2 
No assays 
2 
630 
628 
0.08 
0.04 
C-Zone 
630 
672 
42 
21 
0.81 
0.55 
672 
743 
71 
0.13 
0.07 
EA14-118 
0 
150 
150 
No assays 
150 
534 
384 
0.23 
0.04 
C-Zone 
534 
660 
126 
72 
1.47 
1.80 
Includes 
534 
612 
78 
1.96 
2.36 
660 
679 
19 
0.13 
0.03 
EA14-119 
0 
100 
100 
No assays 
100 
418 
318 
0.11 
0.03 
C-Zone 
418 
534 
116 
89 
0.59 
0.71 
534 
587 
53 
0.19 
0.14 
EA14-120 
0 
300 
300 
No assays 
300 
612 
312 
0.10 
0.02 
C-Zone 
612 
684 
72 
61 
0.81 
0.98 
684 
721 
37 
0.26 
0.16 
EA14-121 
0 
2 
2 
No assays 
2 
430 
428 
0.15 
0.04 
C-Zone 
430 
640 
210 
121 
1.20 
0.89 
Includes 
448 
524 
76 
1.92 
1.01 
EA14-122 
0 
100 
100 
No assays 
100 
384 
284 
0.08 
0.03 
C-Zone 
384 
478 
94 
91 
1.65 
1.67 
Includes 
394 
444 
50 
2.39 
2.30 
478 
528 
50 
0.31 
0.25 
528 
538 
10 
0.08 
0.04 
EA14-123 
0 
50 
50 
No assays 
50 
502 
452 
0.16 
0.07 
C-Zone 
502 
600 
98 
87 
1.49 
1.97 
Includes 
532 
574 
42 
2.04 
2.56 
Drill Hole 
From (m) 
To (m) 
Interval (m) 
True Width (m) 
Au (g/t) 
Cu (%) 
EA14-124A 
0 
300 
300 
No assays 
300 
714 
414 
0.15 
0.03 
C-Zone 
714 
792 
78 
58 
1.07 
1.25 
792 
825 
33 
0.08 
0.12 
EA14-125 
0 
100 
100 
No assays 
100 
392 
292 
0.08 
0.03 
C-Zone 
392 
502 
110 
78 
1.35 
1.73 
Includes 
392 
428 
36 
2.26 
3.34 
502 
561 
59 
0.10 
0.04 
EA14-126 
0 
456 
456 
0.17 
0.06 
C-Zone 
456 
650 
194 
98 
0.85 
0.75 
Includes 
490 
556 
66 
1.47 
0.93 
Includes 
624 
650 
26 
0.96 
1.53 
650 
654 
4 
0.11 
0.05 
EA14-127 
0 
150 
150 
No assays 
150 
526 
376 
0.13 
0.03 
526 
648 
122 
72 
0.98 
1.28 
Includes 
570 
596 
26 
1.61 
1.78 
Includes 
620 
648 
28 
1.22 
1.63 
EA14-128 
0 
100 
100 
No assays 
100 
382 
282 
0.05 
0.03 
C-Zone 
382 
476 
94 
86 
1.78 
1.96 
Includes 
384 
444 
60 
2.49 
2.69 
476 
522 
46 
0.26 
0.32 
444 
548 
104 
0.07 
0.09 
EA14-129A 
0 
300 
300 
No assays 
300 
658 
358 
0.09 
0.03 
C-Zone 
658 
724 
66 
54 
1.33 
1.67 
Includes 
660 
686 
26 
2.07 
2.72 
724 
759 
35 
0.40 
0.08 
EA14-130 
1 
266 
265 
0.17 
0.04 
C-Zone 
520 
632 
112 
76 
0.76 
0.95 
Includes 
550 
584 
34 
1.60 
1.62 
632 
718 
86 
0.15 
0.05 
EA14-131 
0 
100 
100 
No assays 
100 
660 
560 
0.16 
0.03 
C-Zone 
660 
728 
68 
52 
1.15 
1.24 
Includes 
660 
684 
24 
2.08 
2.12 
728 
758 
30 
0.05 
0.07 
EA14-132 
0 
150 
150 
No assays 
150 
492 
342 
0.17 
0.05 
C-Zone 
492 
582 
90 
80 
1.30 
1.89 
Includes 
492 
528 
36 
2.09 
2.78 
582 
630 
48 
0.09 
0.05 
EA14-133 
0 
300 
300 
No assays 
300 
540 
240 
0.29 
0.04 
C-Zone 
540 
658 
118 
57 
1.01 
1.28 
Includes 
594 
630 
36 
1.99 
2.27 
658 
712 
54 
0.06 
0.04
New Afton –2014 C-zone program 
40 
Appendix 3 
Ore Shell 
Delineation & Infill 
(Priority 1) 
Western 
ExplorationStep-out 
(Priority 3) 
Delineation & Infill 
(Priority 2) 
~30,000-35,000 metres of drilling planned in C Zone for 2014 
Extraction Level 
C-Zone
41 
New Gold has a track record of successful mine development 
Mine development –Creating options 
Once mines are in production –multiple options to further enhance value 
Cerro San Pedro (April 2007) –~35,000 tonne per day open pit/heap leach 
Mesquite (January 2008) –~40,000 tonne per day open pit/heap leach 
New Afton (June 2012) –11,000 tonne per day block cave/process facility 
Mine life extension (Mesquite(1), Peak Mines(2), New Afton C-zone) 
Increased production rate (Cerro San Pedro(3), New Afton) 
1.Mesquite’s mine life has been extended beyond the 9.5 years that were estimated when the mine re-started production in January 2008. 
2.The Peak Mines originally began production in 1992 with an approximate eight year life and have operated continuously since then and continue to have six or more years of mine life. 
3.During 2011 and 2012, Cerro San Pedro operated at a rate above its design capacity to increase its annual gold and silver production. 
Appendix 3
42 
•Diesel comprises ~25% of Mesquite’s total costs 
•Rack diesel price most correlated to Brent oil price 
•Diesel price -$3.25 per gallon 
•Every $0.25 per gallon change in diesel price has ~$15 per ounce impact on total cash costs 
•Production increase driven by planned mining of higher grades versus 2013 
•Increase in costs attributable to increase in total tonnes mined 
•Peak year for sustaining capital at Mesquite 
Mesquite –2014 guidance 
GOLD PRODUCTION (Koz) 
OVERVIEW 
KEY ASSUMPTIONS AND SENSITIVITIES 
ALL-IN SUSTAINING COSTS(2)($/oz) 
TOTAL CASH COSTS(1)($/oz) 
1. Refer to Endnote on total cash costs under the heading “Non-GAAP Measures”. 
2. Refer to Endnote on all-in sustaining costs under the heading “Non-GAAP Measures”. 
113 –123 
$930 – $950 
$1,310 – $1,330 
Appendix 4
43 
•Copper price -$3.25 per pound (2013A -$3.29 per pound) 
•Australian dollar: U.S. dollar exchange –$1.14 
•$0.25 per pound change in copper equals ~$40 per ounce change in Peak Mines total cash costs 
•$0.01 change in Australian dollar equals ~$10 per ounce change in Peak Mines total cash costs 
•Gold production in line with 2013 
•Increase in copper production a result of increased copper grade and recovery 
•Decrease in total cash costs a result of increased copper by-product revenue, depreciating Australian dollar and increased productivity through lower turnover 
Peak Mines –2014 guidance 
GOLD PRODUCTION (Koz) 
COPPER PRODUCTION (Mlbs) 
OVERVIEW 
KEY ASSUMPTIONS AND SENSITIVITIES 
ALL-IN SUSTAINING COSTS(2)($/oz) 
TOTAL CASH COSTS(1)($/oz) 
1. Refer to Endnote on total cash costs under the heading “Non-GAAP Measures”. 
2. Refer to Endnote on all-in sustaining costs under the heading “Non-GAAP Measures”. 
95 –105 
14 –16 
$630 – $650 
$1,065 – $1,085 
Appendix 4
44 
•Silver price -$20.00 per ounce (2013A –$23.61 per ounce) 
•Mexican peso: U.S. dollar exchange – $13.00 
•$1.00 per ounce change in silver equals ~$15 per ounce change in Cerro San Pedro total cash costs 
•$1.00 change in Mexican peso equals ~$50 per ounce change in Cerro San Pedro total cash costs 
•Decrease in production reflects the increased strip ratio for Phase 5 pushback and mining of lower grade ore 
•Increase in costs primarily driven by lower gold production, lower silver by- product revenue and increased volume of processing reagents 
Cerro San Pedro –2014 guidance 
GOLD PRODUCTION (Koz) 
SILVER PRODUCTION (Moz) 
OVERVIEW 
KEY ASSUMPTIONS AND SENSITIVITIES 
ALL-IN SUSTAINING COSTS(2)($/oz) 
TOTAL CASH COSTS(1)($/oz) 
1. Refer to Endnote on total cash costs under the heading “Non-GAAP Measures”. 
2. Refer to Endnote on all-in sustaining costs under the heading “Non-GAAP Measures”. 
70 –80 
1.1 –1.3 
$1,030 – $1,050 
$1,125 – $1,145 
Appendix 4
45 
•21,000 tonne per day process plan with conventional crushing, grinding, leaching and carbon-in-pulp technology 
•Targeted commissioning in 2016 with first year of full production in 2017 
•14-year mine life with direct processing of open pit and underground ore for first nine years and processing of a combination of stockpile and underground ore thereafter 
•Development capital of $885 million inclusive of $70 million contingency (at $1.05 CDN/USD) 
•Life-of-mine gold and silver recoveries of 91% and 64% 
•Open pit mining schedule incorporates an elevated cut-off grade strategy during first nine years 
Rainy River –Project overview 
Appendix 5 
Pre-tax Economics 
Gold Price ($/oz) 
1,150 
1,300 
1,300 
1,450 
1,600 
US$/C$ exchange 
0.93 
0.95 
0.91 
0.97 
1.00 
5% NPV ($mm) 
138 
438 
551 
738 
1,009 
IRR (%) 
7.8 
13.1 
15.3 
17.6 
21.1 
Payback (years) 
6.8 
5.4 
4.8 
4.3 
3.6 
After-tax Economics 
Gold Price ($/oz) 
1,150 
1,300 
1,300 
1,450 
1,600 
US$/C$ exchange 
0.93 
0.95 
0.91 
0.97 
1.00 
5% NPV ($mm) 
100 
314 
396 
520 
706 
IRR (%) 
7.1 
11.3 
13.2 
14.9 
17.8 
Payback (years) 
6.8 
5.5 
5.0 
4.4 
3.8
46 
•Conventional truck and shovel open pit mine with 60,000 tonne per day processing plant 
•Simple, conventional flowsheetusing whole ore leach process 
•Low grade stockpiling strategy 
•Development capital of $1,865 million inclusive of $190 million contingency (at $1.05 CDN/USD) 
•Life-of-mine operational strip ratio of 1.88 to 1 
•Life-of-mine gold and silver recoveries of 87% and 49% 
•Conventional waste rock and Tailings Storage Facility 
•Power supply from the hydroelectric power grid, via 140-kilometre transmission line 
•Minimal off-site infrastructure required 
•Good existing access road; water supply within 15 kilometres 
•Low environmental risk and facility designed for closure 
Blackwater –Project overview 
Appendix 6 
Pre-tax Economics 
Gold Price ($/oz) 
1,150 
1,300 
1,300 
1,450 
1,600 
US$/C$ exchange 
0.93 
0.95 
0.91 
0.97 
1.00 
5% NPV ($mm) 
402 
991 
1,209 
1,582 
2,120 
IRR (%) 
7.8 
11.3 
12.9 
14.4 
16.8 
Payback (years) 
7.5 
6.2 
5.6 
5.1 
4.5
47 
1. Capital estimates based on December 2011 Feasibility Study. 
El Morro (30%) –Funding structure 
Funded by 
$1.2 billion 
interest at 4.58% 
~ $2.7 billion 
70% 
20% 
80% 
•New Gold’s 30% share of development capital 100% carried 
•Interest fixed at 4.58% 
30% 
70% 
30% 
Total Capital 
100% 
~ $3.9 billion(1) 
100%Average annual cash flow 
Carried funding repayment 
Appendix 7
48 
2013 open pit Proven and Probable reserves and Measured and Indicated resources 
UndergroundInferredresourcewithblock cave potential 
500 metres 
La Fortuna deposit 
Appendix 7 
Reserve Grade 
Gold: 0.46 g/t 
Copper: 0.49% 
Inferred Grade 
Gold: 0.97 g/t 
Copper: 0.78%
49 
1. All reserve information taken from Goldcorp’s December 31, 2013 year-end resource statements. 
2. Gold equivalent calculated based on the following commodity prices: Gold -$1,300/oz; Silver -$22.00/oz; Copper -$3.00/lb; Lead -$0.90/lb; Zinc -$0.90/lb. 
El Morro relative positioning(1) 
EL MORRO WITHIN GOLDCORP PORTFOLIO 
Asset 
Gold Reserves (Moz) 
Asset 
Gold Equivalent(2)(Moz) 
Penasquito 
11.6 
Penasquito 
30.6 
Los Filos 
8.0 
El Morro 
18.0 
El Morro 
6.7 
Los Filos 
8.9 
Pueblo Viejo 
6.5 
Pueblo Viejo 
7.5 
CerroNegro 
5.7 
Cerro Negro 
6.6 
Appendix 7
50 
New Gold’s estimated exploration budget for 2014 is $50 million 
•Capitalized: $30 million (included in sustaining capital total shown previously) 
•Expensed: $20 million (approximately 70% related to current operations) 
New Afton 
30,000-35,000 metres 
Peak Mines 
45,000 
metres 
Blackwater 
10,000-15,000 metres 
2014 exploration program overview 
Rainy River 
35,000-40,000 metres 
1. Circle proportions are representative of both capitalized and expensed exploration for each respective asset. 
Appendix 8 
$15 million 
$15 million 
$11 million 
$9 million
Rainy River exploration 
51 
•Intrepid resource drilled off and incorporated into Feasibility Study 
•Condemnation drilling program approximately 40% complete by year end 
•Improved ability to predict prospective ore horizons beneath surface cover 
2013 ACHIEVEMENTS 
2014 PROGRAM 
Targeting resource expansion in near-mine environment 
•Complete condemnation drilling program 
•Test potential to expand open pit resource to west 
•Explore prospective trends south of main mine area and extending from Intrepid Zone 
Intrepid Zone 
Appendix 8
Blackwater exploration 
52 
2013 Achievement 
•Expanded exploration targeting coverage to ~50% of claim block 
•14 prospective target areas identified to date 
•Seven new targets drill tested with favorable geology intercepted on six and gold mineralization intercepted on three 
•Acquired Key property immediately south of Blackwater deposit area 
2014 Program 
•Follow up favorable results at Van Tine, Fawn and earlier stage prospects 
•Initiate exploration at Key 
Appendix 8
Peak Mines exploration 
53 
•Near-mine exploration and resource conversion partially offset mine depletion 
•Advanced earlier stage targets along regional Rookery fault trend 
2013 ACHIEVEMENTS 
2014 PROGRAM 
Focus on reserves replacement in near-mine environment 
•Convert Measured and Indicated resources to reserves to extend mine life 
•Test newly emerging targets along mine corridor 
•Continue to advance earlier stage regional targets 
Appendix 8
54 
1. 2012 information per Annual Information Form dated March 27, 2013 
2. New Afton C-zone updated for July 7, 2014 news release. 
Reserves and resources summary 
Appendix 9 
Gold KozSilver KozCopper MlbsGold KozSilver KozCopper MlbsProven and Probable Reserves18,538 90,080 2,953 7,752 31,256 3,282 Measured and Indicated Resources (inclusive of Reserves)27,672 125,018 4,505 21,403 131,847 4,061 Inferred Resources4,062 30,145 1,759 4,383 84,620 1,114 M&I Resources (inclusive of Reserves) New Afton2,464 8,305 2,140 1,979 6,830 1,818 Mesquite4,904 - - 5,684 - - Peak Mines810 1,380 158 880 1,350 146 Cerro San Pedro397 15,948 - 1,703 57,980 - Rainy River6,236 14,635 - n/an/an/aBlackwater9,500 70,130 - 8,070 56,190 - Capoose320 14,620 - 196 9,497 - El Morro3,041 - 2,207 2,891 - 2,097 Total M&I27,672 125,018 4,505 21,403 131,847 4,061 Mineral Reserves and Resources SummaryAs at December 31, 2013As at December 31, 2012(1)
55 
Reserves and resources summary (cont’d) 
Appendix 9 
1. 2012 information per Annual Information Form dated March 27, 2013. 
Tonnes000'sGoldg/tSilverg/tCopper% GoldKozSilverKozCopperMlbsTonnes000'sGoldg/tSilverg/tCopper% GoldKozSilverKozCopperMlbsNew AftonProven- - - - - - - - - - - - - - Probable48,821 0.56 2.2 0.84 879 3,500 904 52,500 0.65 2.3 0.93 1,100 3,880 1,080 Total New Afton P&P48,821 0.56 2.2 0.84879 3,500 904 52,500 0.65 2.3 0.931,100 3,880 1,080 MesquiteProven3,809 0.70 - - 86 - - 13,140 0.68 - - 287 - - Probable112,094 0.60 - - 2,152 - - 114,409 0.56 - - 2,055 - - Total Mesquite P&P115,903 0.60 - - 2,237 - - 127,549 0.57 - - 2,342 - - Peak MinesProven1,820 4.35 6.7 1.16255 390 47 2,109 5.89 7.5 1.08399 510 50 Probable1,820 2.69 7.4 1.27 157 430 51 2,118 3.82 6.8 1.18 260 466 55 Total Peak Mines P&P3,640 3.52 7.1 1.22412 820 98 4,227 4.85 7.2 1.13659 976 105 Cerro San PedroProven12,982 0.47 17.5 - 197 7,311 - 21,100 0.52 17.1 - 353 11,600 - Probable13,714 0.44 18.7 - 195 8,239 - 26,400 0.48 17.4 - 407 14,800 - Total CSP P&P26,696 0.46 18.1 - 392 15,550 - 47,500 0.50 17.3 - 760 26,400 - Mineral Reserves statement as at December 31, 2013Contained metalMetal gradeMetal gradeContained metalMineral Reserves statement as at December 31, 2012
56 
Reserves and resources summary (cont’d) 
Appendix 9 
1. 2012 information per Annual Information Form dated March 27, 2013. 
Tonnes000'sGoldg/tSilverg/tCopper% GoldKozSilverKozCopperMlbsTonnes000'sGoldg/tSilverg/tCopper% GoldKozSilverKozCopperMlbsRainy RiverDirect processing materialOpen PitProven15,839 1.47 2.0 - 746 1,038 - Probable46,866 1.26 3.1 - 1,896 4,594 - Open Pit P&P (direct processing)62,705 1.31 2.8 - 2,642 5,632 - UndergroundProven- - - - - - - Probable4,187 4.96 10.3 - 668 1,388 - Underground P&P (direct processing)4,187 4.96 10.3 - 668 1,388 - Stockpile materialOpen PitProven6,843 0.38 1.5 - 84 332 - Probable30,541 0.39 2.1 - 378 2,058 - Open Pit P&P (stockpile)37,384 0.38 2.0 - 462 2,390 - Total P&PProven22,681 1.14 1.9 - 830 1,370 - Probable81,594 1.12 3.1 - 2,943 8,040 - Total Rainy River P&P104,275 1.13 2.8 - 3,773 9,410 - Blackwater Direct processing materialProven124,500 0.95 5.5 - 3,790 22,100 - Probable169,700 0.68 4.1 - 3,730 22,300 - P&P (direct processing)294,300 0.79 4.7 - 7,510 44,400 - Stockpile materialProven20,100 0.50 3.6 - 330 2,300 - Probable30,100 0.34 14.6 - 330 14,100 - P&P (stockpile)50,200 0.40 10.2 - 650 16,400 - Total Blackwater P&P344,400 0.74 5.5 - 8,170 60,800 - El Morro30% BasisProven321,814 0.56 - 0.551,746 - 1,163 307,949 0.57 - 0.561,705 - 1,135 Probable277,240 0.35 - 0.43 929 - 788 335,152 0.37 - 0.44 1,186 - 962 Total El Morro P&P599,054 0.46 - 0.492,675 - 1,951 643,101 0.47 - 0.492,891 - 2,097 Total P&P18,538 90,080 2,953 7,752 31,256 3,282 100% Basis30% Basis100% BasisMineral Reserves statement as at December 31, 2013Contained metalMetal gradeMetal gradeContained metalMineral Reserves statement as at December 31, 2012
57 
Reserves and resources summary (cont’d) 
Appendix 9 
1. 2012 information per Annual Information Form dated March 27, 2013. 
2. New Afton C-zone updated for July 7, 2014 news release. 
Tonnes000'sGoldg/tSilverg/tCopper% GoldKozSilverKozCopperMlbsTonnes000'sGoldg/tSilverg/tCopper% GoldKozSilverKozCopperMlbsNew AftonA&B ZonesMeasured41,059 0.79 2.7 1.09 1,041 3,624 984 33,500 0.86 2.9 1.18 929 3,160 873 Indicated26,966 0.44 2.1 0.65 384 1,777 384 45,900 0.67 2.4 0.89 984 3,530 896 A&B Zone M&I68,025 0.65 2.5 0.91 1,425 5,401 1,368 79,400 0.75 2.6 1.01 1,913 6,690 1,769 C-ZoneMeasured931 0.94 1.7 1.06 28 51 22 400 0.60 1.3 0.73 8 20 6 Indicated33,941 0.76 1.9 0.86 832 2,084 646 2,900 0.63 1.3 0.68 58 120 43 C-Zone M&I34,872 0.77 1.9 0.87 860 2,141 668 3,300 0.62 1.3 0.68 66 140 49 HW LensMeasured- - - - - - - - - - - - - - Indicated11,035 0.50 2.2 0.43 179 763 104 - - - - - - - HW Lens M&I11,035 0.50 2.2 0.43 179 763 104 - - - - - - - Total New Afton M&I113,932 0.67 2.3 0.85 2,464 8,305 2,140 82,700 0.74 2.6 1.00 1,979 6,830 1,818 MesquiteMeasured9,070 0.66 - - 191 - - 24,000 0.61 - - 452 - - Indicated304,081 0.48 - - 4,713 - - 370,100 0.45 - - 5,232 - - Total Mesquite M&I313,151 0.49 - - 4,904 - - 394,100 0.45 - - 5,684 - - Peak MinesMeasured3,000 4.69 6.7 1.06 450 650 70 2,700 5.74 7.5 1.05 494 647 62 Indicated3,400 3.29 6.7 1.18 360 730 88 3,200 3.75 6.8 1.19 386 703 84 Peak Mines M&I6,400 3.95 6.7 1.12 810 1,380 158 5,900 4.66 7.1 1.13 880 1,350 146 Cerro San PedroMeasured13,387 0.46 17.3 - 199 7,459 - 42,300 0.40 14.4 - 532 18,900 - Indicated14,311 0.43 18.4 - 198 8,489 - 109,400 0.34 11.5 - 1,171 39,080 - Total CSP M&I27,698 0.45 17.9 - 397 15,948 - 151,700 0.35 11.9 - 1,703 57,980 - Measured and Indicated mineral Resource statement (inclusive of Reserves) as at December 31, 2013Contained metalMetal gradeMeasured and Indicated mineral Resource statement (inclusive of Reserves) as at December 31, 2012Metal gradeContained metal
58 
Reserves and resources summary (cont’d) 
Appendix 9 
1. 2012 information per Annual Information Form dated March 27, 2013. 
2. New Afton C-zone updated for July 7, 2014 news release. 
Tonnes000'sGoldg/tSilverg/tCopper% GoldKozSilverKozCopperMlbsTonnes000'sGoldg/tSilverg/tCopper% GoldKozSilverKozCopperMlbsRainy RiverDirect processing materialOpen PitMeasured20,282 1.45 1.9 - 947 1,261 - Indicated80,411 1.35 2.6 - 3,486 6,584 - Open Pit M&I (direct processing)100,693 1.37 2.4 - 4,433 7,846 - UndergroundMeasured89 4.95 2.8 - 14 8 - Indicated5,469 4.53 11.3 - 796 1,994 - Underground M&I (direct processing)5,558 4.53 11.2 - 810 2,002 - Stockpile materialOpen PitMeasured6,294 0.37 1.3 - 74 262 - Indicated64,816 0.44 2.2 - 919 4,526 - Open Pit M&I (stockpile)71,110 0.43 2.1 - 993 4,788 - Total M&IMeasured26,665 1.21 1.8 - 1,035 1,531 - Indicated150,696 1.07 2.7 - 5,202 13,104 - Total Rainy River M&I177,361 1.09 2.6 - 6,236 14,635 - Blackwater Direct processing materialMeasured116,955 1.04 5.6 - 3,900 21,060 - Indicated189,044 0.78 6.0 - 4,730 36,470 - M&I (direct processing)305,999 0.88 5.8 - 8,620 57,520 - Stockpile materialMeasured26,521 0.30 4.1 - 260 3,500 - Indicated64,382 0.30 4.4 - 620 9,110 - M&I (stockpile)90,904 0.30 4.3 - 870 12,600 - Total Blackwater M&I396,903 0.74 5.5 - 9,500 70,130 - 296,146 0.85 5.9 - 8,070 56,190 - CapooseIndicated20,280 0.50 22.4 - 320 14,620 - 14,200 0.43 20.8 - 196 9,497 - El MorroMeasured341,604 0.56 - 0.541,848 - 1,230 307,949 0.57 - 0.561,705 - 1,135 Indicated349,803 0.35 - 0.42 1,193 - 977 335,152 0.37 - 0.44 1,186 - 962 Total El Morro M&I691,407 0.46 - 0.483,041 - 2,207 643,101 0.47 - 0.492,891 - 2,097 Total M&I27,672 125,018 4,505 21,403 131,847 4,061 Measured and Indicated mineral Resource statement (inclusive of Reserves) as at December 31, 2013Contained metal100% Basis30% BasisMetal gradeMeasured and Indicated mineral Resource statement (inclusive of Reserves) as at December 31, 2012Metal gradeContained metal100% Basis30% Basis
59 
Reserves and resources summary (cont’d) 
Appendix 9 
1. 2012 information per Annual Information Form dated March 27, 2013. 
2. New Afton C-zone updated for July 7, 2014 news release. 
Tonnes000'sGoldg/tSilverg/tCopper% GoldKozSilverKozCopperMlbsTonnes000'sGoldg/tSilverg/tCopper% GoldKozSilverKozCopperMlbsNew AftonA&B-Zone5,607 0.32 1.5 0.38 59 272 46 14,900 0.45 2.0 0.65 216 940 212 C-Zone 7,979 0.50 1.5 0.56 128 387 98 13,600 0.70 1.5 0.76 307 670 228 HW Lens818 0.56 1.3 0.42 15 33 7 - - - - - - - New Afton Inferred14,404 0.50 1.5 0.52 202 692 151 28,400 0.57 1.8 0.70 523 1,610 440 Mesquite17,550 0.42 - - 238 - - 50,900 0.40 - - 651 - - Peak Mines2,000 2.34 4.7 1.17 150 300 51 1,700 2.64 4.8 1.13 144 261 42 CSP1,174 0.34 11.6 - 13 436 - 103,900 0.25 8.8 - 850 29,200 - Rainy RiverDirect processingOpen Pit9,388 0.97 2.3 - 292 687 - Underground2,641 4.46 8.3 - 379 707 - Total Direct Processing12,029 1.74 3.6 - 671 1,394 - StockpileOpen Pit8,626 0.37 1.2 - 102 323 - Rainy River Inferred20,655 1.16 2.6 - 773 1,717 - BlackwaterDirect processing13,815 0.76 4.1 - 340 1,820 - Stockpile3,785 0.31 3.6 - 40 440 - Blackwater Inferred17,600 0.66 4.0 - 380 2,260 - 16,585 0.58 10.8 - 310 5,760 - Capoose29,263 0.39 26.3 - 370 24,740 - 64,070 0.29 23.2 - 595 47,789 - El Morro - Open Pit564,217 0.16 - 0.26871 - 970 137,555 0.99 - 0.701,310 - 632 El Morro - Underground113,840 0.97 - 0.781,065 - 587 Total Inferred4,062 30,145 1,759 4,383 84,620 1,114 100% Basis30% Basis30% Basis100% BasisInferred Resource statement as at December 31, 2013Contained metalMetal gradeInferred Resource statement as at December 31, 2012Metal gradeContained metal
60 
New Gold reports its Measured and Indicated mineral resources inclusive of its mineral reserves. Measured and Indicated mineral resources that are not mineral reserves do not have demonstrated economic viability. Inferred mineral resources have a greater amount of uncertainty as to their existence and economic and legal feasibility, do not have demonstrated economic viability, and are exclusive of mineral reserves. Mineral reserves have been estimated in accordance with the Canadian Instituteof Mining, Metallurgy and Petroleum (“CIM”) definition standards and National Instrument 43-101 (“NI 43-101”). 
1) Mineral Reserves for the company’s mineral properties have been estimated based on the following metal prices and lower cut-off criteria: 
Mineral Property 
Gold (US$/oz) 
Silver (US$/oz) 
Copper (US$/lb) 
Lower Cut-off 
New Afton 
$1,300 
$22.00 
$3.00 
US$21.00/t NSR 
Mesquite 
$1,300 
- 
- 
0.21 g/t Au –Oxide and transition reserves 
0.41 g/tAu –Non-oxide reserves 
Peak Mines 
$1,300 
$22.00 
$3.00 
A$88 –134/t NSR 
Cerro San Pedro 
$1,300 
$22.00 
- 
US$3.00/t 
Rainy River 
$800 
$1,300 
$25.00 
$22.00 
- 
Open Pit:0.3 –0.7 g/t Au 
Underground: 3.5 g/t Au 
Blackwater 
$1,300 
$22.00 
- 
Direct processing:0.26 –0.38 g/t AuEq 
Stockpile:0.32 g/t AuEq 
El Morro 
$1,300 
- 
$3.00 
0.20% Cu 
Reserves and resources notes 
Appendix 9
61 
2) Mineral Resources for the company’s mineral properties have been estimated based on the following metal prices and lower cut-off criteria: 
3) Mineral resources are classified as Measured, Indicated and Inferred resources and are reported based on technical and economic parameters consistent with the methods most suitable for their potential commercial exploitation. Where different mining and/or processing methods might be applied to different portions of a mineral resource, the designators ‘open pit’ and ‘underground’ have been applied to indicate envisioned mining method. Likewise the designators ‘oxide’, ‘non-oxide’ and ‘sulphide’ have been applied to indicate the type of mineralization as it relates to appropriate mineral processing method and expected payable metal recoveries. Additional details regarding mineral resource estimation, classification, reporting parameters, key assumptions and associated risks for each of New Gold’s mineral properties, other than Rainy River, are provided in the respective NI 43-101 Technical Reports which are available at www.sedar.com. Refer to the supplementary information below regarding the mineral reserve and mineral resource estimates for Rainy River. 
Mineral Property 
Gold (US$/oz) 
Silver (US$/oz) 
Copper (US$/lb) 
Lower Cut-off 
New Afton 
$1,400 
$24.00 
$3.25 
0.40% CuEq 
Mesquite 
$1,400 
- 
- 
0.11g/t Au –Oxide and transition resources 
0.22 g/t Au –Non-oxide resources 
Peak Mines 
$1,400 
$24.00 
$3.25 
A$92 -125/t NSR 
Cerro San Pedro 
$1,400 
$24.00 
- 
0.10 g/t AuEq –Open pit oxideresources 
0.30 g/t AuEq –Open pit sulphideresources 
Rainy River 
$1,400 
$24.00 
- 
OpenPit: 0.3 –0.45g/t Au 
Underground: 2.5 g/t Au 
Blackwater 
$1,400 
$24.00 
- 
Direct processing:0.40 g/t AuEq 
Stockpile: 0.30 –0.40 g/t AuEq 
Capoose 
$1,400 
$24.00 
- 
0.40 g/t AuEq 
El Morro 
$1,300 
- 
$3.00 
0.20% Cu 
Reserves and resources notes (cont’d) 
Appendix 9
62 
Rainy River Mineral Reserves: 
1. Open pit mineral reserves have been estimated using an optimized pit shell based on metal prices of $800 per ounce gold and $25 per ounce silver, a foreign exchange rate of C$1.05 to US$1.00, gold recovery of 89.9% (non-CAP Zone) and 74.3% (CAP Zone) and a silver recovery of 67.1% (non-CAP Zone) and 69.5% (CAPZone). The cut-off grade is based on a gold price of $1,200. Underground reserves have been estimated from mining shapes generated using a cut-off grade of 3.5 g/t gold-equivalent. Development material from stopeaccess drives above a cut-off grade of 1.5 g/t gold-equivalent is also assumed to be sent to the mill for processing. Underground breakeven cut-off grade is calculated at 2.75 g/t gold-equivalent based on metal prices of $1,300 per ounce gold and $22 per ounce silver, a foreign exchange rate of CAD $1.05 to USD $1.00, gold recoveryof 95% and a silver recovery of 75%. 
2. Open pit reserves have been estimated using a dilution of 4% at 0.21 g/t Au and 1.19 g/t Ag, and underground reserves havebeen estimated using an overall dilution of 8.3%, inclusive of both rock and backfill dilution. Open pit and underground reserves have been estimated using a mining recovery of 95% and 96.5%,respectively. 
3. Open pit direct processing material is defined as mineralization likely to be mined and processed directly and above a variable cut-off grade ranging from 0.3-0.7 Au g/t. 
4. Stockpile material includes all material within designed open pit between variable cut-offs described above in Note 3, as well as material within the CAP Zone (code 500) that is suitable for stockpiling and future processing. 
5. Mineral Reserves for the open pit are derived from the resource model effective November 2, 2013. Models for the underground reserves were derived from the August 2013 and September 2013 models for the main ODM zone and Intrepid Zone, respectively. Models were prepared by DorotaEl-Rassi, P.Eng. (APEO #100012348) and Glen Cole, P.Geo. (APGO #1416), of SRK, both independent “Qualified Persons" as that term is defined in National Instrument 43-101. Rainy River’s exploration program in Richardson Township is being supervised by Mark A. Petersen, (AIPG Certified Professional Geologist #10563), Vice President, Exploration for New Gold and a “Qualified Person” as defined in National Instrument 43-101. New Gold continues to implement a rigorous QA/QC program to ensure best practices in drill core sampling, analysis and data management. 
6. Qualified persons -The open pit portion of the mineral reserve statement was prepared under the supervision of Patrice Live (OIQ #38991) of BBA, and the underground portion of the mineral reserve statement was prepared by ColmKeogh, P.Eng. (APEGBC #37433) of AMC Mining Consultants (Canada) Ltd., both independent “Qualified Persons" as that term is defined in National Instrument 43-101. 
7. The mineral reserve estimate may be materially affected by environmental, permitting, legal, title, taxation, sociopolitical,marketing, and other relevant issues. 
Rainy River Mineral Resources: 
1. Mineral resources are reported in relation to conceptual pit shells and are inclusive of the Intrepid zone. Vertical limitof-150m msl. 
2. Open pit mineral resources are reported at a cut-off grade of 0.30 gptgold, underground mineral resources are reported at a cut-off grade of 2.5 gptgold based on a gold price of $1,400 per ounce, a silver price of $24.00 per ounce, a foreign exchange rate of C$1.10 to US$1.00, gold recovery of 88% for open pit resources and 90% for underground resources with silver recovery at 75%. 
3. Direct processing material is defined as mineralization above a cut-off of 0.45 g/t gold and likely to be mined and processeddirectly. 
4. Stockpile material includes all material within conceptual pit shells in the gold grade range 0.30 –0.45 gptas well as all material within the CAP zone that is suitable for stockpiling and future processing based on average metallurgical recoveries of 88% gold and 75% silver. 
5. Qualified Persons –The mineral resource statement was prepared by DorotaEl-Rassi, P. Eng. (APEO #100012348) and Glen Cole (APGO #1416) from SRK, both independent "Qualified Persons" as that term is defined in National Instrument 43-101. 
6. Mineral resources are inclusive of mineral reserves. Mineral resources that are not mineral reserves do not have demonstrated economic viability. 
7. The mineral resource estimate may be materially affected by environmental, permitting, legal, title, taxation, sociopolitical, marketing and other relevant issues. 
4) Qualified Person: The preparation of New Gold's mineral reserve and mineral resource statements has been done by QualifiedPersons as defined under National Instrument 43-101 under the supervision of Mark A. Petersen, a Qualified Person under National Instrument 43-101 and an officer of New Gold. 
Reserves and resources notes (cont’d) 
Appendix 9
63 
Guidance assumptions 
Spot: 
2014 
Gold price ($/oz) 
1,300 
Silver price ($/oz) 
20.00 
Copper price ($/oz) 
3.25 
AUD/USD 
1.14 
CDN/USD 
1.11 
MXN/USD 
13.00 
Spot 
Gold price ($/oz) 
1,255 
Silver price ($/oz) 
19.05 
Copper price ($/oz) 
3.10 
AUD/USD 
1.09 
CDN/USD 
1.10 
MXN/USD 
13.20 
Commodity price/foreign exchange assumptions 
Appendix 10
Endnotes 
64 
CAUTIONARY NOTE TO U.S. READERS CONCERNING ESTIMATES OF MINERAL RESERVES AND MINERAL RESOURCES 
Information concerning the properties and operations of New Gold has been prepared in accordance with Canadian standards under applicable Canadian securities laws, and may not be comparable to similar information for United States companies. The terms “Mineral Resource”, “Measured Mineral Resource”, “Indicated Mineral Resource” and “Inferred Mineral Resource” used in this Report are Canadian mining terms as defined in the Canadian Institute of Mining, Metallurgy and Petroleum (“CIM”) Definition Standards for Mineral Resources and Mineral Reserves adopted by CIM Council on November 27, 2010 and incorporated by reference in National Instrument 43-101 (“NI 43-101”). While the terms “Mineral Resource”, “Measured Mineral Resource”, “Indicated Mineral Resource” and “Inferred Mineral Resource” are recognized and required by Canadian securities regulations, they are not defined terms under standards of the United States Securities and Exchange Commission. As such, certain information contained in this Report concerning descriptionsof mineralization and resources under Canadian standards is not comparable to similar information made public by United States companies subject to the reporting and disclosure requirements of the United States Securities and Exchange Commission. 
An “Inferred Mineral Resource” has a great amount of uncertainty as to its existence and as to its economic and legal feasibility. Under Canadian rules, estimates of Inferred Mineral Resources may not form the basis of feasibility or pre-feasibility studies. It cannot be assumed that all or any part of an “Inferred Mineral Resource” will ever be upgraded to a higher confidence category. Readers are cautioned not to assume that all or any part of an “Inferred Mineral Resource” exists or is economically or legally mineable. 
Under United States standards, mineralization may not be classified as a “Reserve” unless the determination has been made that the mineralization could be economically and legally produced or extracted at the time the Reserve estimation is made. Readers are cautioned not to assume that all or any part of the Measured or Indicated Mineral Resources that are not Mineral Reserves will ever be converted into Mineral Reserves. In addition, the definitions of “Proven Mineral Reserves” and “Probable Mineral Reserves” under CIM standards differ in certain respects from the standards of the United States Securities and Exchange Commission. 
TECHNICAL INFORMATION 
The scientific and technical information in this presentation has been reviewed and approved by Mark A. Petersen, Vice President, Exploration of New Gold. Mr. Petersen is an AIPG Certified Professional Geologist and a “qualified person” under National Instrument 43-101. For additional information with respect to ourMineral Resource and Reserve estimates and the Feasibility Studies discussed herein, refer to our news release dated February 6, 2014, the Rainy River Technical Report, the Blackwater Technical Report and our other technical reports available at www.sedar.com.
Endnotes (cont’d) 
65 
NON-GAAP MEASURES 
(1) ALL-IN SUSTAINING COSTS 
Consistent with guidance announced in 2013 by the World Gold Council, an association of various gold mining companies from around the world of which New Gold is a member, New Gold defines “all-in sustaining costs” per ounce as the sum of total cash costs, capital expenditures that are sustaining in nature, corporate general and administrative costs, capitalized and expensed exploration that is sustaining in nature and environmental reclamation costs, all divided by the ounces of gold soldtoarrive at a per ounce figure. New Gold believes this non-GAAP financial measure provides further transparency into costs associated with producing gold and will assist analysts, investorsand other stakeholders of the company in assessing the company’s operating performance, its ability to generate free cash flow from current operations and its overall value. This data is furnished to provide additional information and is a non-GAAP financial measure. All-in sustaining costs presented do not have a standardized meaning under GAAP and may not be comparable to similar measures presented by other mining companies. It should not be considered in isolation or as a substitute for measures of performance prepared in accordance with GAAP and is not necessarily indicative of cash flow from operations under GAAP or operating costs presented under GAAP. Further details regarding all-in sustaining costs and a reconciliation to the nearest GAAPmeasures are provided in our MD&As accompanying our financial statements filed from time to time on www.sedar.com. 
(2) TOTAL CASH COSTS 
“Total cash costs” per ounce figures are non-GAAP measures which are calculated in accordance with a standard developed by The Gold Institute, a worldwide association of suppliers of gold and gold products that ceased operations in 2002. Adoption of the standard is voluntary and the cost measures presented may not be comparable to other similarly titled measures of other companies. New Gold reports total cash costs on a sales basis. The company believes that certain investors use this information to evaluate the company’s ability to generate liquidity through operating cash flow and that this measure, along with sales, is considered to be a key indicator of the company’s ability to generate operating earnings and cash flow from its mining operations. Total cash costs include mine site operating costs such as mining, processing and administration costs, royalties, production taxes, and realized gains and losses on fuel contracts, but are exclusive of amortization, reclamation, capital and exploration costs and net of by-product sales. Total cash costs are then divided by ounces of gold sold to arrive at a per ounce figure. Co-product cash costs remove the impact of other metal sales that are produced as a by-product of gold production and apportion the cash costs to each metal produced on a percentage of revenue basis, and subsequently divides the amount by the total ounces of gold or silver or pounds of copper sold,as the case may be, to arrive at per ounce or per pound figures. Unless otherwise indicated, all total cash cost information in this presentation is net of by-product sales. These measures, along with sales, are considered to be a key indicator of a company’s ability to generate operating earnings and cash flow from its mining operations. This data is furnished to provide additional information and is a non-GAAP financial measure. Total cash costs and co-product cash costs presented do not have a standardized meaning under GAAP and may not be comparable to similar measures presented by other mining companies. It should not be considered in isolation or as a substitute for measures of performance prepared in accordance with GAAP and is notnecessarily indicative of cash flow from operations under GAAP or operating costs presented under GAAP. Further details regarding total cash costs and a reconciliation to the nearest GAAP measures are provided in our MD&As accompanying our financial statements filed from time to time on www.sedar.com. 
(3) ADJUSTED NET EARNINGS 
“Adjusted net earnings” and “adjusted net earnings per share” are non-GAAP financial measures. Net earnings have been adjusted and tax affected for the group of costs in “Other gains and losses” on the condensed consolidated income statement. The adjusted entries are also impacted for tax to the extent that theunderlying entries are impacted for tax in the unadjusted net earnings from continuing operations. The company uses this measure for its own internal purposes. Management’s internal budgets and forecasts and public guidance do not reflect fair value changes on senior notes and non-hedged derivatives, foreign currency translation and fair value through profit or loss and financial asset gains/losses. Consequently, the presentation of adjusted net earnings and adjusted net earnings per share enables investors and analysts to better understand the underlying operating performance of our core mining business through the eyes of management. Management periodically evaluates the components of adjusted net earnings and adjusted net earnings per share based on an internal assessment of performance measures that are useful for evaluating the operating performance of our business and a review of the non-GAAP measures used by mining industry analysts and other mining companies. Adjusted net earnings and adjusted net earnings per share are intended to provide additional information only and do not haveany standardized definition under IFRS and may not be comparable to similar measures presented by other companies. They should not be considered in isolation or as a substitute for measures of performance prepared in accordance with IFRS. The measures are not necessarily indicative of operating profit or cash flows from operations as determined under IFRS.
Endnotes (cont’d) 
66 
(4) OPERATING MARGIN 
“Operating margin” is a non-GAAP financial measure with no standard meaning under GAAP, which management uses to further evaluate the company’s results of operations in each reporting period. Operating margin is calculated as revenue less operating expenses and therefore does not include depreciation and depletion. Operating margin is intended to provide additional information only and does not have any standardized definition under IFRS; it should not be considered in isolation or as a substitute for measures of performance prepared in accordance with IFRS. Other companies may calculate this measure differently and this measure is unlikely to be comparable tosimilar measures presented by other companies. 
(5) ADJUSTED NET CASH GENERATED FROM OPERATIONS 
“Adjusted net cash generated from operations” is a non-GAAP financial measure. Net cash generated from operations has been adjusted for a one-time charge incurred in the second quarter of 2013 related to the settlement of the company’s legacy gold hedge position. The company believes the presentation of adjustednet cash generated from operations enables investors and analysts to better understand the underlying operating performance of our core mining business. Adjusted net cash generated fromoperations is intended to provide additional information only and does not have any standardized meaning under IFRS. It should not be considered in isolation or as a substitute for measures of performance prepared in accordance with IFRS.
Contact information 
67 
Investor Relations 
Hannes Portmann 
Vice President, CorporateDevelopment 
416-324-6014 
hannes.portmann@newgold.com

Denver Gold Presentation 2014

  • 1.
  • 2.
    Cautionary statements 2 All monetary amounts in U.S. dollars unless otherwise stated Total cash costs shown net of by-product sales unless otherwise stated CAUTIONARY NOTE REGARDING FORWARD-LOOKING STATEMENTS Certaininformationcontainedinthispresentation,includinganyinformationrelatingtoNewGold’sfuturefinancialoroperatingperformanceare“forwardlooking”.Allstatementsinthispresentation, otherthanstatementsofhistoricalfact,whichaddresseventsordevelopmentsthatNewGoldexpectstooccurare“forward-lookingstatements”.Forward-lookingstatementsarestatementsthatarenothistoricalfactsandaregenerally,butnotalways,identifiedbytheuseofforward-lookingterminologysuchas“plans”,“expects”,“isexpected”,“budget”,“scheduled”,“targeted”,“estimates”, “forecasts”,“intends”,“anticipates”,“projects”,“potential”,“believes”orvariationsofsuchwordsandphrasesorstatementsthatcertainactions,eventsorresults“may”,“could”,“would”,“should”, “might”or“willbetaken”,“occur”or“beachieved”orthenegativeconnotationofsuchterms.Forward-lookingstatementsinthispresentationinclude,amongothers,statementswithrespectto: guidanceforproduction,cashcostsandall-insustainingcosts;theresultsoftheRainyRiverFeasibilityStudy,includingtheexpectedproduction,costs,grades,plannedactivitiesforeachofthecompany’sprojects;andtargetedthroughputincreaseatNewAfton,targetedtimingforcommissioningandfullproductionrelatedtotheNewAftonmillexpansion,RainyRiverandsequencingofBlackwater. Allforward-lookingstatementsinthispresentationarebasedontheopinionsandestimatesofmanagementasofthedatesuchstatementsaremadeandaresubjecttoimportantriskfactorsanduncertainties,manyofwhicharebeyondNewGold’sabilitytocontrolorpredict.Certainmaterialassumptionsregardingourforward-lookingstatementsarediscussedinthispresentation,NewGold’smostrecentMD&A,itsAnnualInformationFormanditsTechnicalReportsfiledatwww.sedar.com.Inadditionto,andsubjectto,suchassumptionsdiscussedinmoredetailelsewhere,theforward-lookingstatementsinthispresentationarealsosubjecttothefollowingassumptions:(1)therebeingnosignificationdisruptionsaffectingNewGold’soperations;(2)politicalandlegaldevelopmentsinjurisdictionswhereNewGoldoperates,ormayinthefutureoperate,beingconsistentwithNewGold’scurrentexpectations;(3)theaccuracyofNewGold’scurrentmineralreserveandresourceestimates;(4)theexchangeratebetweentheCanadiandollar,Australiandollar,MexicanPesoandU.S.dollarbeingapproximatelyconsistentwithcurrentlevels;(5)pricesfordiesel, naturalgas,fueloil,electricityandotherkeysuppliesbeingapproximatelyconsistentwithcurrentlevels;(6)labourandmaterialcostsincreasingonabasisconsistentwithNewGold’scurrentexpectations;(7)permittingandarrangementswithFirstNationsandotherAboriginalgroupsinrespectofRainyRiverandBlackwaterbeingconsistentwithNewGold’scurrentexpectations;(8)allenvironmentalapprovals(includingtheenvironmentalassessmentprocessfortheBlackwaterandRainyRiverprojects),requiredpermits,licensesandauthorizationsbeingobtainedfromtherelevantgovernmentsandotherrelevantstakeholderswithintheexpectedtimelines;and(9)theresultsofthefeasibilitystudiesfortheRainyRiverandBlackwaterprojectsbeingrealized. Forward-lookingstatementsarenecessarilybasedonestimatesandassumptionsthatareinherentlysubjecttoknownandunknownrisks,uncertaintiesandotherfactorsthatmaycauseactualresults,levelofactivity,performanceorachievementstobemateriallydifferentfromthoseexpressedorimpliedbysuchforward-lookingstatements.Suchfactorsinclude,withoutlimitation: significantcapitalrequirements;pricevolatilityinthespotandforwardmarketsforcommodities;fluctuationsintheinternationalcurrencymarketsandintheratesofexchangeofthecurrenciesofCanada,theUnitedStates,Australia,MexicoandChile;discrepanciesbetweenactualandestimatedproduction,betweenactualandestimatedreservesandresourcesandbetweenactualandestimatedmetallurgicalrecoveries;changesinnationalandlocalgovernmentlegislationinCanada,theUnitedStates,Australia,MexicoandChileoranyothercountryinwhichNewGoldcurrentlyormayinthefuturecarryonbusiness;taxation;controls,regulationsandpoliticaloreconomicdevelopmentsinthecountriesinwhichNewGolddoesormaycarryonbusiness;thespeculativenatureofmineralexplorationanddevelopment,includingtherisksofobtainingandmaintainingthevalidityandenforceabilityofthenecessarylicensesandpermitsandcomplyingwiththepermittingrequirementsofeachjurisdictioninwhichNewGoldoperates,including,butnotlimitedto:inCanada,obtainingthenecessarypermitsfortheBlackwaterandRainyRiverprojects;inMexico,whereCerroSanPedrohasahistoryofongoinglegalchallengesrelatedtoourenvironmentalauthorization(EIS);andinChile,certainactivitiesbyElMorrohavebeendelayedduetolitigationrelatingtoitsenvironmentalpermit;thelackofcertaintywithrespecttoforeignlegalsystems,whichmaynotbeimmunefromtheinfluenceofpoliticalpressure,corruptionorotherfactorsthatareinconsistentwiththeruleoflaw;theuncertaintiesinherenttocurrentandfuturelegalchallengesNewGoldisormaybecomeapartyto;diminishingquantitiesorgradesofreservesandresources;competition;lossofkeyemployees;additionalfundingrequirements;risingcostsoflabour,supplies,fuelandequipment;actualresultsofcurrentexplorationorreclamationactivities; uncertaintiesinherenttominingeconomicstudiesincludingthefeasibilitystudiesforRainyRiverandBlackwater;theuncertaintywithrespecttoprevailingmarketconditionsnecessaryforapositivedevelopmentdecisionatBlackwater;changesinprojectparametersasplanscontinuetoberefined;accidents;labourdisputes;defectivetitletomineralclaimsorpropertyorcontestsoverclaimstomineralproperties;unexpecteddelaysandcostsinherenttoconsultingandaccommodatingrightsofFirstNationsandotherAboriginalgroups;uncertaintieswithrespecttoobtainingallnecessarysurfaceandotherlanduserightsortenureforRainyRiver;risks,uncertaintiesandunanticipateddelaysassociatedwithobtainingandmaintainingnecessarylicenses,permitsandauthorizationsandcomplyingwithpermittingrequirements,includingthoseassociatedwiththeenvironmentalassessmentprocessesforBlackwaterandRainyRiver.Inaddition,therearerisksandhazardsassociatedwiththebusinessofmineralexploration,developmentandmining,includingenvironmentaleventsandhazards,industrialaccidents,unusualorunexpectedformations,pressures,cave- ins,floodingandgoldbullionlosses(andtheriskofinadequateinsuranceorinabilitytoobtaininsurancetocovertheserisks)aswellas“RiskFactors”includedinNewGold’sdisclosuredocumentsfiledonandavailableatwww.sedar.com. Forward-lookingstatementsarenotguaranteesoffutureperformance,andactualresultsandfutureeventscouldmateriallydifferfromthoseanticipatedinsuchstatements.Alloftheforward- lookingstatementscontainedinthispresentationarequalifiedbythesecautionarystatements.NewGoldexpresslydisclaimsanyintentionorobligationtoupdateorreviseanyforward-lookingstatementswhetherasaresultofnewinformation,eventsorotherwise,exceptinaccordancewithapplicablesecuritieslaws. Thefootnotesandendnotestothispresentationcontainimportantinformation.Theendnotesarefoundattheendofthepresentation.
  • 3.
    Portfolio of assetsintop-ratedjurisdictions Invested and experienced team Amonglowest-cost producers with established track record Peer-leading growth pipeline A history of value creation New Gold investment thesis 3 18.5 Moz gold reserves(1) ~$100 million investment by Board & Management H1’14 all-in sustaining costs(2) of $707/oz ~900 Kozannual production potential from growth projects(3) +235% increase in share price since March 2009 1.For a detailed breakdown of Mineral Resources and Reserves by category, refer to New Gold’s Annual Information Form for the financial year ended December 31, 2013 dated March 28, 2014. Refer to Endnotes under the heading “Cautionary note to U.S. readers concerning estimates of Mineral Reserves and Mineral Resources” and “Technical Information”. 2.Refer to Endnote on all-in sustaining costs under the heading “Non-GAAP Measures”. 3.Based on ~325Koz annual production from Rainy River, ~485Koz annual production from Blackwater and ~90Koz annual production from ElMorro, as outlined in the feasibility studies for the projects. 1.For a detailed breakdown of Mineral Resources and Reserves by category, refer to New Gold’s Annual Information Form for the financial year ended December 31, 2013 dated March 28, 2014. Refer to Endnotes under the heading “Cautionary note to U.S. readers concerning estimates of Mineral Reserves and Mineral Resources” and “Technical Information”. 2.Refer to Endnote on all-in sustaining costs under the heading “Non-GAAP Measures”. 3.Based on ~325Koz annual production from Rainy River, ~485Koz annual production from Blackwater and ~90Koz annual production from ElMorro, as outlined in the feasibility studies for the projects.
  • 4.
    Portfolio of assetsin top-rated jurisdictions Blackwater New Afton Rainy River Mesquite Cerro San Pedro El Morro Peak Mines Mine Life: 17 years Mine Life: 10 years Mine Life: 14 years Mine Life: 8+ years Mine Life: 2+ years Mine Life: 17 years Mine Life: 6+ years #1 CANADA #3 UNITED STATES #5 MEXICO #4 CHILE #2 AUSTRALIA OPERATING DEVELOPMENT 4 All Assets Ranked in Top 5 Global Mining Jurisdictions(1) 1. Based on 2014 BehreDolbearReport –“2014 Ranking of Countries for Mining Investment”. 2. For a detailed breakdown of Mineral Resources and Reserves by category, refer to New Gold’s Annual Information Form for the financial year ended December 31, 2013 dated March 28, 2014. Refer to Endnotes under the heading “Cautionary note to U.S. readers concerning estimates of Mineral Reserves and Mineral Resources” and “Technical Information”. Gold 18.5 Moz Silver 90.1 Moz Copper 3.0 Blbs Mineral Reserves(2)
  • 5.
    Experienced and investedteam 5 BOARD OF DIRECTORS David EmersonFormer Canadian Cabinet Minister James EsteyFormer President, UBS Securities Canada Robert GallagherPresident & Chief ExecutiveOfficer VahanKololianFounder, TerraNovaPartners MartynKonigFormer Executive Chairman, European Goldfields Pierre LassondeChairman, Franco-Nevada Randall OliphantExecutive Chairman Raymond ThrelkeldChairman, NewmarketGold EXECUTIVE MANAGEMENT TEAM RandallOliphant Executive Chairman Robert GallagherPresident & Chief ExecutiveOfficer Brian PennyExecutive Vice President & Chief Financial Officer Approximately 1 million shares purchased by insiders year-to-date ~$100 million Collectively invested in New Gold
  • 6.
    6 1. Referto Endnote on total cash costs under the heading “Non-GAAP Measures”. 2. Refer to Endnote on all-in sustaining costs under the heading “Non-GAAP Measures”. Strong first half 2014 performance New Gold is pleased to reiterate its 2014 guidance for both production and costs GOLD PRODUCTION (Koz) 181H1 2014 380 –4202014 Guidance SILVER PRODUCTION (Koz) 835H1 2014 1,350 –1,7502014 Guidance COPPER PRODUCTION (Mlbs) 51H1 2014 92 –1002014 Guidance TOTAL CASH COSTS(1)($/oz) $253H1 2014 $320 –$3402014 Guidance ALL-IN SUSTAINING COSTS(2)($/oz) $707H1 2014 $815 –$8352014 Guidance
  • 7.
    Low cost producer •Peer-leading all-in sustaining costs(2) in first half 2014 •2014E all-in sustaining costs(2)to decrease by over $70 per ounce versus 2013 •Costs benefiting from depreciating Canadian and Australian dollars •Expect to generate ~$200 per ounce incremental margin versus average of peer companies 7 Lower costs driving higher margins(1) 1. Refer to Endnote on total cash costs under the heading “Non-GAAP Measures”. 2. Refer to Endnote on all-in sustaining costs under the heading “Non-GAAP Measures”. 2014 FIRST HALF ALL-IN SUSTAINING COSTS ($/oz)(2) 2014E FULL-YEAR ALL-IN SUSTAINING COSTS ($/oz)(2) $707 $809 $840 $844 $849 $874 $980 $988 $1,032 $1,048 $1,287 $825 $850 $950 $950 $975 $980 $990 $1,000 $1,125 $1,135 $1,150
  • 8.
    8 New Afton–Unlocking options 87 102-112 Gold (Koz) 72 78-84 Copper (Mlbs) 2013 2014E 2013 2014E +23% +13% •C-zone provides potential to extend mine life •Resource updated in July 2014 •4 drills actively exploring C-zone M&I Resource(3) 35 Million Tonnes H1’14 Operating Margin(1) $45 million ~12% increase in throughput ~2-3% increase in gold and copper recoveries +10 Kozper year gold(2) +10 Mlbsper year copper(2) 1. Operating margin calculated as revenue less operating expenses. 2. Based on targeted increases in throughput and recovery and year-end 2013 gold and copper reserve grade. 3. Mineral Resources are inclusive of Reserves. For detailed assumptions, risks and parameters relating to the above refer to New Gold’s Annual Information Form dated March 28, 2014. Refer also to Endnotes under the heading “Cautionary note to U.S. readers concerning estimates of Mineral Reserves and Mineral Resources” and “Technical Information” and New Gold’s New Afton C-zone resource news release dated July 7, 2014 available at www.sedar.com. Production Outperforming 2009 Technical Report Estimates Mill Expansion Capital CURRENT PERFORMANCE NEAR-TERM GROWTH FUTURE POTENTIAL •Mid-2015: Mill expansion to be completed At today’s prices, would increase annual cash flow by ~$30 million $134 million GOLD 0.77 g/t 0.9Moz COPPER 0.87% 0.7Blbs
  • 9.
    New Afton –C-zonepotential 9 Tonnes (000s) Gold (g/t) Copper (%) Gold (Koz) Copper (Mlbs) Measured 931 0.94 1.06 28 22 Indicated 33,941 0.76 0.86 832 646 Total M&I 34,872 0.77 0.87 860 668 Inferred 7,979 0.50 0.56 128 98 Total M&I 68,025 0.65 0.91 1,425 1,368 2014 MID-YEAR C-ZONE MINERAL RESOURCE ESTIMATE(1) 1. For detailed assumptions, risks and parameters relating to the above estimates refer to New Gold’s Annual Information Formdated March 28, 2014. Refer also to Endnotes under the heading “Cautionary note to U.S. readers concerning estimates of Mineral Reserves and Mineral Resources” and “Technical Information” and New Gold’s news release dated July 7, 2014 and September 11, 2014 available at www.sedar.com. 2013 YEAR-END B-ZONE MINERAL RESOURCE ESTIMATE(1) Drill Hole From (m) To (m) Interval (m) Estimated true width (m) Gold (g/t) Copper (%) EA-118 534 660 126 72 1.47 1.80 includes 534 612 78 1.96 2.36 EA-121 430 640 210 121 1.20 0.89 includes 448 524 76 1.92 1.01 EA-122 384 478 94 91 1.65 1.67 includes 394 444 50 2.39 2.30 EA-129A 658 724 66 54 1.33 1.67 includes 660 686 26 2.07 2.72 EA-132 492 582 90 80 1.30 1.89 includes 492 528 36 2.09 2.78 HIGHLIGHTS POST 2014 MID-YEAR MINERAL RESOURCE ESTIMATE(1) Mineralized Intercept Includes Intercept Diamond Drill Hole Trace Central Pierce Point EA-132 EA-123 EA-114 EA-118 EA-127 EA-121 EA-126 EA-128 EA-133 EA-125 EA-124A EA-131 EA-115 EA-129A EA-120 EA-116 EA-122 EA-119 EA-117 C-Zone Main B-Zone Block Cave Reserve June 2014 Resource Shell 0m 400m EA-130
  • 10.
    10 Rainy River–Project overview 1. Based on 2014 BehreDolbearReport –“2014 Ranking of Countries for Mining Investment”. 2. Mineral Resources are inclusive of Reserves. For a detailed breakdown of Mineral Resources and Reserves by category, refer to New Gold’sAnnual Information Form for the financial year ended December 31, 2013 dated March 28, 2014. Refer to Endnotes under the heading “Cautionary note to U.S. readers concerning estimates of Mineral Reserves and Mineral Resources” and “Technical Information”. 3. Refer to Endnote on total cash costs under the heading “Non-GAAP Measures”. 4. Refer to Endnote on all-in sustaining costs under the heading “Non-GAAP Measures”. 1.44 g/t ~325 Koz $613/oz $736/oz FIRST NINE YEARS –GRADE, PRODUCTION, COSTS JURISDICTION MANAGEABLE CAPITAL RESOURCE SCALE AND POTENTIAL Ontario, Canada 17km tie-in to power/ close to regional infrastructure •$885 million at $0.95 US$/C$ exchange rate •~70% of capital denominated in Canadian dollars Reserves(2)+3.8 Moz M&I Resources(2)+6.2 Moz Land Package +169 km2 Average Head Grade Average Annual Production Average Total Cash Costs(3) Average All-in Sustaining Costs(4) Country Ranking(1) $0.05 change in exchange rate ~$141 million in pre-tax NAV #1
  • 11.
    11 Rainy River–Progress milestones 2014 2015 2016 Q1 Q2 Q3 Q4 Q1 Q2 Q3 Q4 Q1 Q2 Q3 Q4 Complete FeasibilityStudy Submit Environmental Assessment Report Order Long LeadEquipment Award EPCMContract Detailed Engineering & Procurement ProvincialEnvironmental Assessment Approval Federal Environmental Assessment Approval Deliveryof Mobile Equipment Power LineConstruction Process Plant Construction Tailings & Water Management Facilities Construction CommencePre-Strip & Pit Development Commissioning Targeted milestones 1. Near-term milestones based on company plans which are consistent with timelines presented in the Rainy River Technical Report, entitled “Feasibility Study of the Rainy River Project, Ontario, Canada” dated February 14, 2014 and available on SEDAR. 2017 –First full year of production
  • 12.
    12 Rainy River–Progress update Project Development Capital Costs Description Cost ($ million) Direct Costs Process Equipment $127 Process Facilities –Construction $170 Site Development $111 OpenPit Mine Equipment $81 Overburdenand Waste Stripping $80 Tailingsand Water Management $48 Power Line and Roads $21 Total Direct Capital Costs $638 Owner's and Indirect Costs Owner's Costs $76 EPCM $48 Other Indirects $53 Total Owner's&Indirect Capital Costs $177 Subtotal $815 Contingency $70 Total Project (at US$/C$-0.95) $885 43% of pricing locked in 98% of pricing locked in AMEC engaged as EPCM partner 1. Project development capital costs based on Rainy River Technical Report, entitled “Feasibility Study of the Rainy River Project, Ontario, Canada” dated February 14, 2014 and available on SEDAR. ~70% of capital costs denominated in Canadian dollars
  • 13.
    13 Rainy River–Value creation through development INVESTMENT VALUE POTENTIAL $300million Acquisition cost 50%/ Cash 50% Shares $885million Development capital estimate(1) $1.2billion Total investment Average annual after-tax cash flow(2)(4) Potential cash flow multiple range(3) Implied value potential $215million 10-12x Development of Rainy River presents opportunity for $1.0 -$1.4 billion of potential value creation $2.2-$2.6billion 1. Based on $0.95 US$/C$ foreign exchange rate. 2. Based on first five years at $1,300 per ounce gold, $22 per ounce silver and $0.95 US$/C$ foreign exchange rate. 3. Potential multiple range based on New Gold’s current P/2014E CFPS multiple. 4. Based on the Technical Report on Feasibility Study for the Rainy River Project dated effective January 16, 2014.
  • 14.
    Blackwater 14 UPSIDE GOLD RESOURCE British Columbia, Canada BLACKWATER Regional Upside Significant Gold Resource Jurisdiction #1 Country Ranking(1) ~1,100 km2Land Package Initial resource at Capoose Multiple newly identified targets 1. Based on 2014 BehreDolbearReport –“2014 Ranking of Countries for Mining Investment”. 2. Development capital assumes $0.95 USD/CDN exchange rate. 3. Refer to Endnote on total cash costs under the heading “Non-GAAP Measures”. Total cash costs assume: Gold -$1,300/oz, Silver -$22.00/oz, USD/CDN -$0.95. 4. Refer to Endnote on all-in sustaining costs under the heading “Non-GAAP Measures”. All-in sustaining costs assume: Gold -$1,300/oz, Silver -$22.00/oz, USD/CDN -$0.95. 5. Mineral Resources are inclusive of Reserves. For a detailed breakdown of Mineral Resources and Reserves by category, refer to New Gold’s Annual Information Form for the financial year ended December 31, 2013 dated March 28, 2014. Refer to Endnotes under the heading “Cautionary note to U.S. readers concerning estimates of Mineral Reserves and Mineral Resources” and “Technical Information”. 2013 Feasibility Study First nine years: 485 Koz Annual Production ~$1,865 million Development Capital(2) $555/oz Total Cash Costs(3) $685/oz All-in Sustaining Costs(4) $0.05 change in exchange rate ~$270 million in pre-tax NAV 8.2 Moz Reserves(5) 17-year Mine Life 9.5 Moz M&I Resources(5)
  • 15.
    15 Blackwater –Valuecreation through development INVESTMENT VALUE POTENTIAL $630million 100% Shares $1,865million Development capital estimate(1) Potential cash flow multiple range(3) $375million Development of Blackwater presents opportunity for $1.3 -$2.0 billion of potential value creation 1. Based on $0.95 US$/C$ foreign exchange rate. 2. Based on first five years at $1,300 per ounce gold, $22 per ounce silver and $0.95 US$/C$ foreign exchange rate. 3. Potential multiple range based on New Gold’s current P/2014E CFPS multiple. 4. Based on the Technical Report on Feasibility Study for the Blackwater Project dated effective January 16, 2014. Average annual after-tax cash flow(2)(4) Acquisition cost $2.5billion Total investment Implied value potential $3.8-$4.5billion 10-12x
  • 16.
    El Morro 16 Chile EL MORRO Unique Joint Venture Structure Gold/Copper Reserve & Resources (30%) Jurisdiction 2011 Feasibility Study (30%) #4 Country Ranking(1) Goldcorp 70% partner Funds 100% of capital New Gold retains portion of cash flow from mine start-up 2.7 Moz@ 0.5 g/t Gold 2.0 Blbs@ 0.5% Copper Life of mine: 1. Based on 2014 BehreDolbearReport –“2014 Ranking of Countries for Mining Investment”. 2. Refer to Endnote on total cash costs under the heading “Non-GAAP Measures”. Total cash costs assume: Gold -$1,200/oz, Copper -$2.75/lb, Chilean Peso/USD -$550. 3. For a detailed breakdown of Mineral Resources and Reserves by category, refer to New Gold’s Annual Information Form for the financial year ended December 31, 2013 dated March 28, 2014. Refer to Endnotes under the heading “Cautionary note to U.S. readers concerning estimates of Mineral Reserves and Mineral Resources” and “Technical Information”. Reserves(3)– Open Pit Inferred Resources(3)– Potential Block Cave 1.1 Moz@ 1.0 g/t Gold 0.6 Blbs@ 0.8% Copper 85 Mlbs Annual Copper Production ($700/oz) Total Cash Costs(2) 90 Koz Annual Gold Production
  • 17.
    17 Organic pipeline •Mesquite return to run rate (2015+) •New Afton expansion (mid-2015) •Rainy River development (2015/2016) •CSP to residual leaching (2016) Existing low cost production base to be further enhanced by our lower cost development projects(1) •Sequence Blackwaterdevelopment •El Morro advanced GOLD PRODUCTION 1. Refer to Endnote on all-in sustaining costs under the heading “Non-GAAP Measures”. Rainy River and Blackwater life-of-mine all-in sustaining costs are estimated to be $736/oz and $685/oz, respectively, based on their respective Feasibility Studies. 2. Based on mid-point of 2014 guidance. 3. Based on expected annual production from current operations according to their respective mine plans, including positive production impact of New Afton’s mill expansion targeted for mid-2015, Mesquite mine plan moving into grades more in line with reserve grade, which is partially offset by Cerro San Pedro ceasing active mining and moving into residual leaching, and includes the first year of full production from Rainy River. Assumes on-time completion of Rainy River. 4. Based on ~325Koz annual production from Rainy River, ~485Koz annual production from Blackwater and ~90Koz annual production from ElMorro as outlined in the Feasibility Studies for these projects, and production contribution from New Afton, Mesquite and the Peak Mines according to their respective mine plans. Assumes the timely development of Blackwater and El Morro. 2014(2) 2017(3) FuturePotential(4)
  • 18.
    2009 2010 2011 2012 2013 2014E 2015E 2016E 2017E 18 Cash flow growth and value 1. For 2013, figure shown is Adjusted net cash generated from operations. Net cash generated from operations in the 2013 period included certain non-recurring cash flows. Net cash generated from operations in 2013 was $172 million. 2. 2014E based on Bloomberg consensus CFPS of $0.60 multiplied by 504 million basic shares outstanding. 3. 2015 to 2017 estimates based on the following price and exchange rate assumptions (which were also used for 2014 guidance): Gold -$1,300/oz, Silver -$22.00/oz, Copper -$3.25/lb, USD/CDN -$0.90, USD/AUD -$0.88. 2015 estimated cash flow assumes: successful mill expansion to 14,000 tonnesper day at New Afton in mid-2015, Mesquite moving into mining of higher grade areas of the open pit in 2015 in accordance with the current mine plan, Peak’s copper production increasing from 2014 levels in accordance with the current mine plan, and Cerro San Pedro mining higher grade material in its final year of activemining in accordance with the current mine plan. 2016 estimated cash flow assumes: New Afton processing for a full year at 14,000 tonnesper day, Mesquite remaining in higher grade areas in accordance with the current mine plan, Peak further increasing its copper production in accordance with the current mine plan, and Cerro San Pedro moving into its first year of residual leaching in accordance with the current mine plan. 2017 estimated cash flow assumes: Rainy River commercial production is achieved on schedule and Rainy River has its first full year of production in 2017with a production level consistent with the project’s feasibility study, New Afton processing 14,000 tonnesper day, Mesquite remaining in higher grade areas in accordance with the current mine plan, Peak further increasing its copper production in accordance with the current mine plan, and Cerro San Pedro continuing its residual leaching in accordance with the current mine plan. Assumes no non-recurring cash flows in 2014, 2015, 2016 and 2017. 4. Based on the average of the estimates by research analysts for the net asset values of the Blackwater and El Morro assets. NET CASH FROM OPERATIONS ($ MILLIONS) Trading at ~4.7x 2017E cash flow at 2014 guidance prices (2) (3) (3) (1) (3) $3.5 billion Enterprise Value $0.7 billion Consensus Blackwater and El Morro Value(4) $2.8 billion Enterprise Value (excluding Blackwater and El Morro) $79 $230 $183 $236 $249 $302 ~$400 ~$400 ~$600
  • 19.
    Catalysts 19 2014costs declining versus 2013 New Afton production and cash flow continues to increase New Afton C-zone exploration Rainy River regional exploration Blackwater regional exploration Rainy River permitting Blackwater permitting C-zone engineering study New Afton mill expansion Cash flow growth
  • 20.
    A history ofvalue creation Performance since March 2009 New Gold/Western Goldfields merger announcement 20 S&P/TSX Global Gold Index(1) Gold Price New Gold (NYSE) 1. S&P/TSX Global Gold Index includes 37 gold companies in various stages of development/production. 237% 37% (27%)
  • 21.
    New Gold investmentthesis 21 A history of value creation Peer-leading growth pipeline Amonglowest-cost producers with established track record Invested and experienced team Portfolio of assetsin top-ratedjurisdictions Establishing the leading intermediate gold company
  • 22.
    Appendices 22 Appendices Page 1.Financial information23 2.Consolidated operating performance28 3.New Afton34 4.Mesquite, Peak Mines, Cerro San Pedro 42 5.Rainy River45 6.Blackwater46 7.El Morro47 8.Exploration50 9.Reserves and Resources notes54 10.Commodity price/foreign exchange assumptions63
  • 23.
    $414 mm $256mm Liquidity Position $670 mm Cash and Equivalents(1) Undrawn Credit Facility(2) Strong balance sheet 23 1. Cash and equivalents as at June 30, 2014. 2. $44 million of total $300 million at August 14, 2014 used for Letters of Credit. 3. See Appendix 1 –Summary of debt for detailed breakdown of components of debt. •Face value $886 million in long-term debt(3) •Face value $300 million, 7.00% notes due in 2020 •Face value $500 million, 6.25% notes due in 2022 •$86 million in carried El Morro loan, payable out of El Morro project cash flow Appendix 1
  • 24.
    Summary of debt 24 Undrawn CreditFacility SeniorUnsecured Notes (April 2012) SeniorUnsecured Notes (November 2012) El Morro Funding Loan Face Value $300 million(1) $300million $500 million $86million Maturity 4 years with annual extensions permitted April 15, 2020 November 15, 2022 n/a Interest Rate See ‘Key features’ 7.00% 6.25% 4.58% Payable Revolving credit Semi-annually Semi-annually Uponstart of production Conversion price n/a n/a n/a n/a Current trading value n/a ~107 ~105 n/a Key features •Normal financial covenants Interest Rate •2.00-3.25% over LIBOR based on ratios •Standby fee of 0.45- 0.73% •Senior unsecured •Redeemableafter April 15, 2016 at 103.5% down to 100% of face after 2018 •Unlimited dividends if leverage ratio below 2:1 •Senior unsecured •Redeemable after November 15, 2017 at par plus half coupon,declining ratably to par •Unlimited dividends if leverage ratio below 2:1 New Goldto repay Goldcorp out of 80% of its 30% share of cash flow once El Morro starts production 1. $44 million of total $300 million at August 14, 2014 used for Letters of Credit. Appendix 1
  • 25.
    25 2014 capitalexpenditures by category New Afton ~$340 million Sustaining Capital: ~$145 million Growth Capital: ~$195 million Mesquite Peak Mines Cerro San Pedro Rainy River New Afton Cerro San Pedro Blackwater Total Capital Appendix 1 •H1’14 -$54 million •H1’14 -$63 million
  • 26.
    26 Growth capital •Set out below is a breakdown of expected 2014 capital expenditures at each site divided into two categories –sustaining capital and growth capital (future production growth and mine life extension) New Afton -$115 million Rainy River -$105 million Mesquite -$40 million Sustaining capital 48% 52% 100% 100% •$60 million –~2,500 metredevelopment, two new trucks, dam raise and surface ventilation upgrade •$35 million –mill expansion •$20 million –C-zone scoping level engineering and capitalized exploration •$60 million –property, plant and equipment •$35 million –detailed engineering, studies, environmental monitoring and permitting •$10 million –capitalized exploration •$28 million –four new trucks and leach pad expansion •$12 million –major components/building and tank construction 2014 capital expenditures by category Appendix 1
  • 27.
    27 Peak Mines-$40 million Cerro San Pedro -$28 million 100% 71% •$20 million –two haul trucks and site maintenance •$20 million –capitalized development and capitalized exploration •$20 million –capitalized stripping •$8 million –leach pad expansion 2014 capital expenditures by category Growth capital Sustaining capital New Gold’s 30% share of estimated 2014 El Morro capital costs of $6 million fully carried by Goldcorp Inc. Blackwater -$15 million 100% •$10 million –permitting •$5 million –engineering studies 29% Appendix 1
  • 28.
    New Afton 26 (1,262) (678) 54 (1,273) (671) Mesquite 18 993 1,413 44 928 1,191 Peak Mines 28 627 928 49 681 1,000 Cerro SanPedro 17 1,169 1,322 34 1,051 1,193 89 251 745 181 253 707 Margin per ounce(3) 1,053 559 1,053 599 New Afton co-product costs(1) Gold ($/oz) 442 643 427 636 Copper($/lb) 1.02 1.48 0.97 1.45 28 1. Refer to Endnote on total cash costs under the heading “Non-GAAP Measures”. 2. Refer to Endnote on all-in sustaining costs under the heading “Non-GAAP Measures”. 3. Based on second quarter average realized gold price of $1,304 per ounce and first half 2014 average realized gold price of$1,306 per ounce. 2014 SECOND QUARTER Gold production (000s ounces) Cash costs(1) ($/oz) All-in Sustaining costs(2) ($/oz) 2014 YEAR-TO-DATE Gold production (000s ounces) Cash costs(1) ($/oz) All-in Sustaining costs(2) ($/oz) Co-product cash costs(1) Co-product all-in sustaining costs(2) NEW AFTON 2014 SECOND QUARTER Co-product cash costs(1) Co-product all-in sustaining costs(2) NEW AFTON 2014 YEAR-TO-DATE 2014 second quarter mine-by-mine operating results Appendix 2
  • 29.
    $465 $418 $446 $421 $377 $320 - $340 $478 $557 $643 $766 $767 29 Among lowest cost producers in industry Industry New Gold 2014E Incremental Benefit to NGD Shareholder 2009 (2) New Gold versus Industry Average Total Cash Costs,(1) Net of By-Product Credits 1. Refer to Endnote on total cash costs under the heading “Non-GAAP Measures”. New Gold total cash costs based on 2014 guidance. 2. Industry data per GFMS reports calculated net of by-product credits for the year ended December 31, 2013. Appendix 2
  • 30.
    30 2013 SECONDQUARTER 2014 SECOND QUARTER Revenues ($ million) $178 $184 $369 $385 Operating margin(1)($ million) 83 78 175 174 Adjusted net earnings(2)($ million) 8 4 26 25 Adjusted netearnings per share(2)($/share) 0.02 0.01 0.05 0.05 Net earnings ($ million) 16 15 14 51 Net earningsper share ($/share) 0.03 0.03 0.03 0.11 Adjustednet cash generated from operations(3)($ million) 59 43 141 102 Net cash generated from operations ($ million) 59 (23) 141 36 Averagerealized gold price ($ per ounce) 1,304 1,276 1,306 1,383 Average realized copperprice ($ per pound) 3.09 3.06 3.03 3.23 Average realized silver price ($ per ounce) 19.53 21.41 19.97 25.12 1. Refer to Endnote on operating margin under the heading “Non-GAAP Measures”. 2. Refer to Endnote on adjusted net earnings under the heading “Non-GAAP Measures”. 3. Refer to Endnote on adjusted net cash generated from operations under the heading “Non-GAAP Measures”. 2014 second quarter financial summary Appendix 2 2013 FIRST HALF 2014 FIRST HALF
  • 31.
    31 Detailed operatingresults and assumptions Appendix 2 2013A2013A2013A2013ATonnes processed(000 tonnes)14,29713,000-13,30013,46313,400-13,800814830-8504,0874,500-4,700Tonnes mined(000 tonnes)48,20656,000-58,00031,01833,000-35,0001,1001,300-1,3204,2264,600-4,800Strip ratio2.373.31-3.361.301.46-1.54-------------- Gold grade(g/t)0.370.40-0.440.470.35-0.404.143.9-4.10.780.81-0.85Silver grade(g/t)-------20.9115.0-17.0-------------- Copper grade(%)--------------0.85%0.86%-0.90%0.93%0.93%-0.95% Gold recovery(%)63.0%51.0%92.9%91.0%-93.0%85.1%85.0%-87.0% Silver recovery(%)-------15.0%-------------- Copper recovery(%)--------------88.0%91.0%-93.0%85.9%86.0%-88.0% ProductionGold production(Koz)107.0113.0-123.0102.870.0-80.0100.795.0-105.087.2102.0-112.0Silver production (Koz)-------1,300.61,100.0-1,300.0-------------- Copper production(Mlbs)--------------13.414.0-16.072.078.0-84.0Reserve gradeGold grade(g/t) Silver grade(g/t) Copper grade(%) 3.527.11.22% 0.562.20.84% 0.60-- -- 0.4618.1-- Mesquite2014E2014ENew AftonCerro San Pedro2014EPeak Mines2014E~50% ~15% ~65%
  • 32.
    32 2014 totalcash cost sensitivities Appendix 2 Category Copper Price Silver Price AUD/USD CDN/USD MXN/USD Diesel Base Assumption $3.25 $20.00 $1.14 $1.11 $13.00 $3.25 Sensitivity +/- $0.25 +/- $1.00 +/- $0.05 +/- $0.05 +/- $1.00 +/- $0.25 Total Cash Costs(1) - Impact New Afton +/-$200 - - +/-$65 - - Mesquite - - - - - +/-$15 Peak Mines +/-$40 - +/-$50 - - - Cerro San Pedro - +/-$15 - - +/-$50 - New Gold Consolidated +/-$60 +/-$5 +/-$15 +/-$15 +/-$10 +/-$5 Total Cash Costs(1) - Sensitivities 1. Refer to Endnote on total cash costs under the heading “Non-GAAP Measures”.
  • 33.
    33 1. Referto Endnote on total cash costsunder the heading “Non-GAAP Measures”. 2. General and administrative includes stock-based compensation and asset retirement obligation. 3. Sustaining capital based on New Gold’s total 2014 estimated capital expenditures excluding expenditures related to growth-related initiatives. 4. Refer to Endnote on all-in sustaining costs under the heading “Non-GAAP Measures”. 2014 estimated all-in sustaining costs Total cash costs(1) ~$330/oz General and administrative(2) ~$90/oz Exploration expense ~$35/oz Sustaining capital(3) ~$370/oz ALL-IN SUSTAINING COSTS(4) ~$825/oz Appendix 2
  • 34.
    34 New Afton–2014 guidance GOLD PRODUCTION (Koz) COPPER PRODUCTION (Mlbs) ALL-IN SUSTAINING COSTS(2)($/oz) TOTAL CASH COSTS(1)($/oz) 102 –112 78 –84 ($1,260) – ($1,240) ($620) – ($600) TOTAL CASH COSTS(1) $440 – $460 $1.10 – $1.20 Co-Product Gold ($/oz) Co-Product Copper ($/lb) •Copper price -$3.25 per pound (2013A -$3.23 per pound) •Canadian dollar: U.S. dollar exchange – $1.11 •$0.25 per pound change in copper equals ~$200 per ounce change in New Afton total cash costs •$0.01 change in Canadian dollar equals ~$15 per ounce change in New Afton total cash costs •Gold and copper production expected to increase due to: •Increase in average annual throughput rate •Increase in gold grades •Costs benefit from targeted increase in copper production, depreciating Canadian dollar and decrease in sustaining capital costs OVERVIEW KEY ASSUMPTIONS AND SENSITIVITIES 1. Refer to Endnote on total cash costs under the heading “Non-GAAP Measures”. 2. Refer to Endnote on all-in sustaining costs under the heading “Non-GAAP Measures”. Appendix 3
  • 35.
    New Facilities ToTailings Surface Stockpile Mill schematic 35 North Appendix 3
  • 36.
    New Afton –Expansiontimeline 36 •EPCM contract award •Geotechnical and detailed engineering •Early works •Buried services relocation •Reagent tank relocation H1’15 •Excavation •Foundations •Building construction •Building services •Vertimilldelivery •Piping/electrical •Instrumentation •Commissioning H2’14 H1’14 Appendix 3
  • 37.
    Mill expansion capitalestimates 37 Engineering, Constructionand Equipment $26 million Building and Site Works $12 million Owner’s Costs $2 million Contingency $5 million ESTIMATED EXPANSION CAPITAL $45 MILLION •Below is a summary of the key capital estimates for the expansion project Target: 14,000 tonnes per day at higher metal recoveries •~$35 million of capital to be spent in 2014 with remainder in 2015 Appendix 3
  • 38.
    38 •C-zone originallyidentified through limited deep holes drilled from surface •Drilling from underground commenced in second half of 2012 •During 2013 completed 41 holes totaling 26,800 metresand updated resource •In July 2014, announced 24% increase in Measured and Indicated resource over year-end 2013 figures •Mid-year resource includes an additional 15,143 metresof drilling in 20 core holes Tonnes (000s) Gold (g/t) Copper (%) Gold (Koz) Copper (Mlbs) Measured 931 0.94 1.06 28 22 Indicated 33,941 0.76 0.86 832 646 Total M&I 34,872 0.77 0.87 860 668 Inferred 7,979 0.50 0.56 128 98 2014 MID-YEAR C-ZONE(1) 1. For a detailed breakdown of Mineral Resources and Reserves by category, refer to Appendix 2. Refer to Endnotes under the heading “Cautionary note to U.S. readers concerning estimates of Mineral Reserves and Mineral Resources” and “Technical Information”. C-zone resource updated on July 7, 2014. 2. 2012 information per Annual Information Form dated March 27, 2013. 2012 YEAR-END C-ZONE(2) Tonnes (000s) Gold (g/t) Copper (%) Gold (Koz) Copper (Mlbs) Measured 400 0.60 0.73 8 6 Indicated 2,900 0.63 0.68 58 43 Total M&I 3,300 0.62 0.68 66 49 Inferred 13,600 0.70 0.76 307 228 New Afton –C-zone resource expansion Appendix 3 Tonnes (000s) Gold (g/t) Copper (%) Gold (Koz) Copper (Mlbs) Measured 618 0.75 0.91 15 12 Indicated 25,223 0.84 0.91 678 504 Total M&I 25,842 0.83 0.91 693 516 Inferred 11,288 0.63 0.64 227 159 2013 YEAR-END C-ZONE(1)
  • 39.
    39 New Afton–C-zone September 2014 exploration update(1) Appendix 3 1. For detailed assumptions, risks and parameters relating to the above estimates refer to New Gold’s Annual Information Formdated March 28, 2014. Refer also to Endnotes under the heading “Cautionary note to U.S. readers concerning estimates of Mineral Reserves and Mineral Resources” and “Technical Information” and New Gold’s news release dated July 7, 2014 and September 11, 2014 available at www.sedar.com. Drill Hole From (m) To (m) Interval (m) True Width (m) Au (g/t) Cu (%) EA14-114 0 150 150 No assays 150 707 557 0.08 0.02 EA14-115 0 300 300 No assays 300 706 406 0.13 0.03 C-Zone 706 786 80 55 1.07 1.40 Includes 728 752 24 1.82 2.51 786 819 33 0.17 0.14 EA14-116 0 100 100 No assays 100 494 394 0.13 0.03 C-Zone 494 568 74 52 0.95 0.94 Includes 494 534 40 1.49 1.50 568 601 33 0.14 0.12 EA14-117 0 2 2 No assays 2 630 628 0.08 0.04 C-Zone 630 672 42 21 0.81 0.55 672 743 71 0.13 0.07 EA14-118 0 150 150 No assays 150 534 384 0.23 0.04 C-Zone 534 660 126 72 1.47 1.80 Includes 534 612 78 1.96 2.36 660 679 19 0.13 0.03 EA14-119 0 100 100 No assays 100 418 318 0.11 0.03 C-Zone 418 534 116 89 0.59 0.71 534 587 53 0.19 0.14 EA14-120 0 300 300 No assays 300 612 312 0.10 0.02 C-Zone 612 684 72 61 0.81 0.98 684 721 37 0.26 0.16 EA14-121 0 2 2 No assays 2 430 428 0.15 0.04 C-Zone 430 640 210 121 1.20 0.89 Includes 448 524 76 1.92 1.01 EA14-122 0 100 100 No assays 100 384 284 0.08 0.03 C-Zone 384 478 94 91 1.65 1.67 Includes 394 444 50 2.39 2.30 478 528 50 0.31 0.25 528 538 10 0.08 0.04 EA14-123 0 50 50 No assays 50 502 452 0.16 0.07 C-Zone 502 600 98 87 1.49 1.97 Includes 532 574 42 2.04 2.56 Drill Hole From (m) To (m) Interval (m) True Width (m) Au (g/t) Cu (%) EA14-124A 0 300 300 No assays 300 714 414 0.15 0.03 C-Zone 714 792 78 58 1.07 1.25 792 825 33 0.08 0.12 EA14-125 0 100 100 No assays 100 392 292 0.08 0.03 C-Zone 392 502 110 78 1.35 1.73 Includes 392 428 36 2.26 3.34 502 561 59 0.10 0.04 EA14-126 0 456 456 0.17 0.06 C-Zone 456 650 194 98 0.85 0.75 Includes 490 556 66 1.47 0.93 Includes 624 650 26 0.96 1.53 650 654 4 0.11 0.05 EA14-127 0 150 150 No assays 150 526 376 0.13 0.03 526 648 122 72 0.98 1.28 Includes 570 596 26 1.61 1.78 Includes 620 648 28 1.22 1.63 EA14-128 0 100 100 No assays 100 382 282 0.05 0.03 C-Zone 382 476 94 86 1.78 1.96 Includes 384 444 60 2.49 2.69 476 522 46 0.26 0.32 444 548 104 0.07 0.09 EA14-129A 0 300 300 No assays 300 658 358 0.09 0.03 C-Zone 658 724 66 54 1.33 1.67 Includes 660 686 26 2.07 2.72 724 759 35 0.40 0.08 EA14-130 1 266 265 0.17 0.04 C-Zone 520 632 112 76 0.76 0.95 Includes 550 584 34 1.60 1.62 632 718 86 0.15 0.05 EA14-131 0 100 100 No assays 100 660 560 0.16 0.03 C-Zone 660 728 68 52 1.15 1.24 Includes 660 684 24 2.08 2.12 728 758 30 0.05 0.07 EA14-132 0 150 150 No assays 150 492 342 0.17 0.05 C-Zone 492 582 90 80 1.30 1.89 Includes 492 528 36 2.09 2.78 582 630 48 0.09 0.05 EA14-133 0 300 300 No assays 300 540 240 0.29 0.04 C-Zone 540 658 118 57 1.01 1.28 Includes 594 630 36 1.99 2.27 658 712 54 0.06 0.04
  • 40.
    New Afton –2014C-zone program 40 Appendix 3 Ore Shell Delineation & Infill (Priority 1) Western ExplorationStep-out (Priority 3) Delineation & Infill (Priority 2) ~30,000-35,000 metres of drilling planned in C Zone for 2014 Extraction Level C-Zone
  • 41.
    41 New Goldhas a track record of successful mine development Mine development –Creating options Once mines are in production –multiple options to further enhance value Cerro San Pedro (April 2007) –~35,000 tonne per day open pit/heap leach Mesquite (January 2008) –~40,000 tonne per day open pit/heap leach New Afton (June 2012) –11,000 tonne per day block cave/process facility Mine life extension (Mesquite(1), Peak Mines(2), New Afton C-zone) Increased production rate (Cerro San Pedro(3), New Afton) 1.Mesquite’s mine life has been extended beyond the 9.5 years that were estimated when the mine re-started production in January 2008. 2.The Peak Mines originally began production in 1992 with an approximate eight year life and have operated continuously since then and continue to have six or more years of mine life. 3.During 2011 and 2012, Cerro San Pedro operated at a rate above its design capacity to increase its annual gold and silver production. Appendix 3
  • 42.
    42 •Diesel comprises~25% of Mesquite’s total costs •Rack diesel price most correlated to Brent oil price •Diesel price -$3.25 per gallon •Every $0.25 per gallon change in diesel price has ~$15 per ounce impact on total cash costs •Production increase driven by planned mining of higher grades versus 2013 •Increase in costs attributable to increase in total tonnes mined •Peak year for sustaining capital at Mesquite Mesquite –2014 guidance GOLD PRODUCTION (Koz) OVERVIEW KEY ASSUMPTIONS AND SENSITIVITIES ALL-IN SUSTAINING COSTS(2)($/oz) TOTAL CASH COSTS(1)($/oz) 1. Refer to Endnote on total cash costs under the heading “Non-GAAP Measures”. 2. Refer to Endnote on all-in sustaining costs under the heading “Non-GAAP Measures”. 113 –123 $930 – $950 $1,310 – $1,330 Appendix 4
  • 43.
    43 •Copper price-$3.25 per pound (2013A -$3.29 per pound) •Australian dollar: U.S. dollar exchange –$1.14 •$0.25 per pound change in copper equals ~$40 per ounce change in Peak Mines total cash costs •$0.01 change in Australian dollar equals ~$10 per ounce change in Peak Mines total cash costs •Gold production in line with 2013 •Increase in copper production a result of increased copper grade and recovery •Decrease in total cash costs a result of increased copper by-product revenue, depreciating Australian dollar and increased productivity through lower turnover Peak Mines –2014 guidance GOLD PRODUCTION (Koz) COPPER PRODUCTION (Mlbs) OVERVIEW KEY ASSUMPTIONS AND SENSITIVITIES ALL-IN SUSTAINING COSTS(2)($/oz) TOTAL CASH COSTS(1)($/oz) 1. Refer to Endnote on total cash costs under the heading “Non-GAAP Measures”. 2. Refer to Endnote on all-in sustaining costs under the heading “Non-GAAP Measures”. 95 –105 14 –16 $630 – $650 $1,065 – $1,085 Appendix 4
  • 44.
    44 •Silver price-$20.00 per ounce (2013A –$23.61 per ounce) •Mexican peso: U.S. dollar exchange – $13.00 •$1.00 per ounce change in silver equals ~$15 per ounce change in Cerro San Pedro total cash costs •$1.00 change in Mexican peso equals ~$50 per ounce change in Cerro San Pedro total cash costs •Decrease in production reflects the increased strip ratio for Phase 5 pushback and mining of lower grade ore •Increase in costs primarily driven by lower gold production, lower silver by- product revenue and increased volume of processing reagents Cerro San Pedro –2014 guidance GOLD PRODUCTION (Koz) SILVER PRODUCTION (Moz) OVERVIEW KEY ASSUMPTIONS AND SENSITIVITIES ALL-IN SUSTAINING COSTS(2)($/oz) TOTAL CASH COSTS(1)($/oz) 1. Refer to Endnote on total cash costs under the heading “Non-GAAP Measures”. 2. Refer to Endnote on all-in sustaining costs under the heading “Non-GAAP Measures”. 70 –80 1.1 –1.3 $1,030 – $1,050 $1,125 – $1,145 Appendix 4
  • 45.
    45 •21,000 tonneper day process plan with conventional crushing, grinding, leaching and carbon-in-pulp technology •Targeted commissioning in 2016 with first year of full production in 2017 •14-year mine life with direct processing of open pit and underground ore for first nine years and processing of a combination of stockpile and underground ore thereafter •Development capital of $885 million inclusive of $70 million contingency (at $1.05 CDN/USD) •Life-of-mine gold and silver recoveries of 91% and 64% •Open pit mining schedule incorporates an elevated cut-off grade strategy during first nine years Rainy River –Project overview Appendix 5 Pre-tax Economics Gold Price ($/oz) 1,150 1,300 1,300 1,450 1,600 US$/C$ exchange 0.93 0.95 0.91 0.97 1.00 5% NPV ($mm) 138 438 551 738 1,009 IRR (%) 7.8 13.1 15.3 17.6 21.1 Payback (years) 6.8 5.4 4.8 4.3 3.6 After-tax Economics Gold Price ($/oz) 1,150 1,300 1,300 1,450 1,600 US$/C$ exchange 0.93 0.95 0.91 0.97 1.00 5% NPV ($mm) 100 314 396 520 706 IRR (%) 7.1 11.3 13.2 14.9 17.8 Payback (years) 6.8 5.5 5.0 4.4 3.8
  • 46.
    46 •Conventional truckand shovel open pit mine with 60,000 tonne per day processing plant •Simple, conventional flowsheetusing whole ore leach process •Low grade stockpiling strategy •Development capital of $1,865 million inclusive of $190 million contingency (at $1.05 CDN/USD) •Life-of-mine operational strip ratio of 1.88 to 1 •Life-of-mine gold and silver recoveries of 87% and 49% •Conventional waste rock and Tailings Storage Facility •Power supply from the hydroelectric power grid, via 140-kilometre transmission line •Minimal off-site infrastructure required •Good existing access road; water supply within 15 kilometres •Low environmental risk and facility designed for closure Blackwater –Project overview Appendix 6 Pre-tax Economics Gold Price ($/oz) 1,150 1,300 1,300 1,450 1,600 US$/C$ exchange 0.93 0.95 0.91 0.97 1.00 5% NPV ($mm) 402 991 1,209 1,582 2,120 IRR (%) 7.8 11.3 12.9 14.4 16.8 Payback (years) 7.5 6.2 5.6 5.1 4.5
  • 47.
    47 1. Capitalestimates based on December 2011 Feasibility Study. El Morro (30%) –Funding structure Funded by $1.2 billion interest at 4.58% ~ $2.7 billion 70% 20% 80% •New Gold’s 30% share of development capital 100% carried •Interest fixed at 4.58% 30% 70% 30% Total Capital 100% ~ $3.9 billion(1) 100%Average annual cash flow Carried funding repayment Appendix 7
  • 48.
    48 2013 openpit Proven and Probable reserves and Measured and Indicated resources UndergroundInferredresourcewithblock cave potential 500 metres La Fortuna deposit Appendix 7 Reserve Grade Gold: 0.46 g/t Copper: 0.49% Inferred Grade Gold: 0.97 g/t Copper: 0.78%
  • 49.
    49 1. Allreserve information taken from Goldcorp’s December 31, 2013 year-end resource statements. 2. Gold equivalent calculated based on the following commodity prices: Gold -$1,300/oz; Silver -$22.00/oz; Copper -$3.00/lb; Lead -$0.90/lb; Zinc -$0.90/lb. El Morro relative positioning(1) EL MORRO WITHIN GOLDCORP PORTFOLIO Asset Gold Reserves (Moz) Asset Gold Equivalent(2)(Moz) Penasquito 11.6 Penasquito 30.6 Los Filos 8.0 El Morro 18.0 El Morro 6.7 Los Filos 8.9 Pueblo Viejo 6.5 Pueblo Viejo 7.5 CerroNegro 5.7 Cerro Negro 6.6 Appendix 7
  • 50.
    50 New Gold’sestimated exploration budget for 2014 is $50 million •Capitalized: $30 million (included in sustaining capital total shown previously) •Expensed: $20 million (approximately 70% related to current operations) New Afton 30,000-35,000 metres Peak Mines 45,000 metres Blackwater 10,000-15,000 metres 2014 exploration program overview Rainy River 35,000-40,000 metres 1. Circle proportions are representative of both capitalized and expensed exploration for each respective asset. Appendix 8 $15 million $15 million $11 million $9 million
  • 51.
    Rainy River exploration 51 •Intrepid resource drilled off and incorporated into Feasibility Study •Condemnation drilling program approximately 40% complete by year end •Improved ability to predict prospective ore horizons beneath surface cover 2013 ACHIEVEMENTS 2014 PROGRAM Targeting resource expansion in near-mine environment •Complete condemnation drilling program •Test potential to expand open pit resource to west •Explore prospective trends south of main mine area and extending from Intrepid Zone Intrepid Zone Appendix 8
  • 52.
    Blackwater exploration 52 2013 Achievement •Expanded exploration targeting coverage to ~50% of claim block •14 prospective target areas identified to date •Seven new targets drill tested with favorable geology intercepted on six and gold mineralization intercepted on three •Acquired Key property immediately south of Blackwater deposit area 2014 Program •Follow up favorable results at Van Tine, Fawn and earlier stage prospects •Initiate exploration at Key Appendix 8
  • 53.
    Peak Mines exploration 53 •Near-mine exploration and resource conversion partially offset mine depletion •Advanced earlier stage targets along regional Rookery fault trend 2013 ACHIEVEMENTS 2014 PROGRAM Focus on reserves replacement in near-mine environment •Convert Measured and Indicated resources to reserves to extend mine life •Test newly emerging targets along mine corridor •Continue to advance earlier stage regional targets Appendix 8
  • 54.
    54 1. 2012information per Annual Information Form dated March 27, 2013 2. New Afton C-zone updated for July 7, 2014 news release. Reserves and resources summary Appendix 9 Gold KozSilver KozCopper MlbsGold KozSilver KozCopper MlbsProven and Probable Reserves18,538 90,080 2,953 7,752 31,256 3,282 Measured and Indicated Resources (inclusive of Reserves)27,672 125,018 4,505 21,403 131,847 4,061 Inferred Resources4,062 30,145 1,759 4,383 84,620 1,114 M&I Resources (inclusive of Reserves) New Afton2,464 8,305 2,140 1,979 6,830 1,818 Mesquite4,904 - - 5,684 - - Peak Mines810 1,380 158 880 1,350 146 Cerro San Pedro397 15,948 - 1,703 57,980 - Rainy River6,236 14,635 - n/an/an/aBlackwater9,500 70,130 - 8,070 56,190 - Capoose320 14,620 - 196 9,497 - El Morro3,041 - 2,207 2,891 - 2,097 Total M&I27,672 125,018 4,505 21,403 131,847 4,061 Mineral Reserves and Resources SummaryAs at December 31, 2013As at December 31, 2012(1)
  • 55.
    55 Reserves andresources summary (cont’d) Appendix 9 1. 2012 information per Annual Information Form dated March 27, 2013. Tonnes000'sGoldg/tSilverg/tCopper% GoldKozSilverKozCopperMlbsTonnes000'sGoldg/tSilverg/tCopper% GoldKozSilverKozCopperMlbsNew AftonProven- - - - - - - - - - - - - - Probable48,821 0.56 2.2 0.84 879 3,500 904 52,500 0.65 2.3 0.93 1,100 3,880 1,080 Total New Afton P&P48,821 0.56 2.2 0.84879 3,500 904 52,500 0.65 2.3 0.931,100 3,880 1,080 MesquiteProven3,809 0.70 - - 86 - - 13,140 0.68 - - 287 - - Probable112,094 0.60 - - 2,152 - - 114,409 0.56 - - 2,055 - - Total Mesquite P&P115,903 0.60 - - 2,237 - - 127,549 0.57 - - 2,342 - - Peak MinesProven1,820 4.35 6.7 1.16255 390 47 2,109 5.89 7.5 1.08399 510 50 Probable1,820 2.69 7.4 1.27 157 430 51 2,118 3.82 6.8 1.18 260 466 55 Total Peak Mines P&P3,640 3.52 7.1 1.22412 820 98 4,227 4.85 7.2 1.13659 976 105 Cerro San PedroProven12,982 0.47 17.5 - 197 7,311 - 21,100 0.52 17.1 - 353 11,600 - Probable13,714 0.44 18.7 - 195 8,239 - 26,400 0.48 17.4 - 407 14,800 - Total CSP P&P26,696 0.46 18.1 - 392 15,550 - 47,500 0.50 17.3 - 760 26,400 - Mineral Reserves statement as at December 31, 2013Contained metalMetal gradeMetal gradeContained metalMineral Reserves statement as at December 31, 2012
  • 56.
    56 Reserves andresources summary (cont’d) Appendix 9 1. 2012 information per Annual Information Form dated March 27, 2013. Tonnes000'sGoldg/tSilverg/tCopper% GoldKozSilverKozCopperMlbsTonnes000'sGoldg/tSilverg/tCopper% GoldKozSilverKozCopperMlbsRainy RiverDirect processing materialOpen PitProven15,839 1.47 2.0 - 746 1,038 - Probable46,866 1.26 3.1 - 1,896 4,594 - Open Pit P&P (direct processing)62,705 1.31 2.8 - 2,642 5,632 - UndergroundProven- - - - - - - Probable4,187 4.96 10.3 - 668 1,388 - Underground P&P (direct processing)4,187 4.96 10.3 - 668 1,388 - Stockpile materialOpen PitProven6,843 0.38 1.5 - 84 332 - Probable30,541 0.39 2.1 - 378 2,058 - Open Pit P&P (stockpile)37,384 0.38 2.0 - 462 2,390 - Total P&PProven22,681 1.14 1.9 - 830 1,370 - Probable81,594 1.12 3.1 - 2,943 8,040 - Total Rainy River P&P104,275 1.13 2.8 - 3,773 9,410 - Blackwater Direct processing materialProven124,500 0.95 5.5 - 3,790 22,100 - Probable169,700 0.68 4.1 - 3,730 22,300 - P&P (direct processing)294,300 0.79 4.7 - 7,510 44,400 - Stockpile materialProven20,100 0.50 3.6 - 330 2,300 - Probable30,100 0.34 14.6 - 330 14,100 - P&P (stockpile)50,200 0.40 10.2 - 650 16,400 - Total Blackwater P&P344,400 0.74 5.5 - 8,170 60,800 - El Morro30% BasisProven321,814 0.56 - 0.551,746 - 1,163 307,949 0.57 - 0.561,705 - 1,135 Probable277,240 0.35 - 0.43 929 - 788 335,152 0.37 - 0.44 1,186 - 962 Total El Morro P&P599,054 0.46 - 0.492,675 - 1,951 643,101 0.47 - 0.492,891 - 2,097 Total P&P18,538 90,080 2,953 7,752 31,256 3,282 100% Basis30% Basis100% BasisMineral Reserves statement as at December 31, 2013Contained metalMetal gradeMetal gradeContained metalMineral Reserves statement as at December 31, 2012
  • 57.
    57 Reserves andresources summary (cont’d) Appendix 9 1. 2012 information per Annual Information Form dated March 27, 2013. 2. New Afton C-zone updated for July 7, 2014 news release. Tonnes000'sGoldg/tSilverg/tCopper% GoldKozSilverKozCopperMlbsTonnes000'sGoldg/tSilverg/tCopper% GoldKozSilverKozCopperMlbsNew AftonA&B ZonesMeasured41,059 0.79 2.7 1.09 1,041 3,624 984 33,500 0.86 2.9 1.18 929 3,160 873 Indicated26,966 0.44 2.1 0.65 384 1,777 384 45,900 0.67 2.4 0.89 984 3,530 896 A&B Zone M&I68,025 0.65 2.5 0.91 1,425 5,401 1,368 79,400 0.75 2.6 1.01 1,913 6,690 1,769 C-ZoneMeasured931 0.94 1.7 1.06 28 51 22 400 0.60 1.3 0.73 8 20 6 Indicated33,941 0.76 1.9 0.86 832 2,084 646 2,900 0.63 1.3 0.68 58 120 43 C-Zone M&I34,872 0.77 1.9 0.87 860 2,141 668 3,300 0.62 1.3 0.68 66 140 49 HW LensMeasured- - - - - - - - - - - - - - Indicated11,035 0.50 2.2 0.43 179 763 104 - - - - - - - HW Lens M&I11,035 0.50 2.2 0.43 179 763 104 - - - - - - - Total New Afton M&I113,932 0.67 2.3 0.85 2,464 8,305 2,140 82,700 0.74 2.6 1.00 1,979 6,830 1,818 MesquiteMeasured9,070 0.66 - - 191 - - 24,000 0.61 - - 452 - - Indicated304,081 0.48 - - 4,713 - - 370,100 0.45 - - 5,232 - - Total Mesquite M&I313,151 0.49 - - 4,904 - - 394,100 0.45 - - 5,684 - - Peak MinesMeasured3,000 4.69 6.7 1.06 450 650 70 2,700 5.74 7.5 1.05 494 647 62 Indicated3,400 3.29 6.7 1.18 360 730 88 3,200 3.75 6.8 1.19 386 703 84 Peak Mines M&I6,400 3.95 6.7 1.12 810 1,380 158 5,900 4.66 7.1 1.13 880 1,350 146 Cerro San PedroMeasured13,387 0.46 17.3 - 199 7,459 - 42,300 0.40 14.4 - 532 18,900 - Indicated14,311 0.43 18.4 - 198 8,489 - 109,400 0.34 11.5 - 1,171 39,080 - Total CSP M&I27,698 0.45 17.9 - 397 15,948 - 151,700 0.35 11.9 - 1,703 57,980 - Measured and Indicated mineral Resource statement (inclusive of Reserves) as at December 31, 2013Contained metalMetal gradeMeasured and Indicated mineral Resource statement (inclusive of Reserves) as at December 31, 2012Metal gradeContained metal
  • 58.
    58 Reserves andresources summary (cont’d) Appendix 9 1. 2012 information per Annual Information Form dated March 27, 2013. 2. New Afton C-zone updated for July 7, 2014 news release. Tonnes000'sGoldg/tSilverg/tCopper% GoldKozSilverKozCopperMlbsTonnes000'sGoldg/tSilverg/tCopper% GoldKozSilverKozCopperMlbsRainy RiverDirect processing materialOpen PitMeasured20,282 1.45 1.9 - 947 1,261 - Indicated80,411 1.35 2.6 - 3,486 6,584 - Open Pit M&I (direct processing)100,693 1.37 2.4 - 4,433 7,846 - UndergroundMeasured89 4.95 2.8 - 14 8 - Indicated5,469 4.53 11.3 - 796 1,994 - Underground M&I (direct processing)5,558 4.53 11.2 - 810 2,002 - Stockpile materialOpen PitMeasured6,294 0.37 1.3 - 74 262 - Indicated64,816 0.44 2.2 - 919 4,526 - Open Pit M&I (stockpile)71,110 0.43 2.1 - 993 4,788 - Total M&IMeasured26,665 1.21 1.8 - 1,035 1,531 - Indicated150,696 1.07 2.7 - 5,202 13,104 - Total Rainy River M&I177,361 1.09 2.6 - 6,236 14,635 - Blackwater Direct processing materialMeasured116,955 1.04 5.6 - 3,900 21,060 - Indicated189,044 0.78 6.0 - 4,730 36,470 - M&I (direct processing)305,999 0.88 5.8 - 8,620 57,520 - Stockpile materialMeasured26,521 0.30 4.1 - 260 3,500 - Indicated64,382 0.30 4.4 - 620 9,110 - M&I (stockpile)90,904 0.30 4.3 - 870 12,600 - Total Blackwater M&I396,903 0.74 5.5 - 9,500 70,130 - 296,146 0.85 5.9 - 8,070 56,190 - CapooseIndicated20,280 0.50 22.4 - 320 14,620 - 14,200 0.43 20.8 - 196 9,497 - El MorroMeasured341,604 0.56 - 0.541,848 - 1,230 307,949 0.57 - 0.561,705 - 1,135 Indicated349,803 0.35 - 0.42 1,193 - 977 335,152 0.37 - 0.44 1,186 - 962 Total El Morro M&I691,407 0.46 - 0.483,041 - 2,207 643,101 0.47 - 0.492,891 - 2,097 Total M&I27,672 125,018 4,505 21,403 131,847 4,061 Measured and Indicated mineral Resource statement (inclusive of Reserves) as at December 31, 2013Contained metal100% Basis30% BasisMetal gradeMeasured and Indicated mineral Resource statement (inclusive of Reserves) as at December 31, 2012Metal gradeContained metal100% Basis30% Basis
  • 59.
    59 Reserves andresources summary (cont’d) Appendix 9 1. 2012 information per Annual Information Form dated March 27, 2013. 2. New Afton C-zone updated for July 7, 2014 news release. Tonnes000'sGoldg/tSilverg/tCopper% GoldKozSilverKozCopperMlbsTonnes000'sGoldg/tSilverg/tCopper% GoldKozSilverKozCopperMlbsNew AftonA&B-Zone5,607 0.32 1.5 0.38 59 272 46 14,900 0.45 2.0 0.65 216 940 212 C-Zone 7,979 0.50 1.5 0.56 128 387 98 13,600 0.70 1.5 0.76 307 670 228 HW Lens818 0.56 1.3 0.42 15 33 7 - - - - - - - New Afton Inferred14,404 0.50 1.5 0.52 202 692 151 28,400 0.57 1.8 0.70 523 1,610 440 Mesquite17,550 0.42 - - 238 - - 50,900 0.40 - - 651 - - Peak Mines2,000 2.34 4.7 1.17 150 300 51 1,700 2.64 4.8 1.13 144 261 42 CSP1,174 0.34 11.6 - 13 436 - 103,900 0.25 8.8 - 850 29,200 - Rainy RiverDirect processingOpen Pit9,388 0.97 2.3 - 292 687 - Underground2,641 4.46 8.3 - 379 707 - Total Direct Processing12,029 1.74 3.6 - 671 1,394 - StockpileOpen Pit8,626 0.37 1.2 - 102 323 - Rainy River Inferred20,655 1.16 2.6 - 773 1,717 - BlackwaterDirect processing13,815 0.76 4.1 - 340 1,820 - Stockpile3,785 0.31 3.6 - 40 440 - Blackwater Inferred17,600 0.66 4.0 - 380 2,260 - 16,585 0.58 10.8 - 310 5,760 - Capoose29,263 0.39 26.3 - 370 24,740 - 64,070 0.29 23.2 - 595 47,789 - El Morro - Open Pit564,217 0.16 - 0.26871 - 970 137,555 0.99 - 0.701,310 - 632 El Morro - Underground113,840 0.97 - 0.781,065 - 587 Total Inferred4,062 30,145 1,759 4,383 84,620 1,114 100% Basis30% Basis30% Basis100% BasisInferred Resource statement as at December 31, 2013Contained metalMetal gradeInferred Resource statement as at December 31, 2012Metal gradeContained metal
  • 60.
    60 New Goldreports its Measured and Indicated mineral resources inclusive of its mineral reserves. Measured and Indicated mineral resources that are not mineral reserves do not have demonstrated economic viability. Inferred mineral resources have a greater amount of uncertainty as to their existence and economic and legal feasibility, do not have demonstrated economic viability, and are exclusive of mineral reserves. Mineral reserves have been estimated in accordance with the Canadian Instituteof Mining, Metallurgy and Petroleum (“CIM”) definition standards and National Instrument 43-101 (“NI 43-101”). 1) Mineral Reserves for the company’s mineral properties have been estimated based on the following metal prices and lower cut-off criteria: Mineral Property Gold (US$/oz) Silver (US$/oz) Copper (US$/lb) Lower Cut-off New Afton $1,300 $22.00 $3.00 US$21.00/t NSR Mesquite $1,300 - - 0.21 g/t Au –Oxide and transition reserves 0.41 g/tAu –Non-oxide reserves Peak Mines $1,300 $22.00 $3.00 A$88 –134/t NSR Cerro San Pedro $1,300 $22.00 - US$3.00/t Rainy River $800 $1,300 $25.00 $22.00 - Open Pit:0.3 –0.7 g/t Au Underground: 3.5 g/t Au Blackwater $1,300 $22.00 - Direct processing:0.26 –0.38 g/t AuEq Stockpile:0.32 g/t AuEq El Morro $1,300 - $3.00 0.20% Cu Reserves and resources notes Appendix 9
  • 61.
    61 2) MineralResources for the company’s mineral properties have been estimated based on the following metal prices and lower cut-off criteria: 3) Mineral resources are classified as Measured, Indicated and Inferred resources and are reported based on technical and economic parameters consistent with the methods most suitable for their potential commercial exploitation. Where different mining and/or processing methods might be applied to different portions of a mineral resource, the designators ‘open pit’ and ‘underground’ have been applied to indicate envisioned mining method. Likewise the designators ‘oxide’, ‘non-oxide’ and ‘sulphide’ have been applied to indicate the type of mineralization as it relates to appropriate mineral processing method and expected payable metal recoveries. Additional details regarding mineral resource estimation, classification, reporting parameters, key assumptions and associated risks for each of New Gold’s mineral properties, other than Rainy River, are provided in the respective NI 43-101 Technical Reports which are available at www.sedar.com. Refer to the supplementary information below regarding the mineral reserve and mineral resource estimates for Rainy River. Mineral Property Gold (US$/oz) Silver (US$/oz) Copper (US$/lb) Lower Cut-off New Afton $1,400 $24.00 $3.25 0.40% CuEq Mesquite $1,400 - - 0.11g/t Au –Oxide and transition resources 0.22 g/t Au –Non-oxide resources Peak Mines $1,400 $24.00 $3.25 A$92 -125/t NSR Cerro San Pedro $1,400 $24.00 - 0.10 g/t AuEq –Open pit oxideresources 0.30 g/t AuEq –Open pit sulphideresources Rainy River $1,400 $24.00 - OpenPit: 0.3 –0.45g/t Au Underground: 2.5 g/t Au Blackwater $1,400 $24.00 - Direct processing:0.40 g/t AuEq Stockpile: 0.30 –0.40 g/t AuEq Capoose $1,400 $24.00 - 0.40 g/t AuEq El Morro $1,300 - $3.00 0.20% Cu Reserves and resources notes (cont’d) Appendix 9
  • 62.
    62 Rainy RiverMineral Reserves: 1. Open pit mineral reserves have been estimated using an optimized pit shell based on metal prices of $800 per ounce gold and $25 per ounce silver, a foreign exchange rate of C$1.05 to US$1.00, gold recovery of 89.9% (non-CAP Zone) and 74.3% (CAP Zone) and a silver recovery of 67.1% (non-CAP Zone) and 69.5% (CAPZone). The cut-off grade is based on a gold price of $1,200. Underground reserves have been estimated from mining shapes generated using a cut-off grade of 3.5 g/t gold-equivalent. Development material from stopeaccess drives above a cut-off grade of 1.5 g/t gold-equivalent is also assumed to be sent to the mill for processing. Underground breakeven cut-off grade is calculated at 2.75 g/t gold-equivalent based on metal prices of $1,300 per ounce gold and $22 per ounce silver, a foreign exchange rate of CAD $1.05 to USD $1.00, gold recoveryof 95% and a silver recovery of 75%. 2. Open pit reserves have been estimated using a dilution of 4% at 0.21 g/t Au and 1.19 g/t Ag, and underground reserves havebeen estimated using an overall dilution of 8.3%, inclusive of both rock and backfill dilution. Open pit and underground reserves have been estimated using a mining recovery of 95% and 96.5%,respectively. 3. Open pit direct processing material is defined as mineralization likely to be mined and processed directly and above a variable cut-off grade ranging from 0.3-0.7 Au g/t. 4. Stockpile material includes all material within designed open pit between variable cut-offs described above in Note 3, as well as material within the CAP Zone (code 500) that is suitable for stockpiling and future processing. 5. Mineral Reserves for the open pit are derived from the resource model effective November 2, 2013. Models for the underground reserves were derived from the August 2013 and September 2013 models for the main ODM zone and Intrepid Zone, respectively. Models were prepared by DorotaEl-Rassi, P.Eng. (APEO #100012348) and Glen Cole, P.Geo. (APGO #1416), of SRK, both independent “Qualified Persons" as that term is defined in National Instrument 43-101. Rainy River’s exploration program in Richardson Township is being supervised by Mark A. Petersen, (AIPG Certified Professional Geologist #10563), Vice President, Exploration for New Gold and a “Qualified Person” as defined in National Instrument 43-101. New Gold continues to implement a rigorous QA/QC program to ensure best practices in drill core sampling, analysis and data management. 6. Qualified persons -The open pit portion of the mineral reserve statement was prepared under the supervision of Patrice Live (OIQ #38991) of BBA, and the underground portion of the mineral reserve statement was prepared by ColmKeogh, P.Eng. (APEGBC #37433) of AMC Mining Consultants (Canada) Ltd., both independent “Qualified Persons" as that term is defined in National Instrument 43-101. 7. The mineral reserve estimate may be materially affected by environmental, permitting, legal, title, taxation, sociopolitical,marketing, and other relevant issues. Rainy River Mineral Resources: 1. Mineral resources are reported in relation to conceptual pit shells and are inclusive of the Intrepid zone. Vertical limitof-150m msl. 2. Open pit mineral resources are reported at a cut-off grade of 0.30 gptgold, underground mineral resources are reported at a cut-off grade of 2.5 gptgold based on a gold price of $1,400 per ounce, a silver price of $24.00 per ounce, a foreign exchange rate of C$1.10 to US$1.00, gold recovery of 88% for open pit resources and 90% for underground resources with silver recovery at 75%. 3. Direct processing material is defined as mineralization above a cut-off of 0.45 g/t gold and likely to be mined and processeddirectly. 4. Stockpile material includes all material within conceptual pit shells in the gold grade range 0.30 –0.45 gptas well as all material within the CAP zone that is suitable for stockpiling and future processing based on average metallurgical recoveries of 88% gold and 75% silver. 5. Qualified Persons –The mineral resource statement was prepared by DorotaEl-Rassi, P. Eng. (APEO #100012348) and Glen Cole (APGO #1416) from SRK, both independent "Qualified Persons" as that term is defined in National Instrument 43-101. 6. Mineral resources are inclusive of mineral reserves. Mineral resources that are not mineral reserves do not have demonstrated economic viability. 7. The mineral resource estimate may be materially affected by environmental, permitting, legal, title, taxation, sociopolitical, marketing and other relevant issues. 4) Qualified Person: The preparation of New Gold's mineral reserve and mineral resource statements has been done by QualifiedPersons as defined under National Instrument 43-101 under the supervision of Mark A. Petersen, a Qualified Person under National Instrument 43-101 and an officer of New Gold. Reserves and resources notes (cont’d) Appendix 9
  • 63.
    63 Guidance assumptions Spot: 2014 Gold price ($/oz) 1,300 Silver price ($/oz) 20.00 Copper price ($/oz) 3.25 AUD/USD 1.14 CDN/USD 1.11 MXN/USD 13.00 Spot Gold price ($/oz) 1,255 Silver price ($/oz) 19.05 Copper price ($/oz) 3.10 AUD/USD 1.09 CDN/USD 1.10 MXN/USD 13.20 Commodity price/foreign exchange assumptions Appendix 10
  • 64.
    Endnotes 64 CAUTIONARYNOTE TO U.S. READERS CONCERNING ESTIMATES OF MINERAL RESERVES AND MINERAL RESOURCES Information concerning the properties and operations of New Gold has been prepared in accordance with Canadian standards under applicable Canadian securities laws, and may not be comparable to similar information for United States companies. The terms “Mineral Resource”, “Measured Mineral Resource”, “Indicated Mineral Resource” and “Inferred Mineral Resource” used in this Report are Canadian mining terms as defined in the Canadian Institute of Mining, Metallurgy and Petroleum (“CIM”) Definition Standards for Mineral Resources and Mineral Reserves adopted by CIM Council on November 27, 2010 and incorporated by reference in National Instrument 43-101 (“NI 43-101”). While the terms “Mineral Resource”, “Measured Mineral Resource”, “Indicated Mineral Resource” and “Inferred Mineral Resource” are recognized and required by Canadian securities regulations, they are not defined terms under standards of the United States Securities and Exchange Commission. As such, certain information contained in this Report concerning descriptionsof mineralization and resources under Canadian standards is not comparable to similar information made public by United States companies subject to the reporting and disclosure requirements of the United States Securities and Exchange Commission. An “Inferred Mineral Resource” has a great amount of uncertainty as to its existence and as to its economic and legal feasibility. Under Canadian rules, estimates of Inferred Mineral Resources may not form the basis of feasibility or pre-feasibility studies. It cannot be assumed that all or any part of an “Inferred Mineral Resource” will ever be upgraded to a higher confidence category. Readers are cautioned not to assume that all or any part of an “Inferred Mineral Resource” exists or is economically or legally mineable. Under United States standards, mineralization may not be classified as a “Reserve” unless the determination has been made that the mineralization could be economically and legally produced or extracted at the time the Reserve estimation is made. Readers are cautioned not to assume that all or any part of the Measured or Indicated Mineral Resources that are not Mineral Reserves will ever be converted into Mineral Reserves. In addition, the definitions of “Proven Mineral Reserves” and “Probable Mineral Reserves” under CIM standards differ in certain respects from the standards of the United States Securities and Exchange Commission. TECHNICAL INFORMATION The scientific and technical information in this presentation has been reviewed and approved by Mark A. Petersen, Vice President, Exploration of New Gold. Mr. Petersen is an AIPG Certified Professional Geologist and a “qualified person” under National Instrument 43-101. For additional information with respect to ourMineral Resource and Reserve estimates and the Feasibility Studies discussed herein, refer to our news release dated February 6, 2014, the Rainy River Technical Report, the Blackwater Technical Report and our other technical reports available at www.sedar.com.
  • 65.
    Endnotes (cont’d) 65 NON-GAAP MEASURES (1) ALL-IN SUSTAINING COSTS Consistent with guidance announced in 2013 by the World Gold Council, an association of various gold mining companies from around the world of which New Gold is a member, New Gold defines “all-in sustaining costs” per ounce as the sum of total cash costs, capital expenditures that are sustaining in nature, corporate general and administrative costs, capitalized and expensed exploration that is sustaining in nature and environmental reclamation costs, all divided by the ounces of gold soldtoarrive at a per ounce figure. New Gold believes this non-GAAP financial measure provides further transparency into costs associated with producing gold and will assist analysts, investorsand other stakeholders of the company in assessing the company’s operating performance, its ability to generate free cash flow from current operations and its overall value. This data is furnished to provide additional information and is a non-GAAP financial measure. All-in sustaining costs presented do not have a standardized meaning under GAAP and may not be comparable to similar measures presented by other mining companies. It should not be considered in isolation or as a substitute for measures of performance prepared in accordance with GAAP and is not necessarily indicative of cash flow from operations under GAAP or operating costs presented under GAAP. Further details regarding all-in sustaining costs and a reconciliation to the nearest GAAPmeasures are provided in our MD&As accompanying our financial statements filed from time to time on www.sedar.com. (2) TOTAL CASH COSTS “Total cash costs” per ounce figures are non-GAAP measures which are calculated in accordance with a standard developed by The Gold Institute, a worldwide association of suppliers of gold and gold products that ceased operations in 2002. Adoption of the standard is voluntary and the cost measures presented may not be comparable to other similarly titled measures of other companies. New Gold reports total cash costs on a sales basis. The company believes that certain investors use this information to evaluate the company’s ability to generate liquidity through operating cash flow and that this measure, along with sales, is considered to be a key indicator of the company’s ability to generate operating earnings and cash flow from its mining operations. Total cash costs include mine site operating costs such as mining, processing and administration costs, royalties, production taxes, and realized gains and losses on fuel contracts, but are exclusive of amortization, reclamation, capital and exploration costs and net of by-product sales. Total cash costs are then divided by ounces of gold sold to arrive at a per ounce figure. Co-product cash costs remove the impact of other metal sales that are produced as a by-product of gold production and apportion the cash costs to each metal produced on a percentage of revenue basis, and subsequently divides the amount by the total ounces of gold or silver or pounds of copper sold,as the case may be, to arrive at per ounce or per pound figures. Unless otherwise indicated, all total cash cost information in this presentation is net of by-product sales. These measures, along with sales, are considered to be a key indicator of a company’s ability to generate operating earnings and cash flow from its mining operations. This data is furnished to provide additional information and is a non-GAAP financial measure. Total cash costs and co-product cash costs presented do not have a standardized meaning under GAAP and may not be comparable to similar measures presented by other mining companies. It should not be considered in isolation or as a substitute for measures of performance prepared in accordance with GAAP and is notnecessarily indicative of cash flow from operations under GAAP or operating costs presented under GAAP. Further details regarding total cash costs and a reconciliation to the nearest GAAP measures are provided in our MD&As accompanying our financial statements filed from time to time on www.sedar.com. (3) ADJUSTED NET EARNINGS “Adjusted net earnings” and “adjusted net earnings per share” are non-GAAP financial measures. Net earnings have been adjusted and tax affected for the group of costs in “Other gains and losses” on the condensed consolidated income statement. The adjusted entries are also impacted for tax to the extent that theunderlying entries are impacted for tax in the unadjusted net earnings from continuing operations. The company uses this measure for its own internal purposes. Management’s internal budgets and forecasts and public guidance do not reflect fair value changes on senior notes and non-hedged derivatives, foreign currency translation and fair value through profit or loss and financial asset gains/losses. Consequently, the presentation of adjusted net earnings and adjusted net earnings per share enables investors and analysts to better understand the underlying operating performance of our core mining business through the eyes of management. Management periodically evaluates the components of adjusted net earnings and adjusted net earnings per share based on an internal assessment of performance measures that are useful for evaluating the operating performance of our business and a review of the non-GAAP measures used by mining industry analysts and other mining companies. Adjusted net earnings and adjusted net earnings per share are intended to provide additional information only and do not haveany standardized definition under IFRS and may not be comparable to similar measures presented by other companies. They should not be considered in isolation or as a substitute for measures of performance prepared in accordance with IFRS. The measures are not necessarily indicative of operating profit or cash flows from operations as determined under IFRS.
  • 66.
    Endnotes (cont’d) 66 (4) OPERATING MARGIN “Operating margin” is a non-GAAP financial measure with no standard meaning under GAAP, which management uses to further evaluate the company’s results of operations in each reporting period. Operating margin is calculated as revenue less operating expenses and therefore does not include depreciation and depletion. Operating margin is intended to provide additional information only and does not have any standardized definition under IFRS; it should not be considered in isolation or as a substitute for measures of performance prepared in accordance with IFRS. Other companies may calculate this measure differently and this measure is unlikely to be comparable tosimilar measures presented by other companies. (5) ADJUSTED NET CASH GENERATED FROM OPERATIONS “Adjusted net cash generated from operations” is a non-GAAP financial measure. Net cash generated from operations has been adjusted for a one-time charge incurred in the second quarter of 2013 related to the settlement of the company’s legacy gold hedge position. The company believes the presentation of adjustednet cash generated from operations enables investors and analysts to better understand the underlying operating performance of our core mining business. Adjusted net cash generated fromoperations is intended to provide additional information only and does not have any standardized meaning under IFRS. It should not be considered in isolation or as a substitute for measures of performance prepared in accordance with IFRS.
  • 67.
    Contact information 67 Investor Relations Hannes Portmann Vice President, CorporateDevelopment 416-324-6014 hannes.portmann@newgold.com