This document discusses various topics related to computing cooling loads and energy performance ratings for building architectures, including:
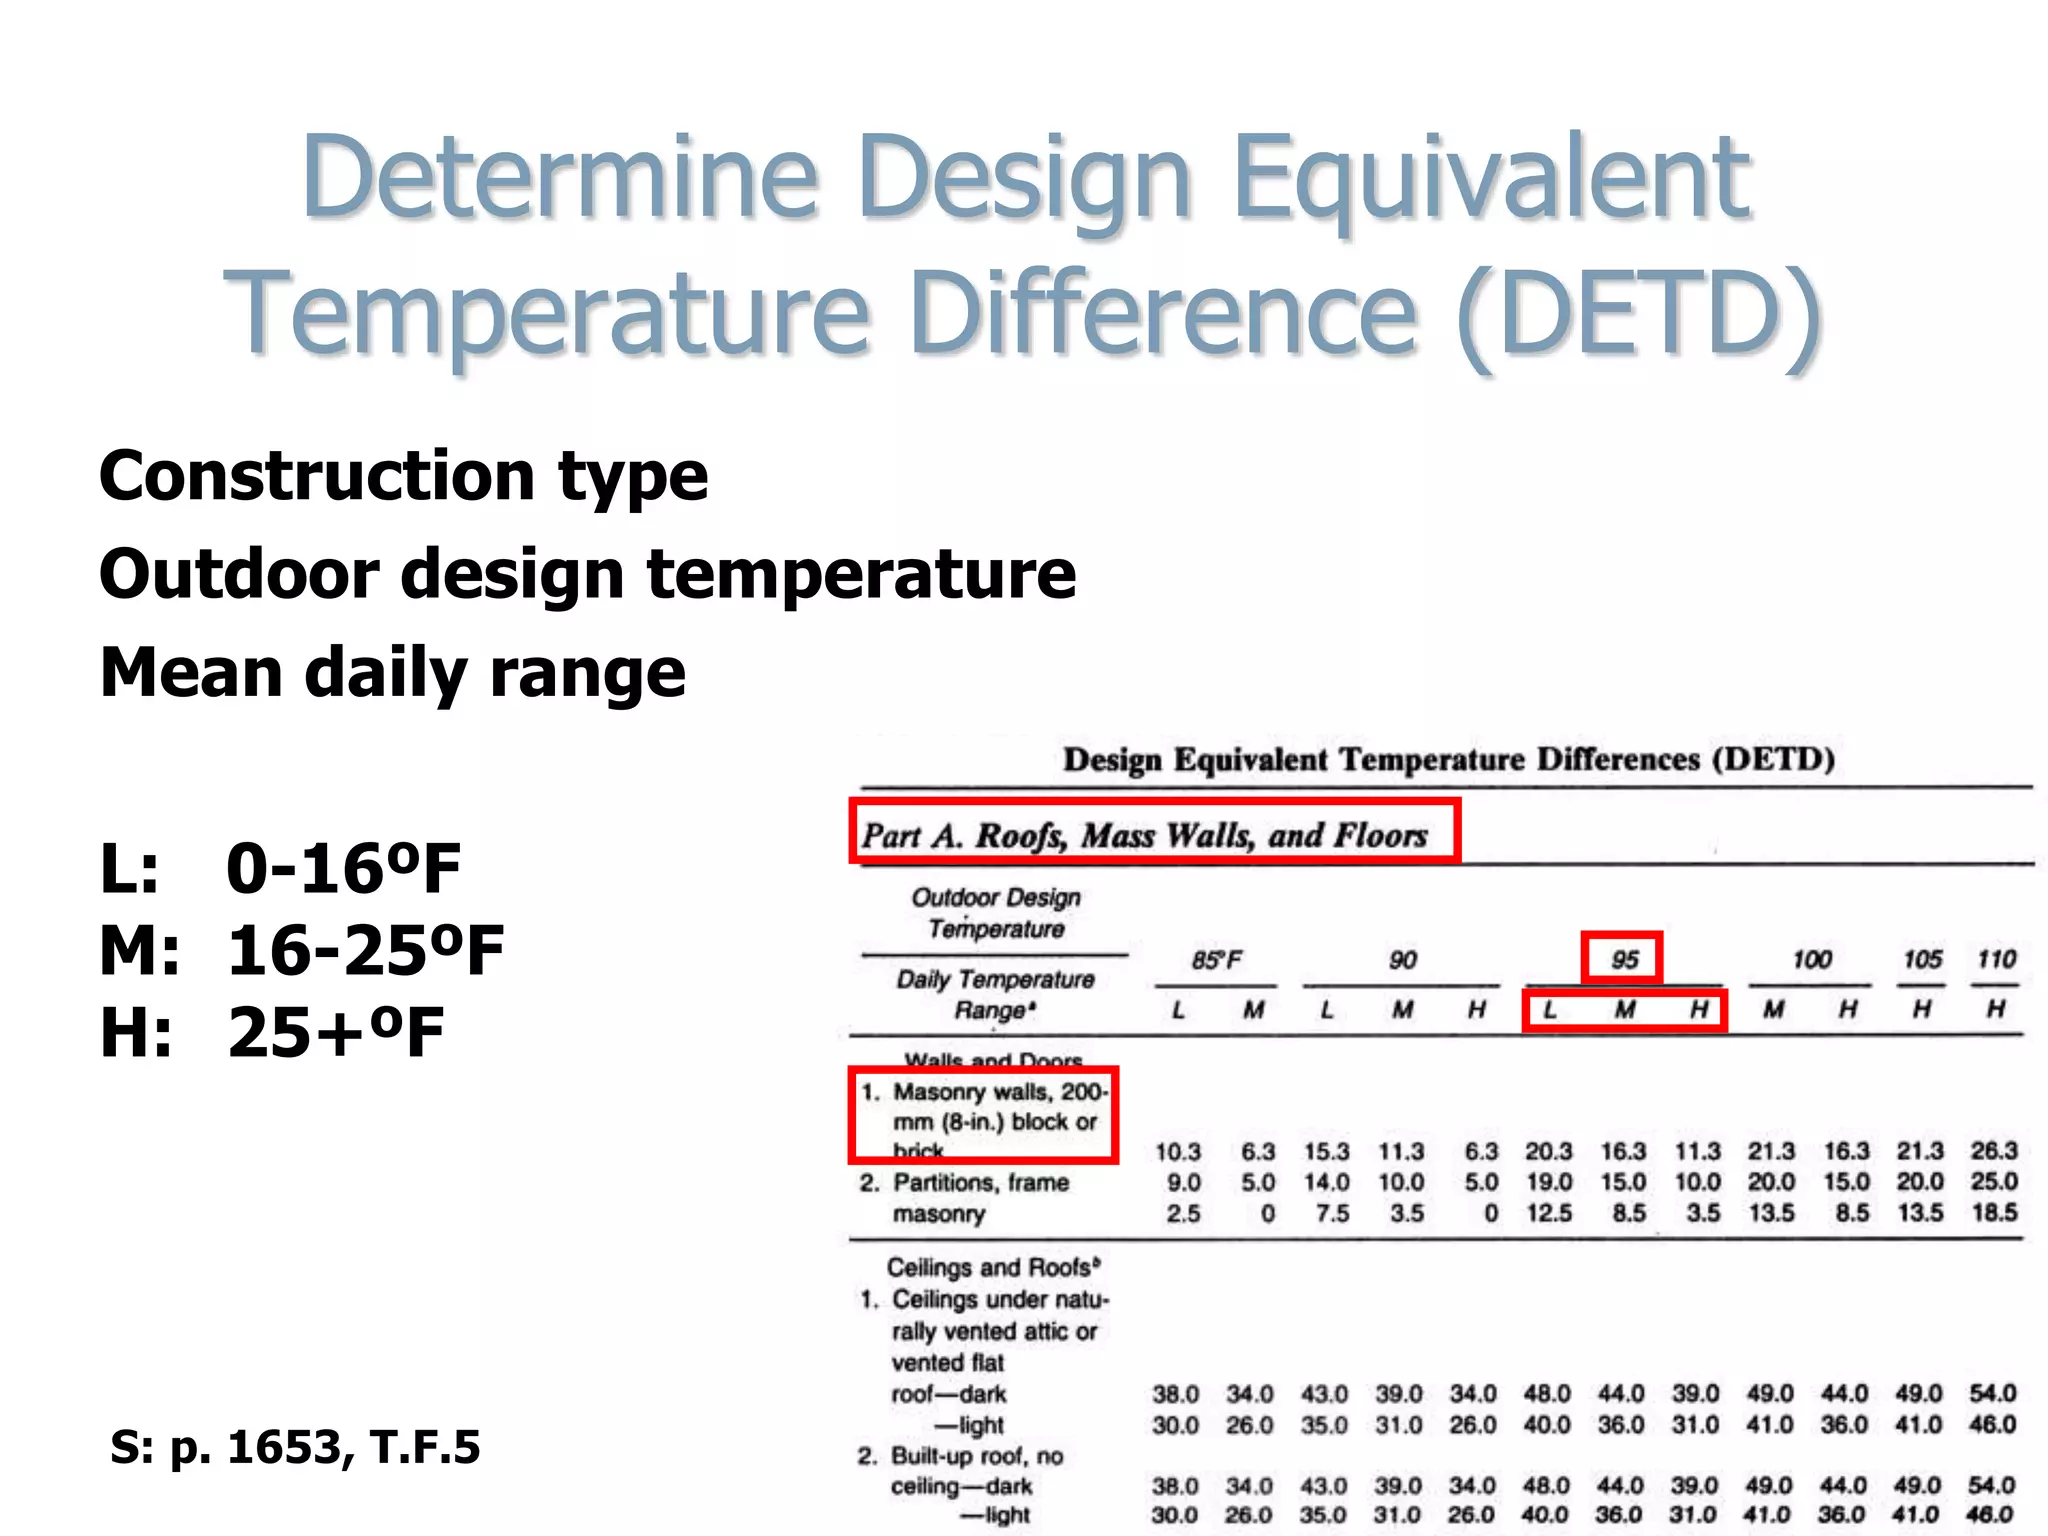
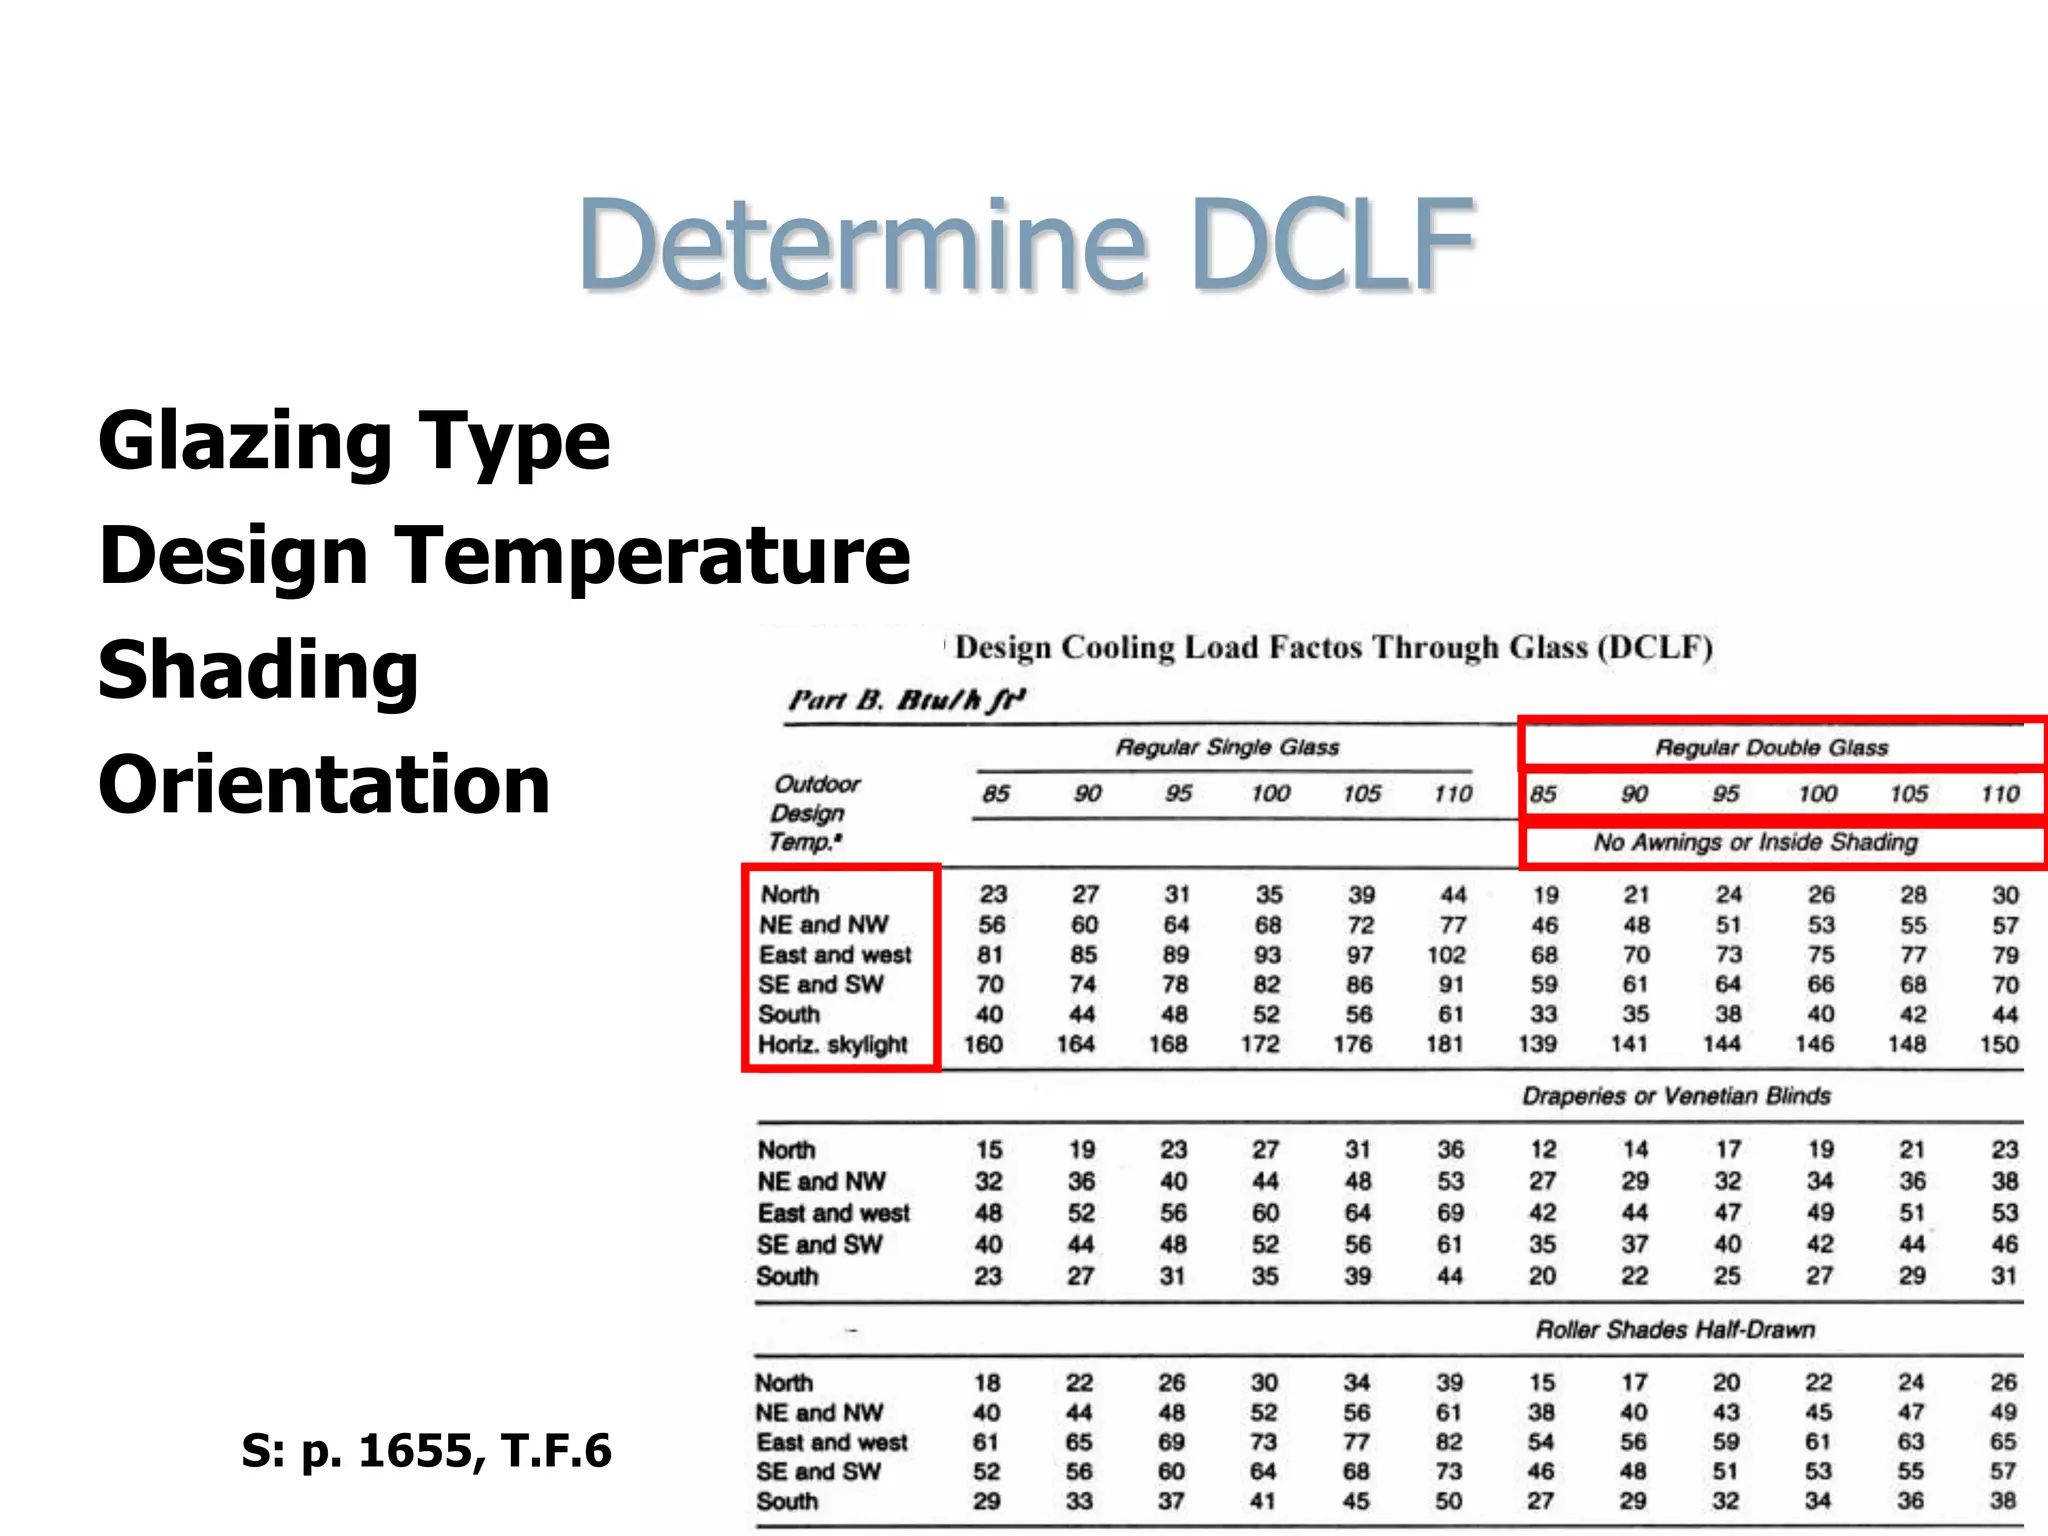
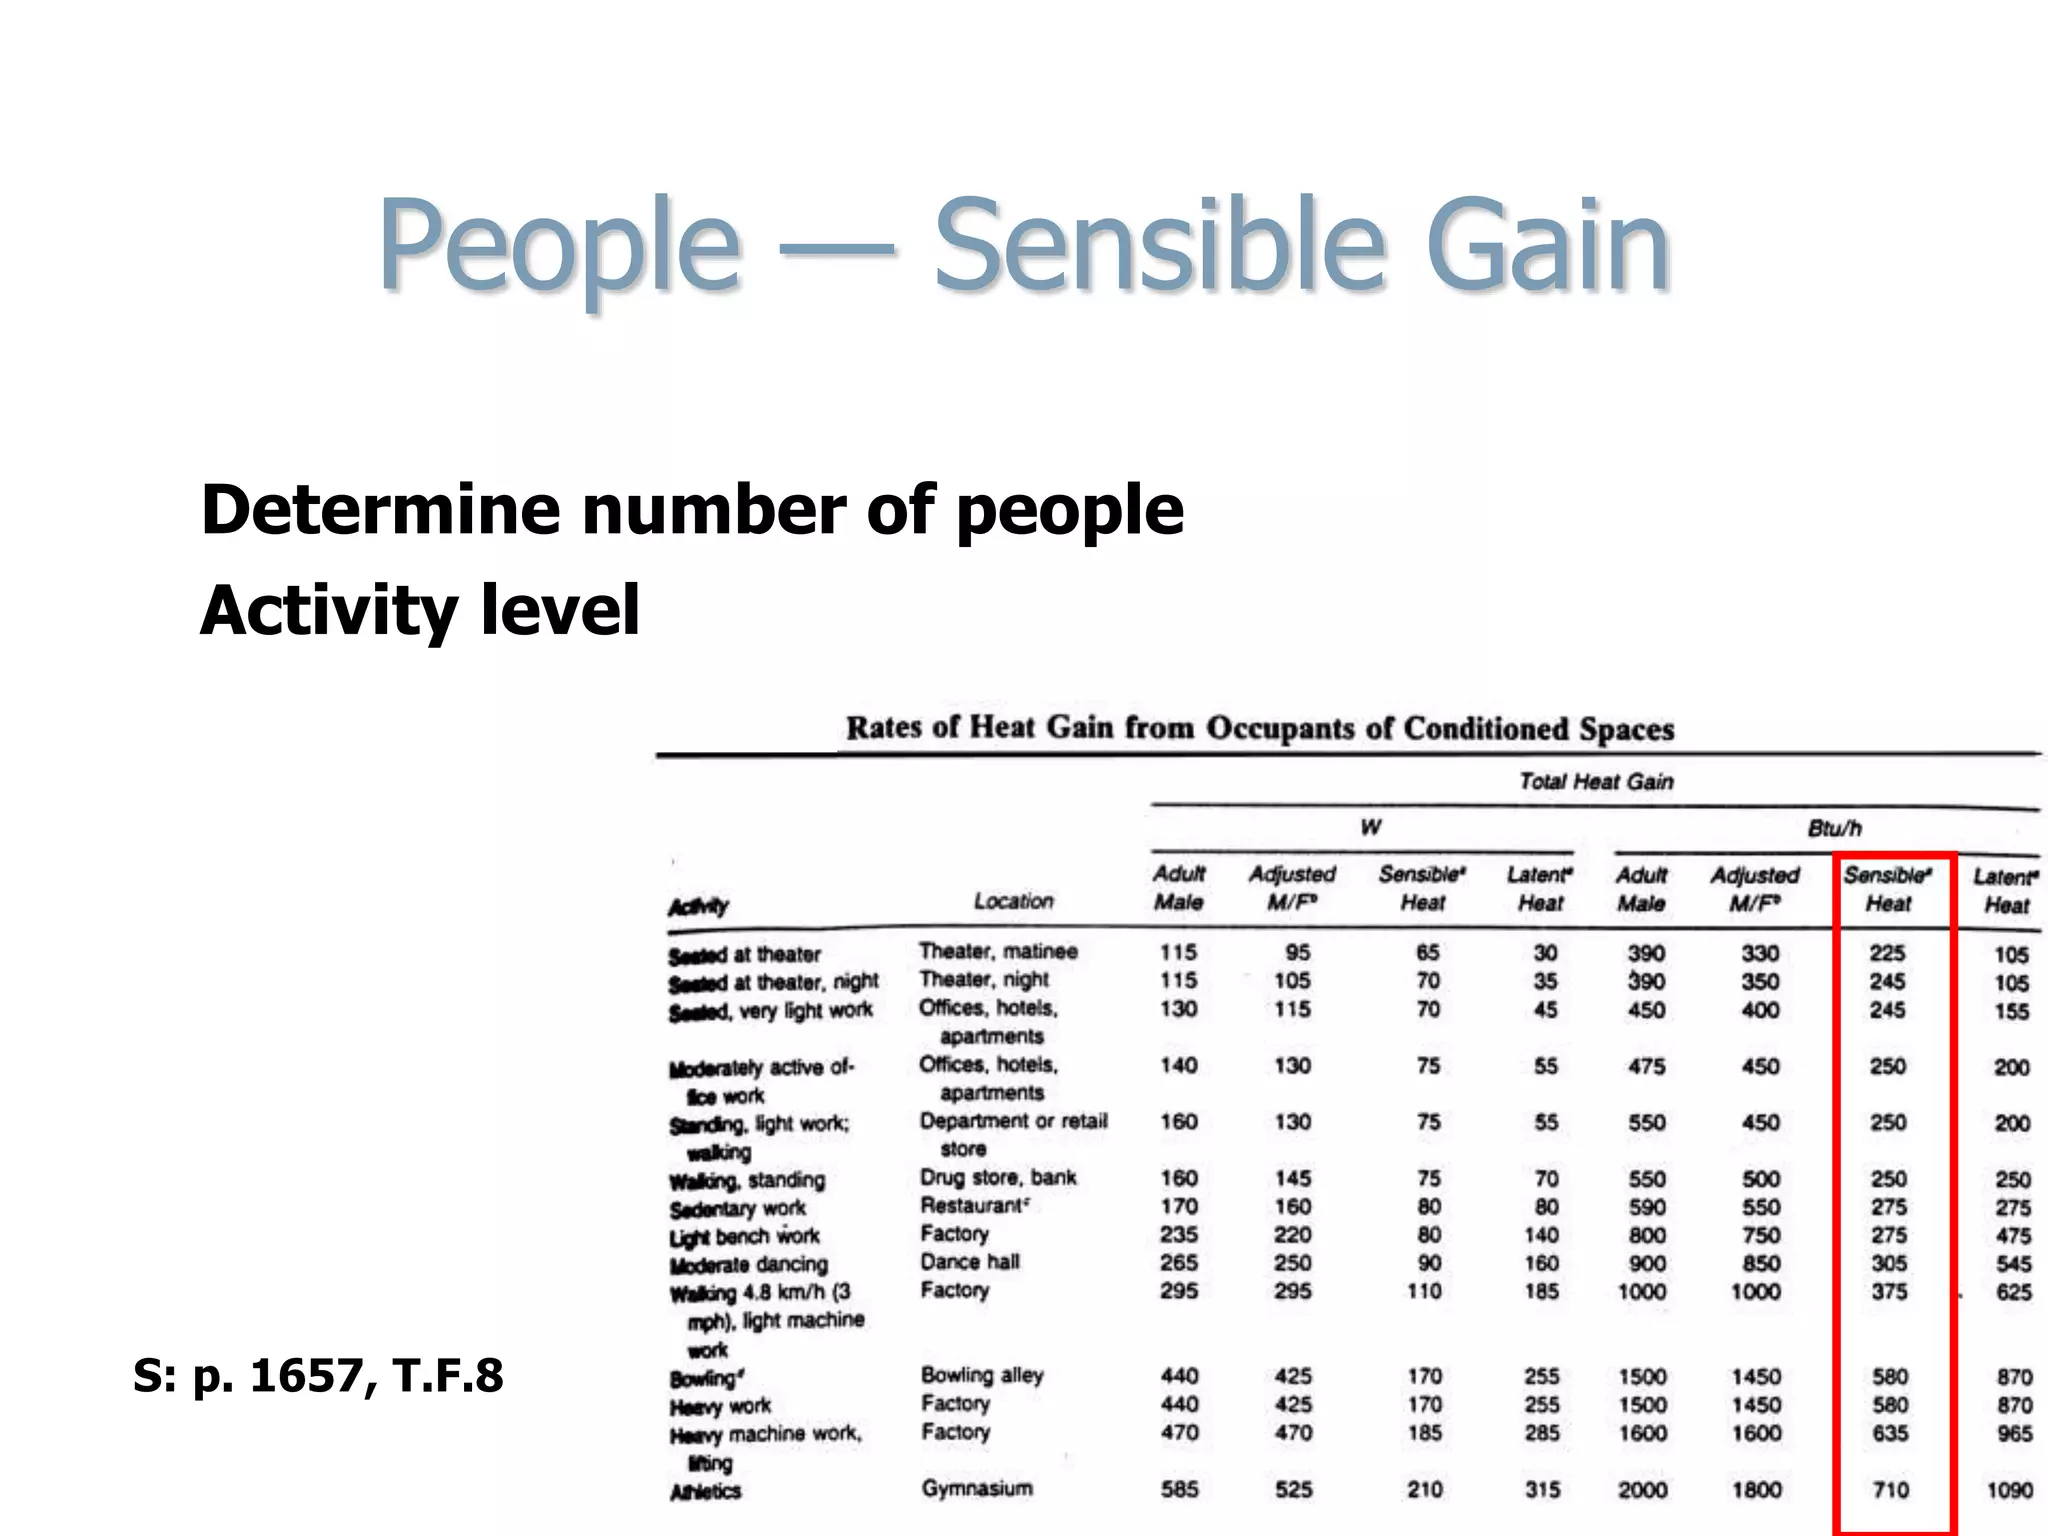
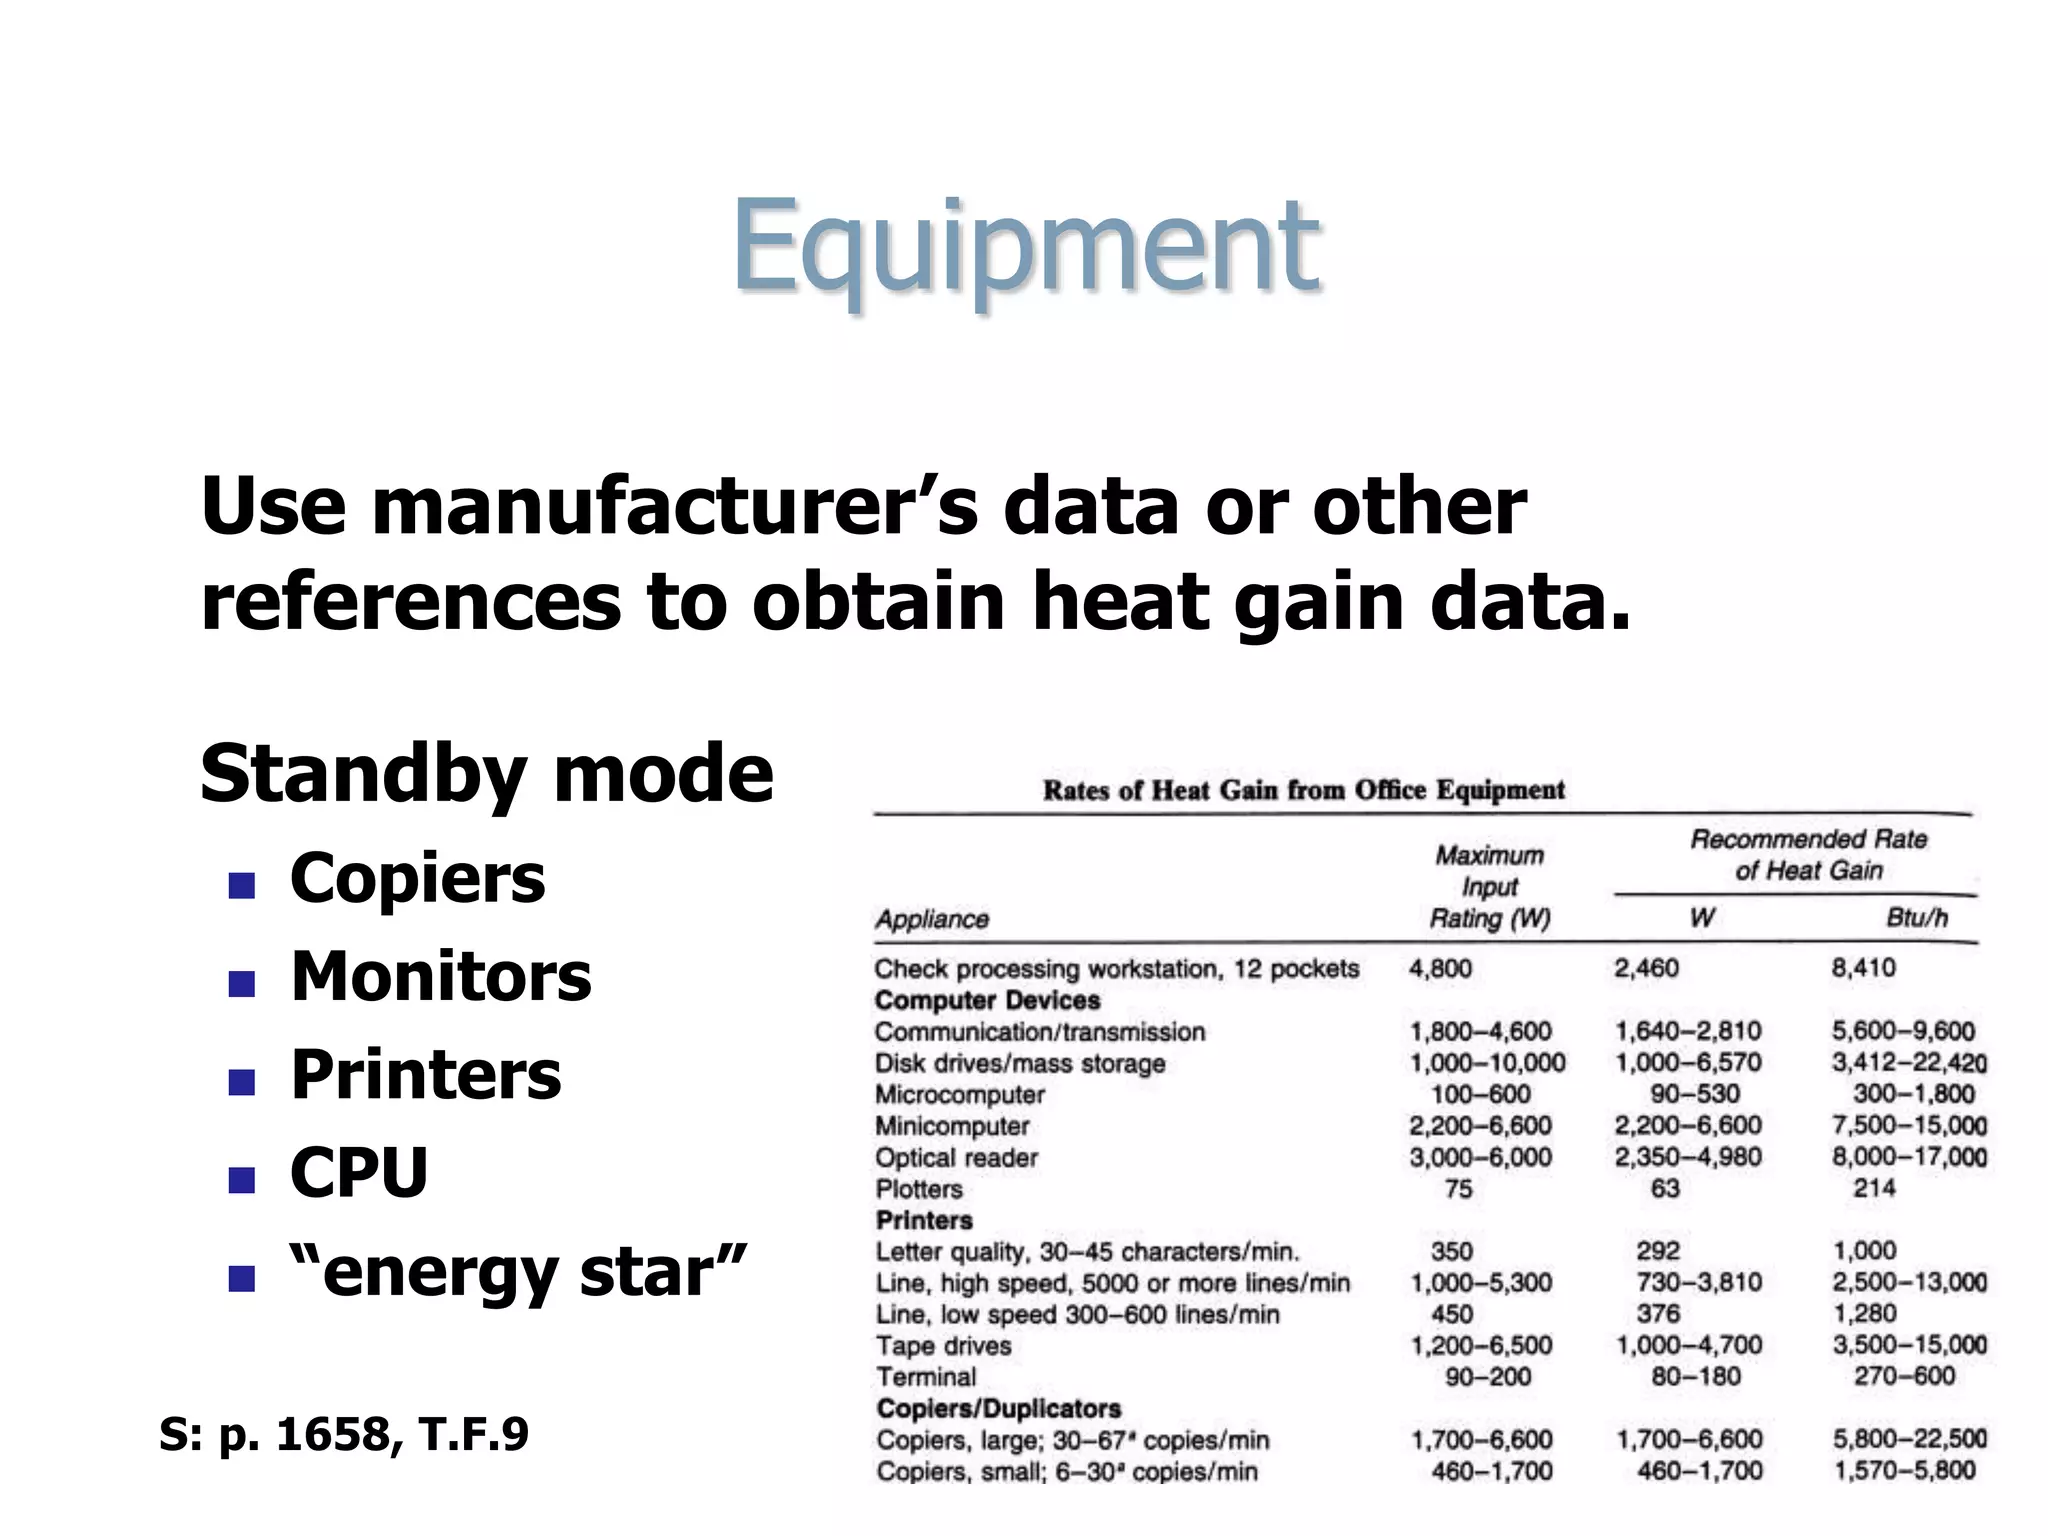
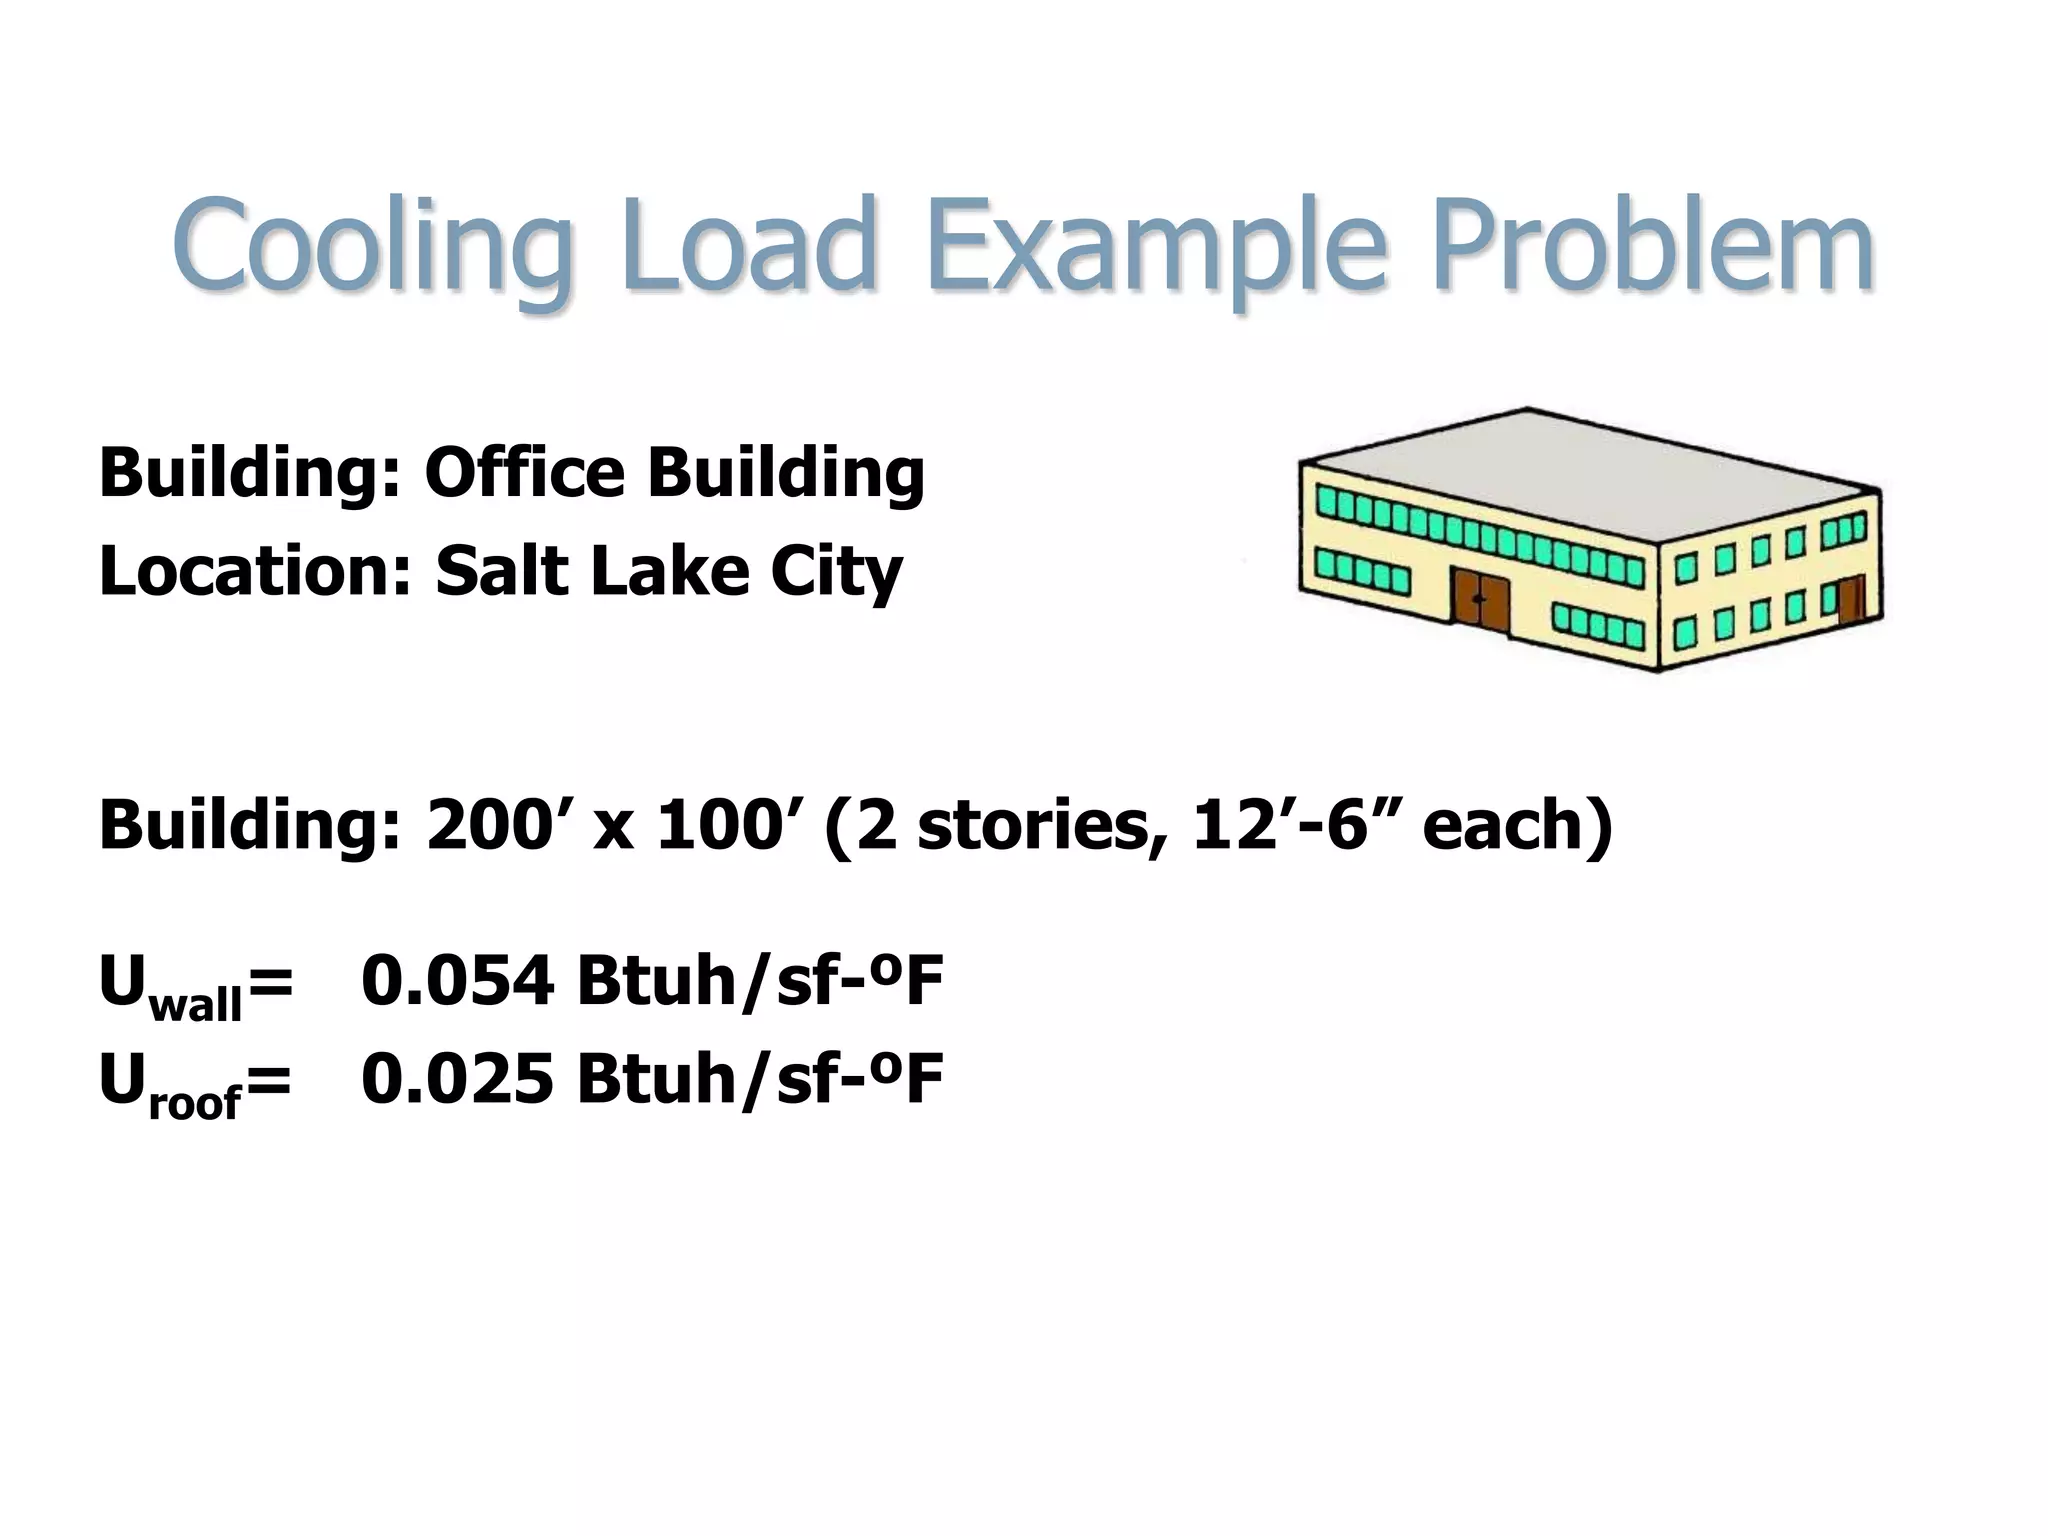
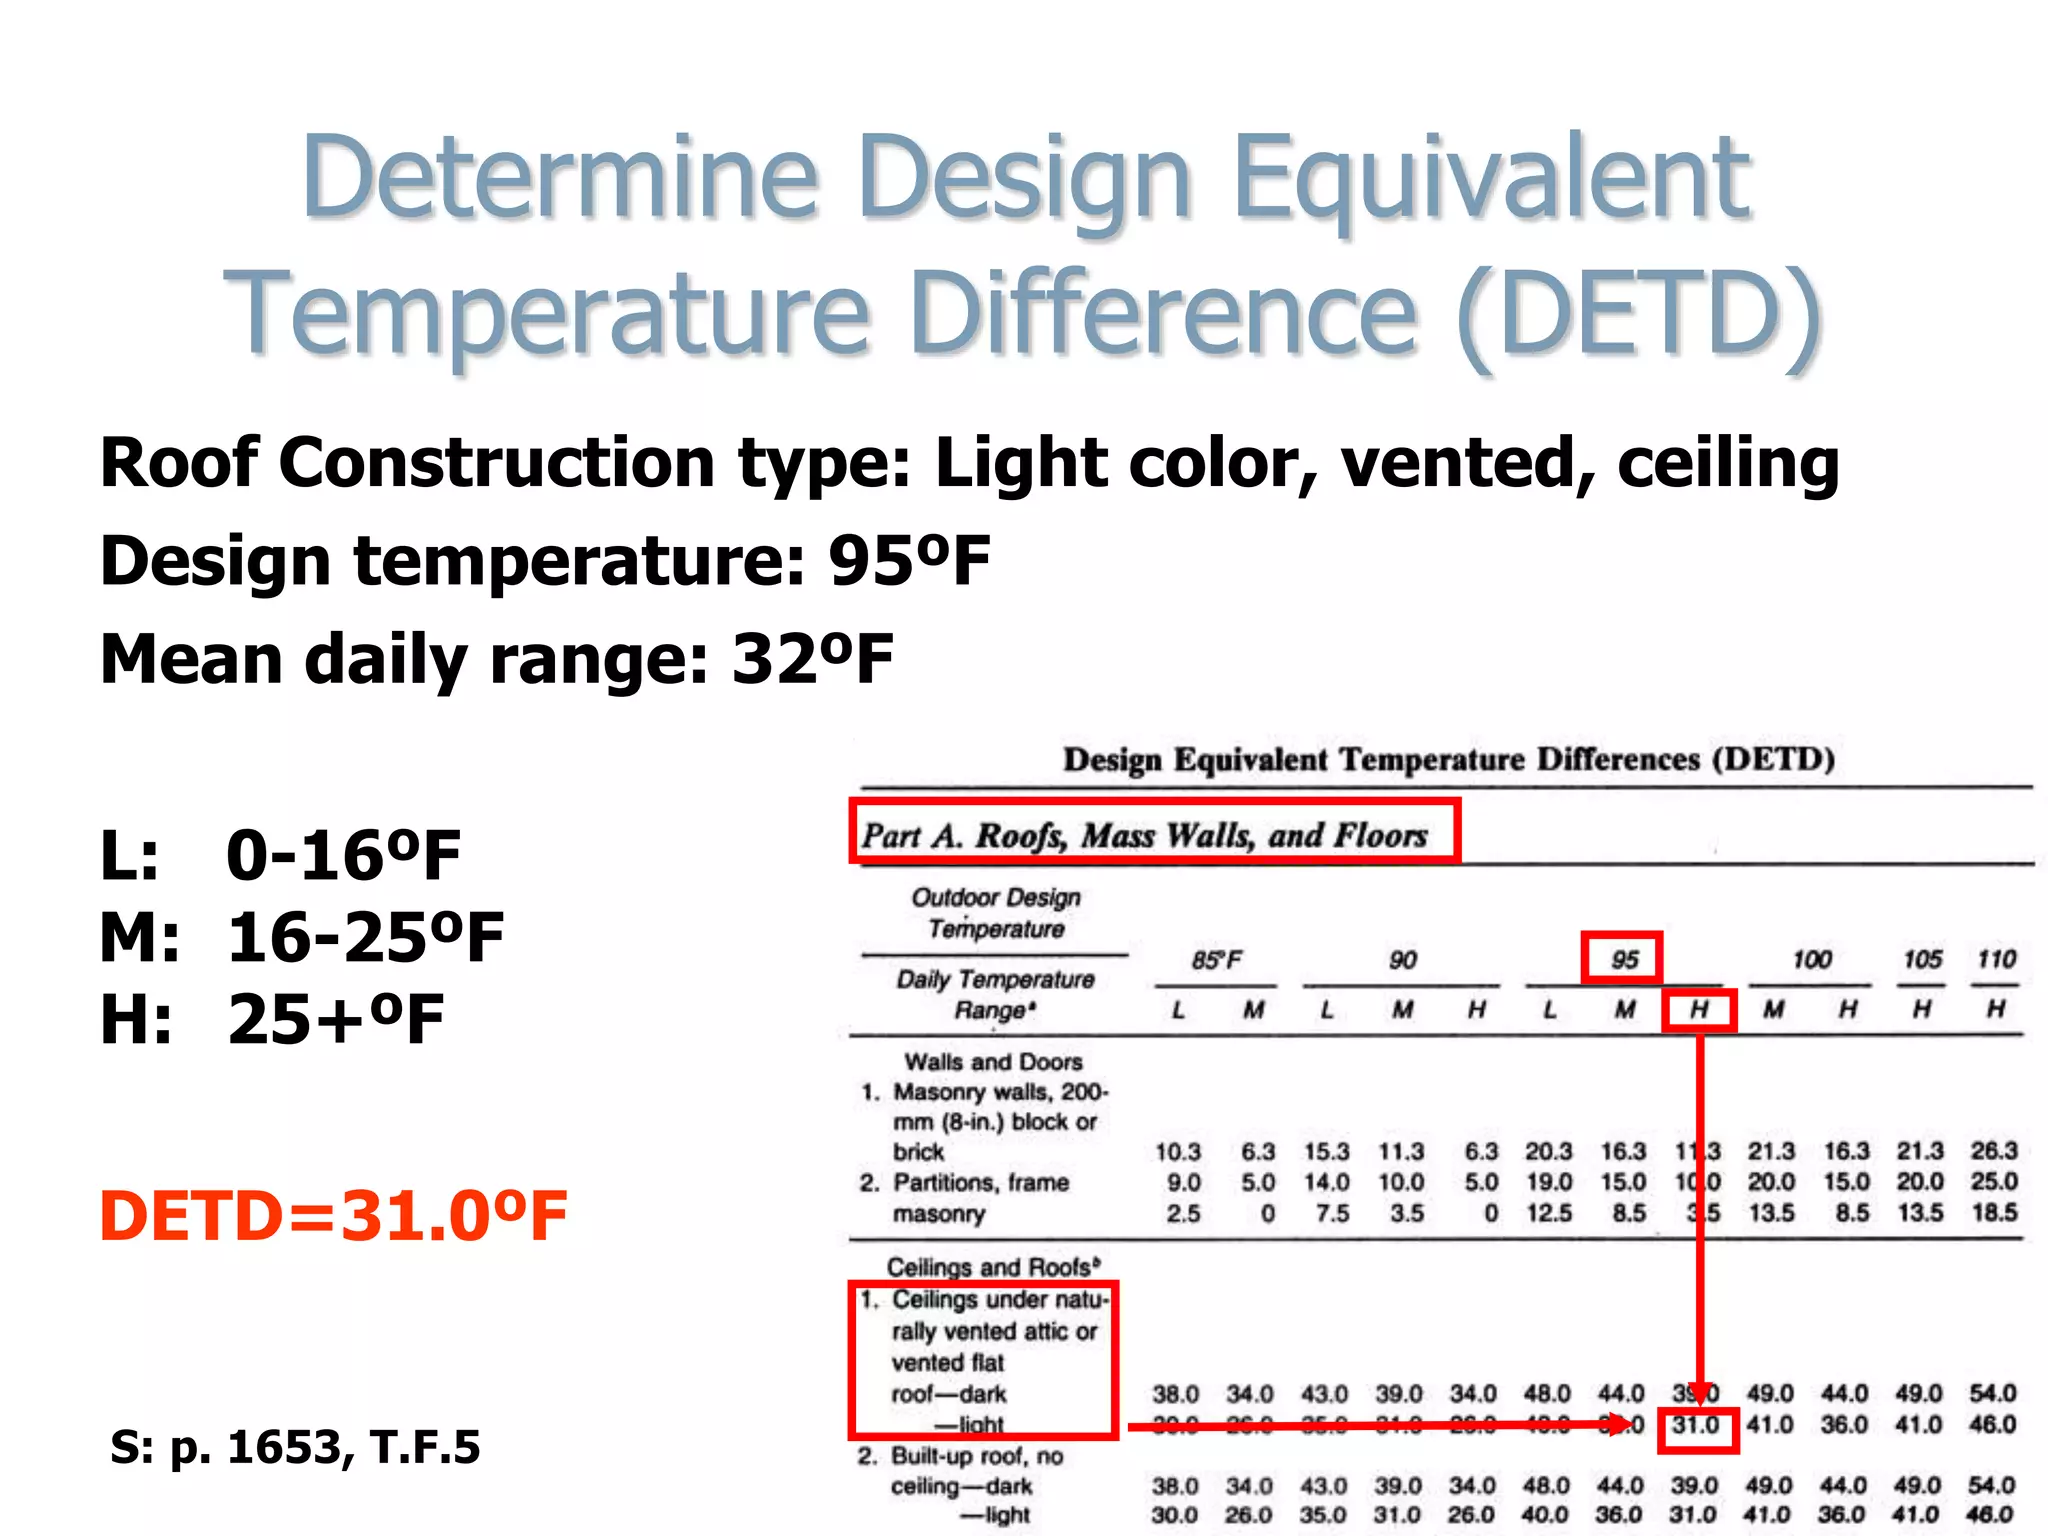
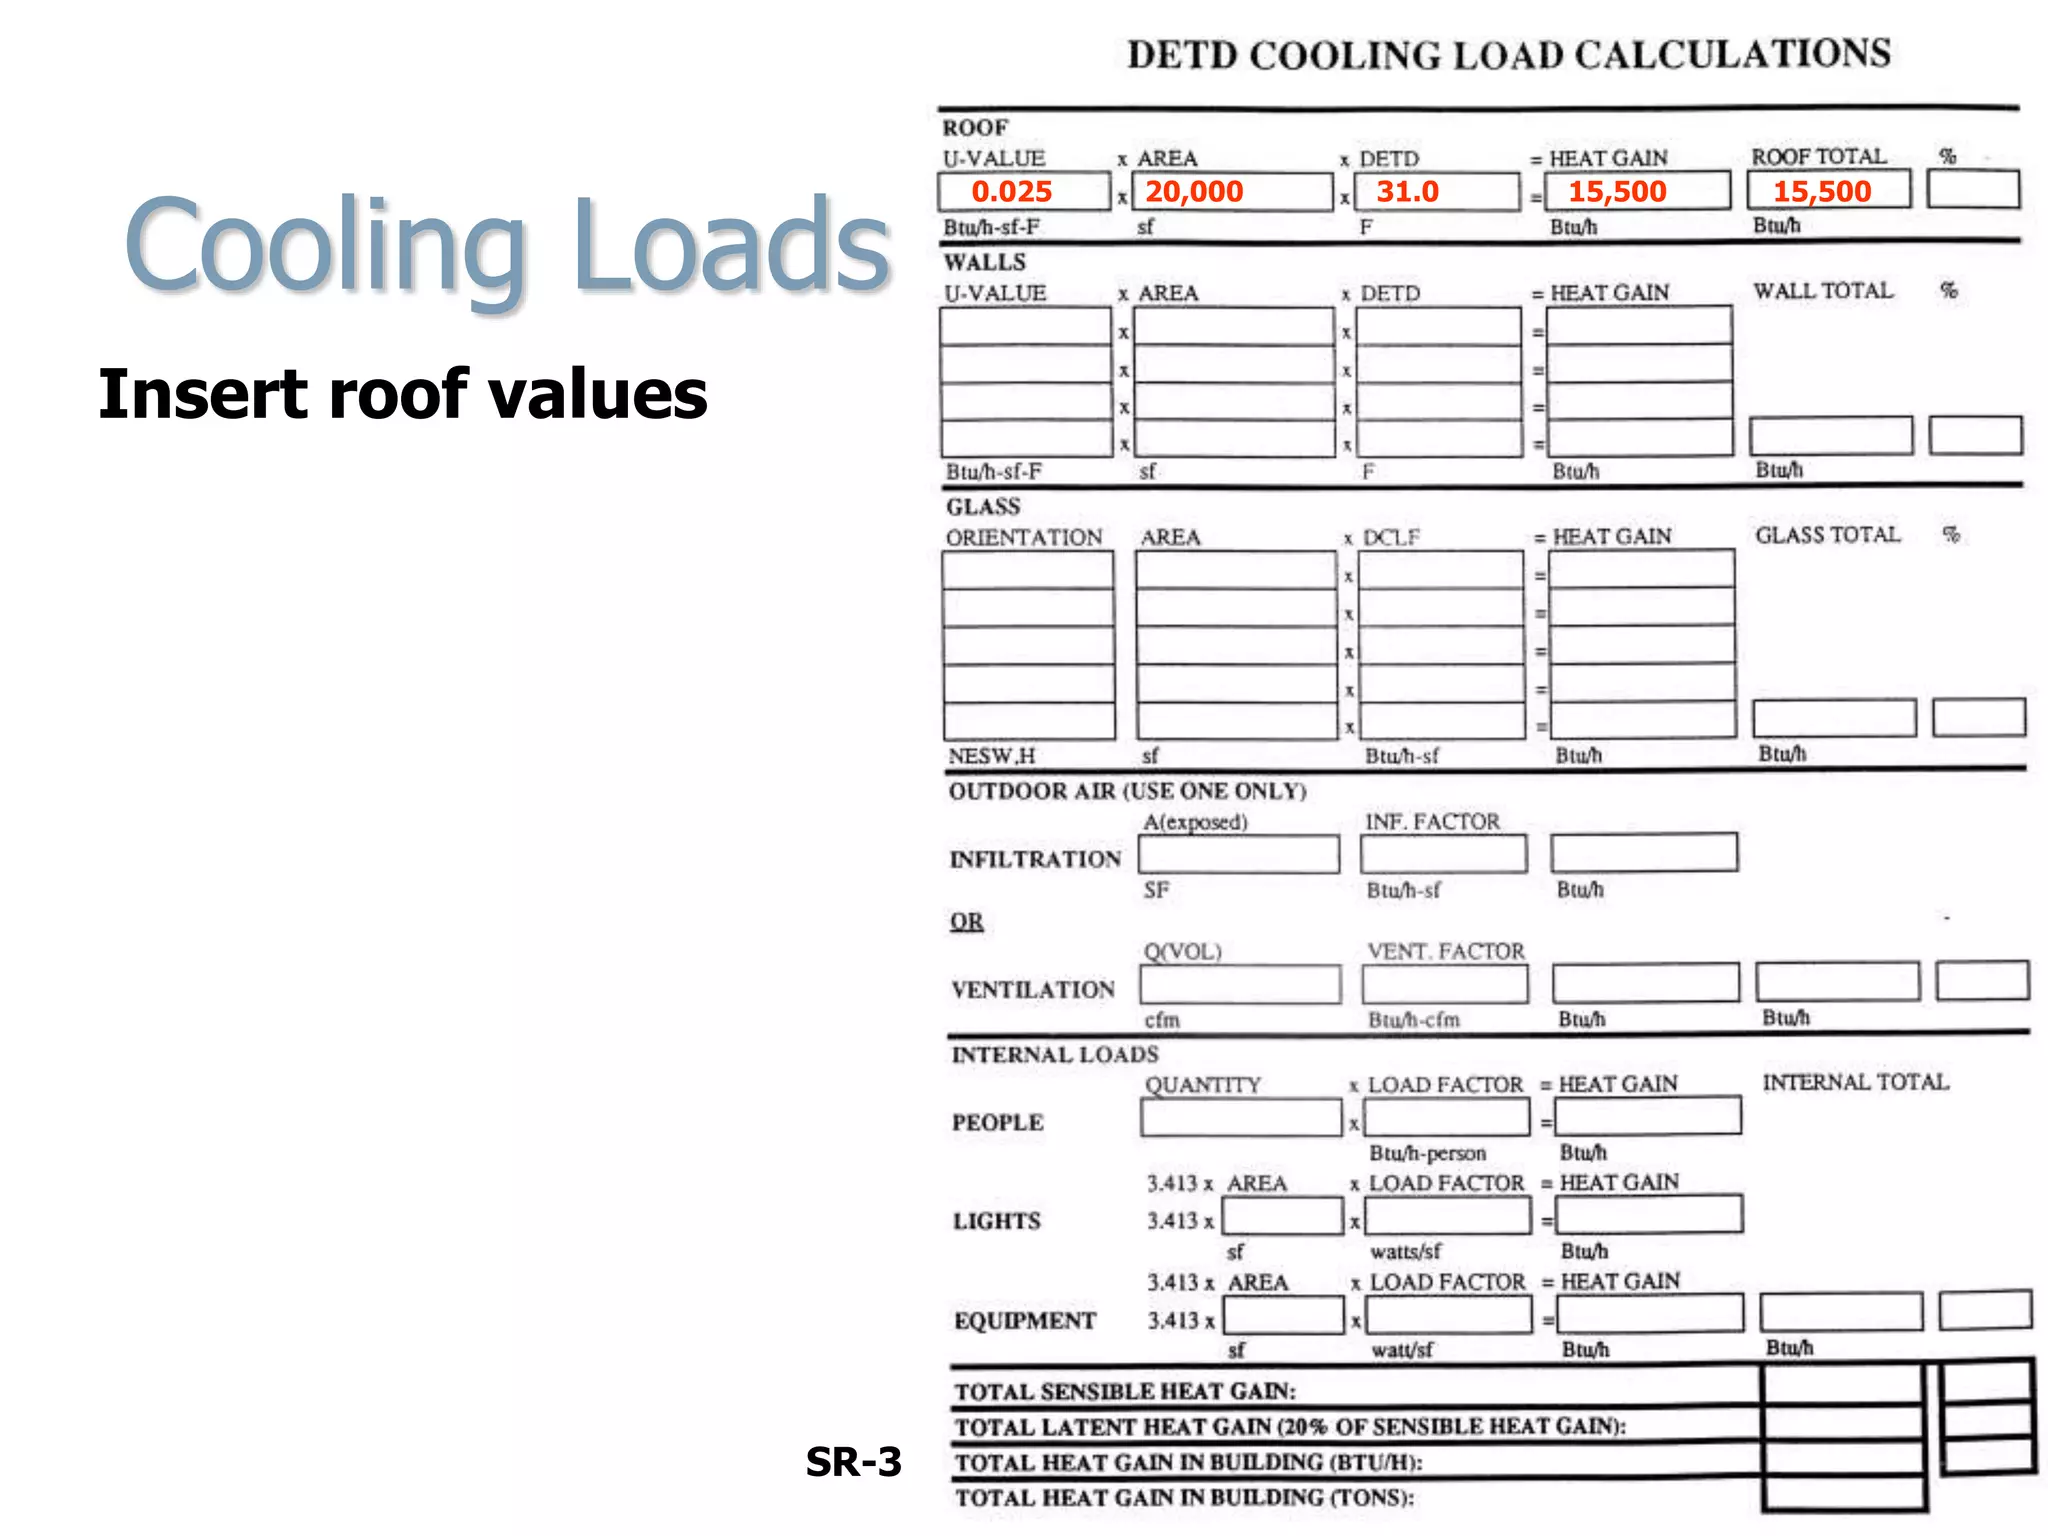
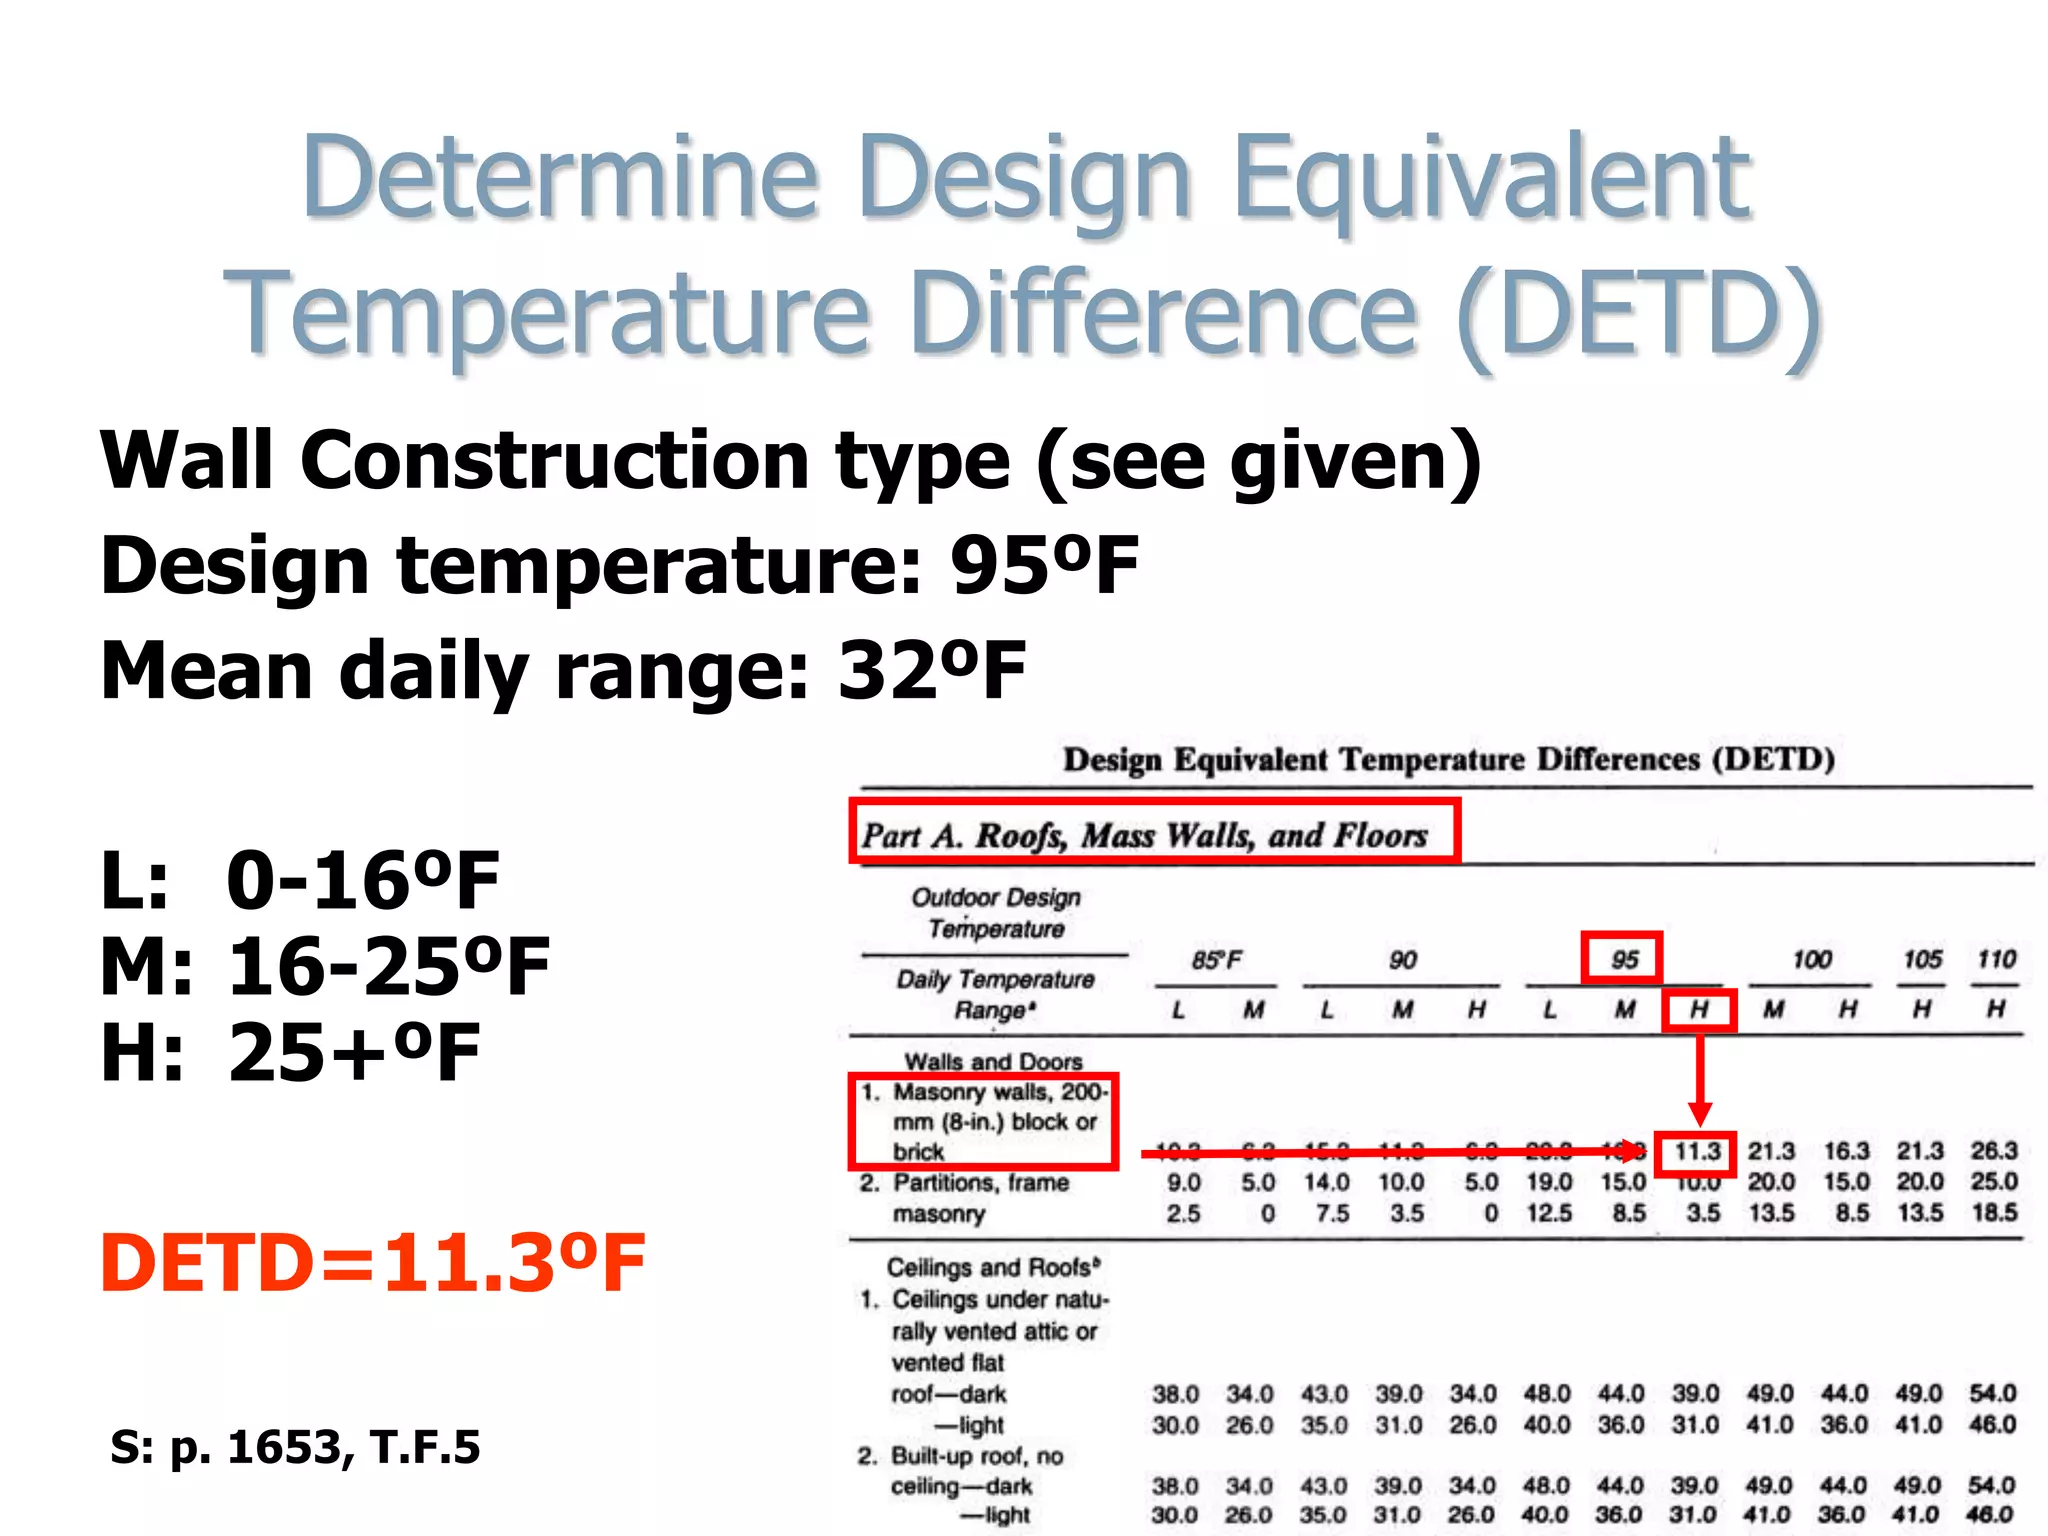
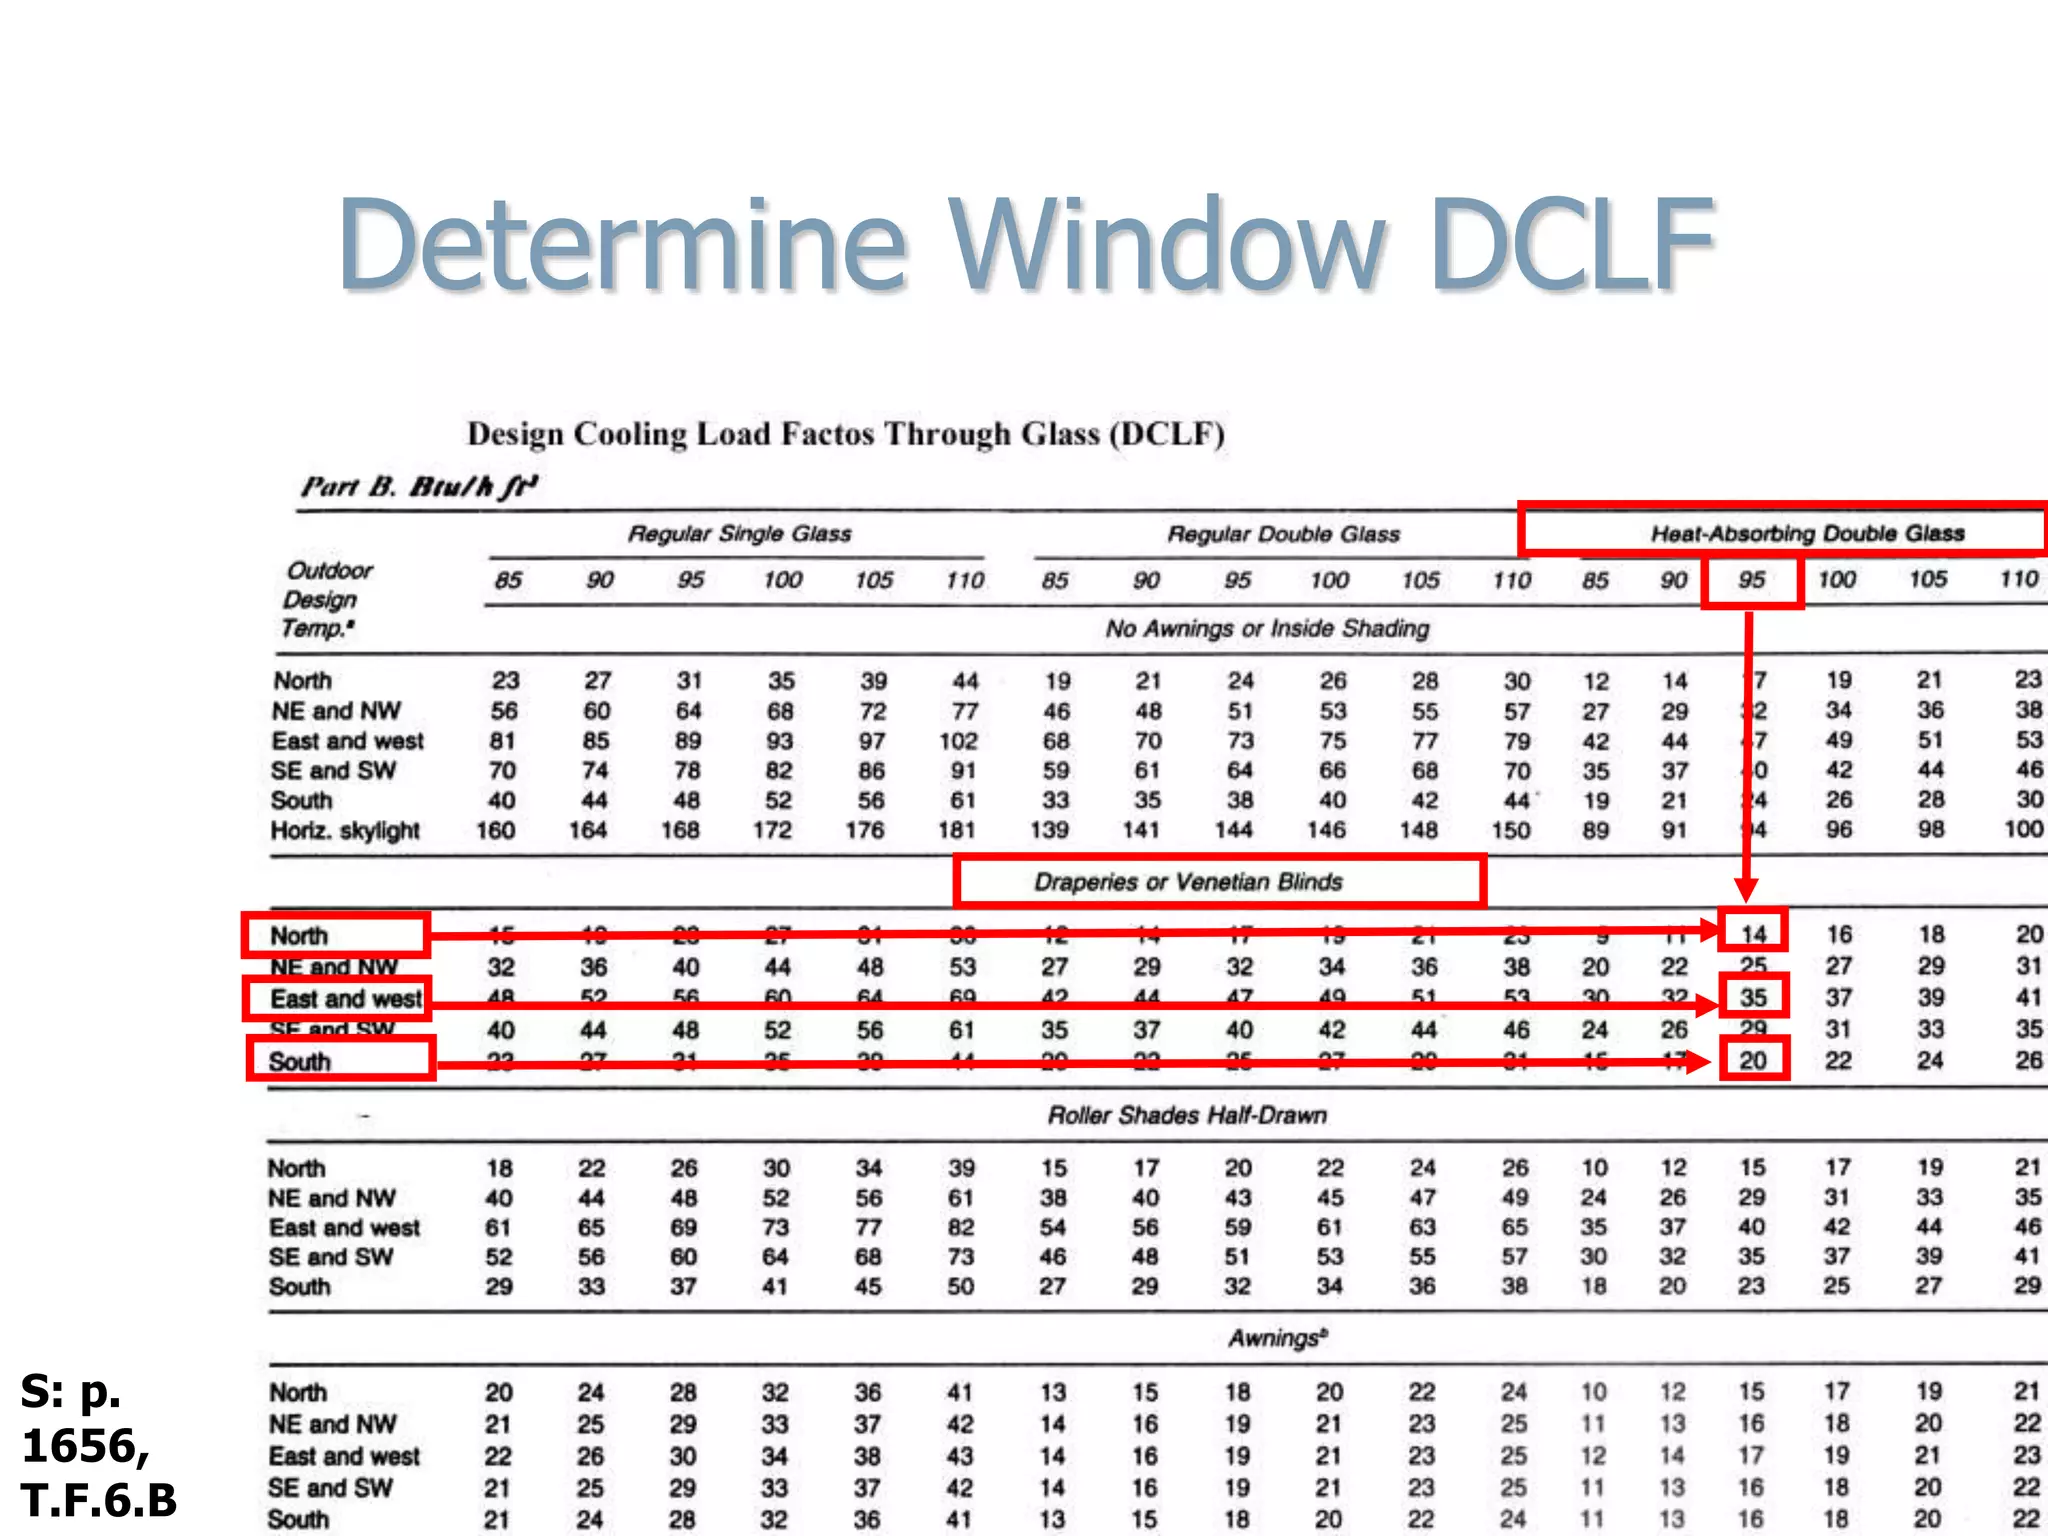
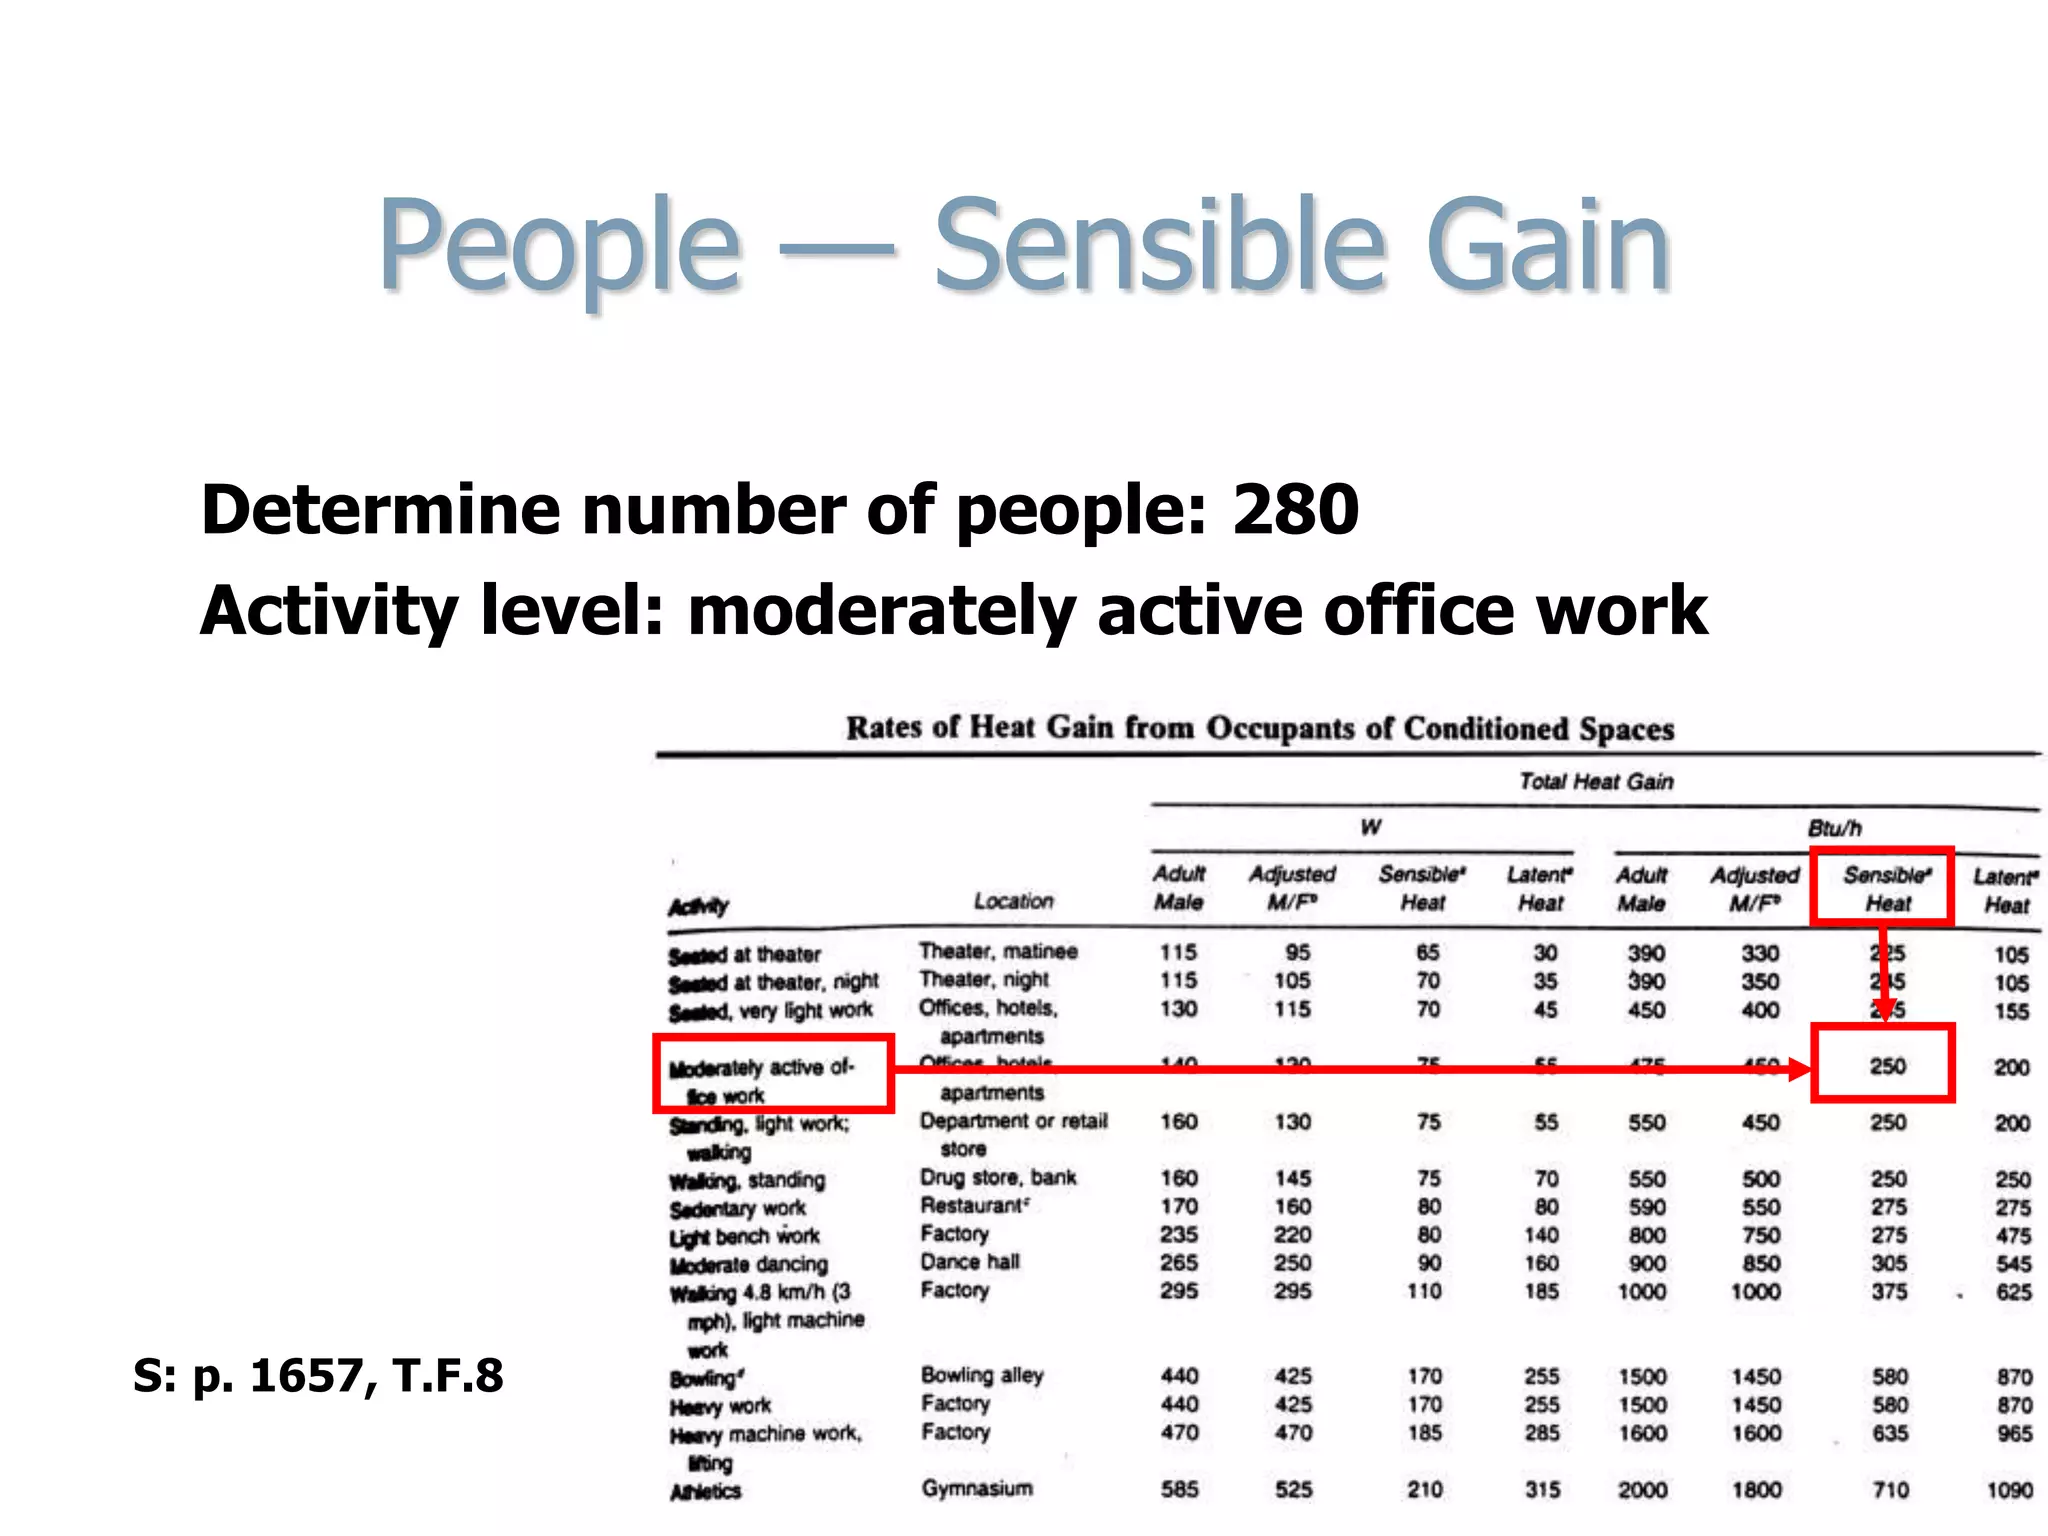
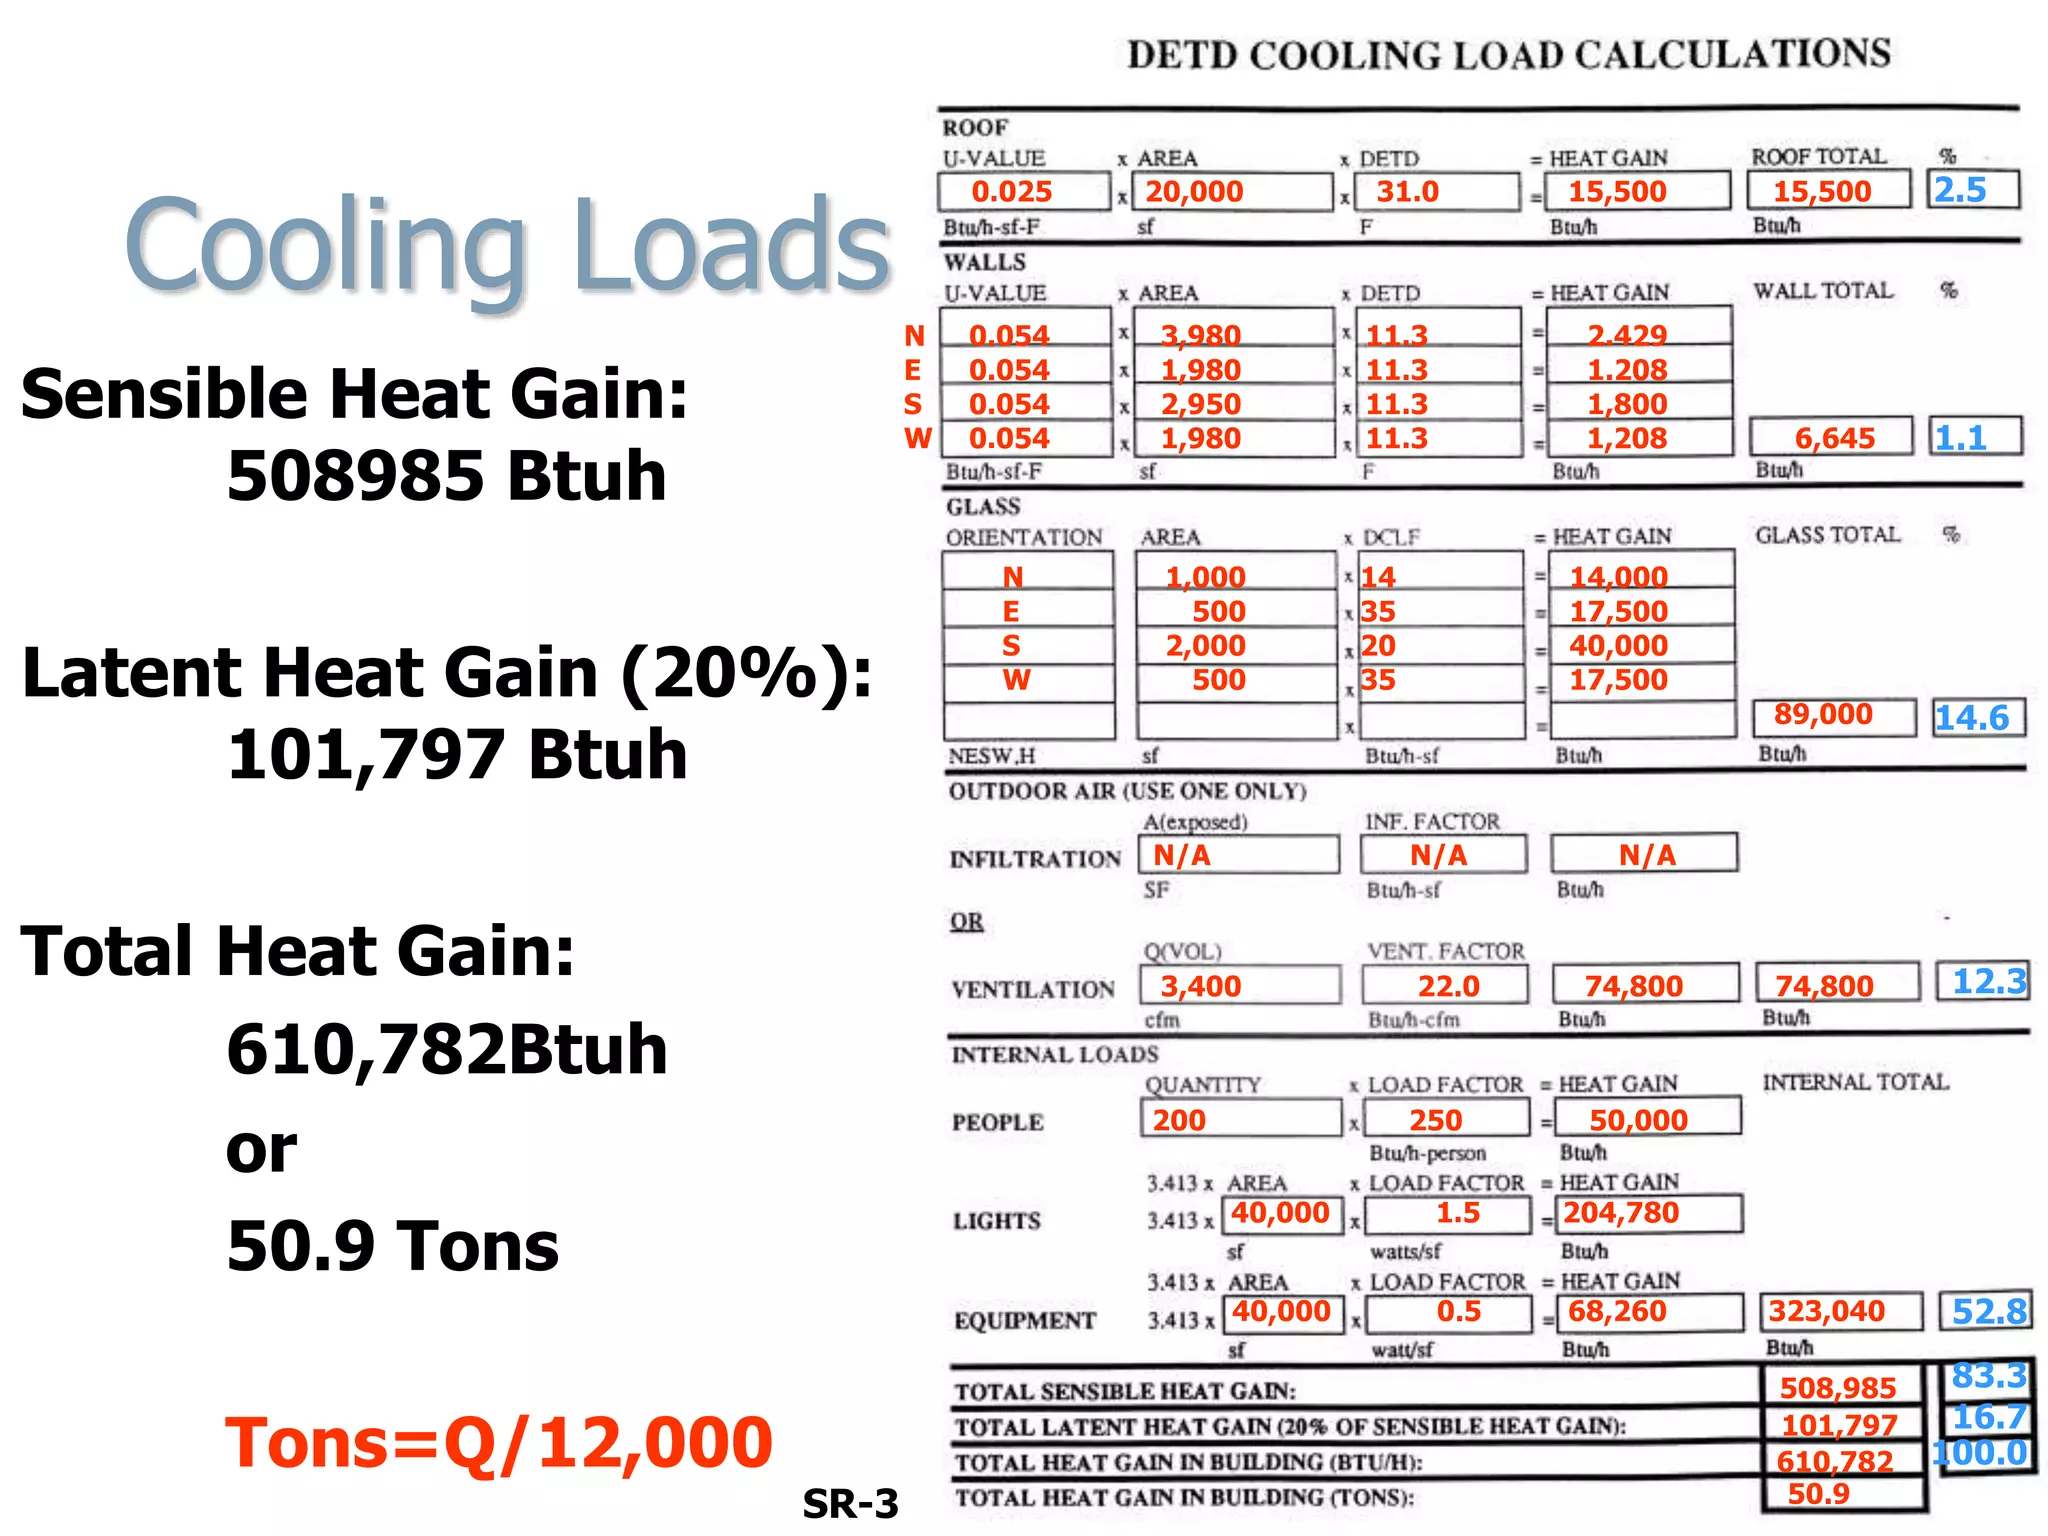
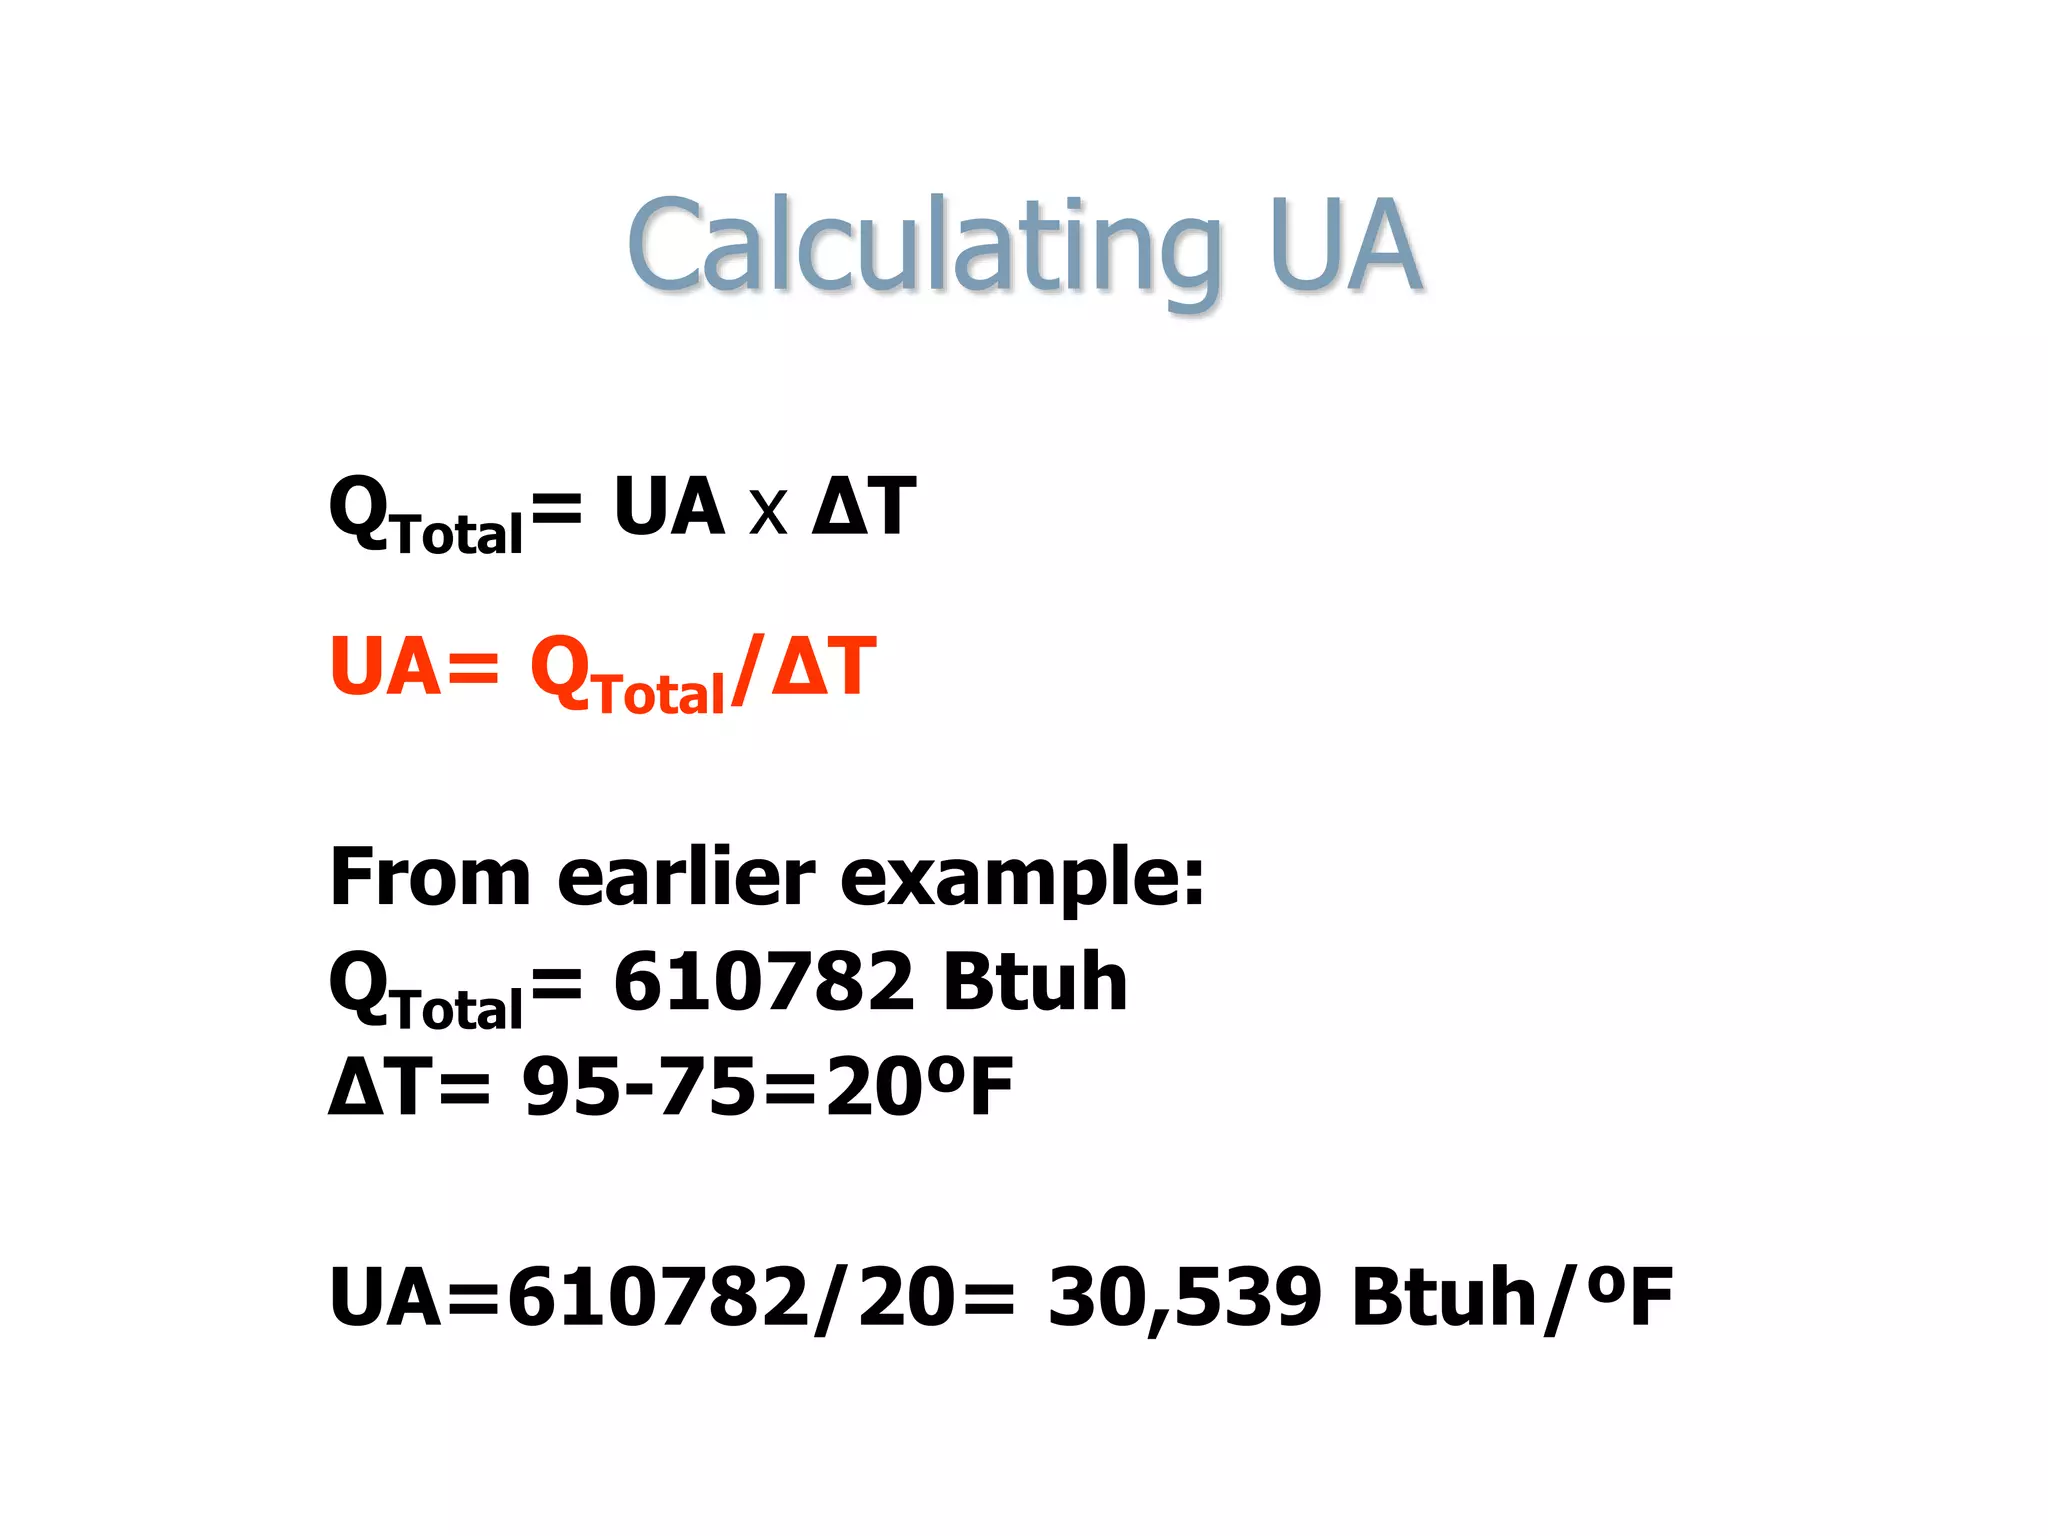
- Calculating cooling loads based on envelope areas, U-values, glazing properties, infiltration, ventilation, occupants, lighting, and equipment.
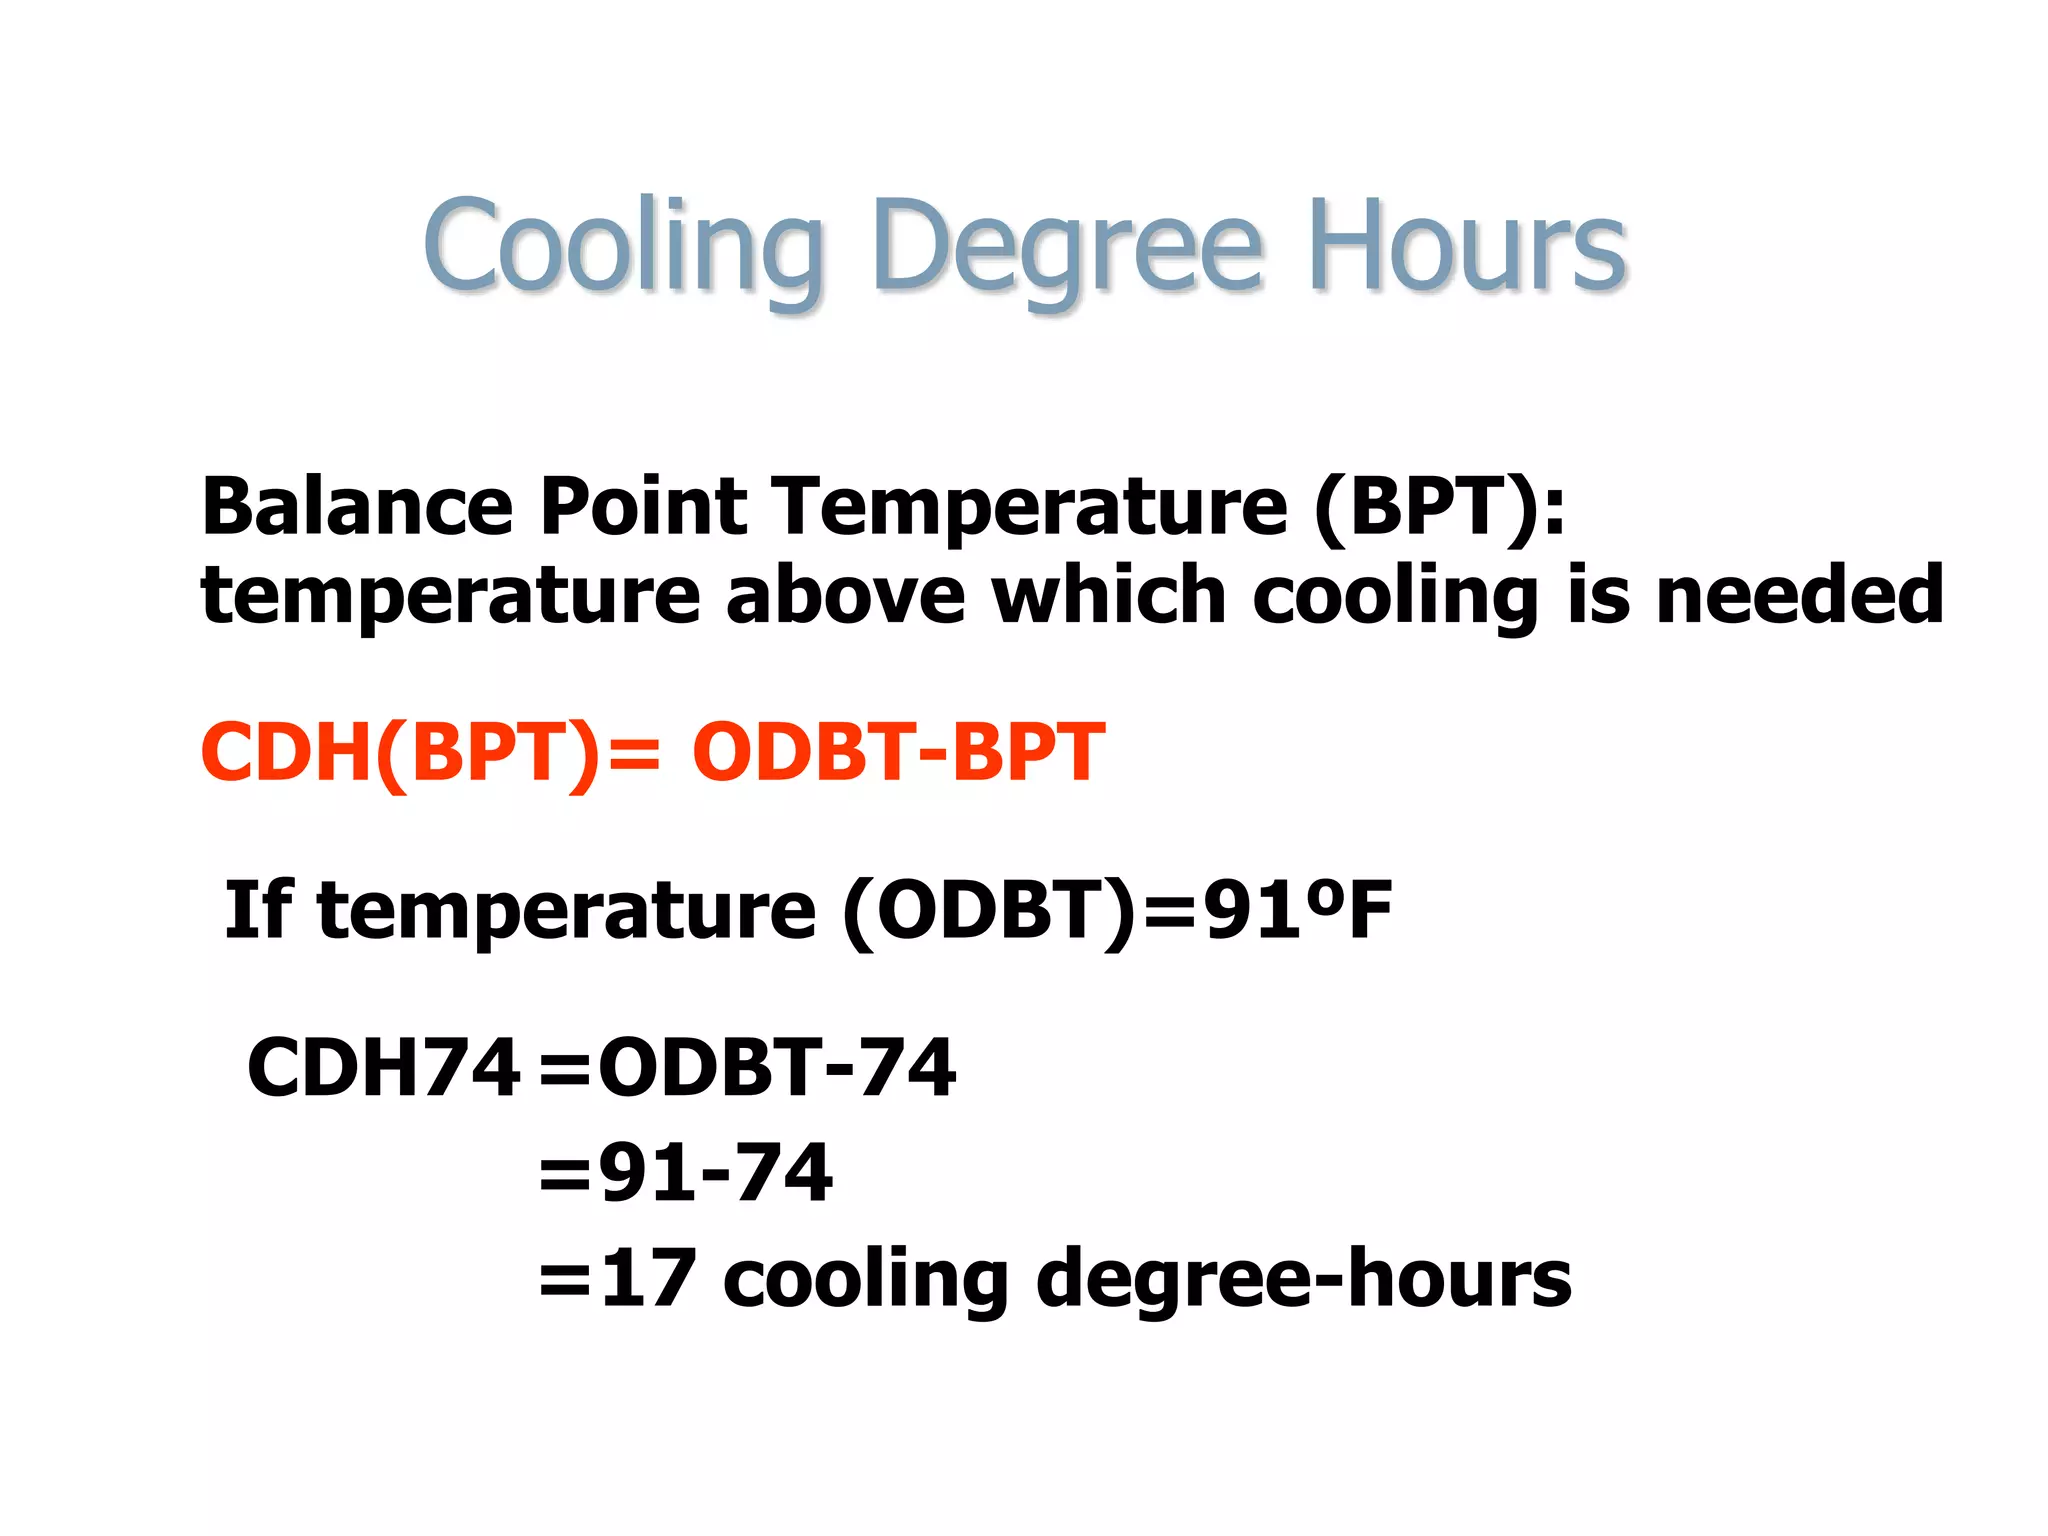
- Determining cooling degree hours to indicate relative warmth for a location.
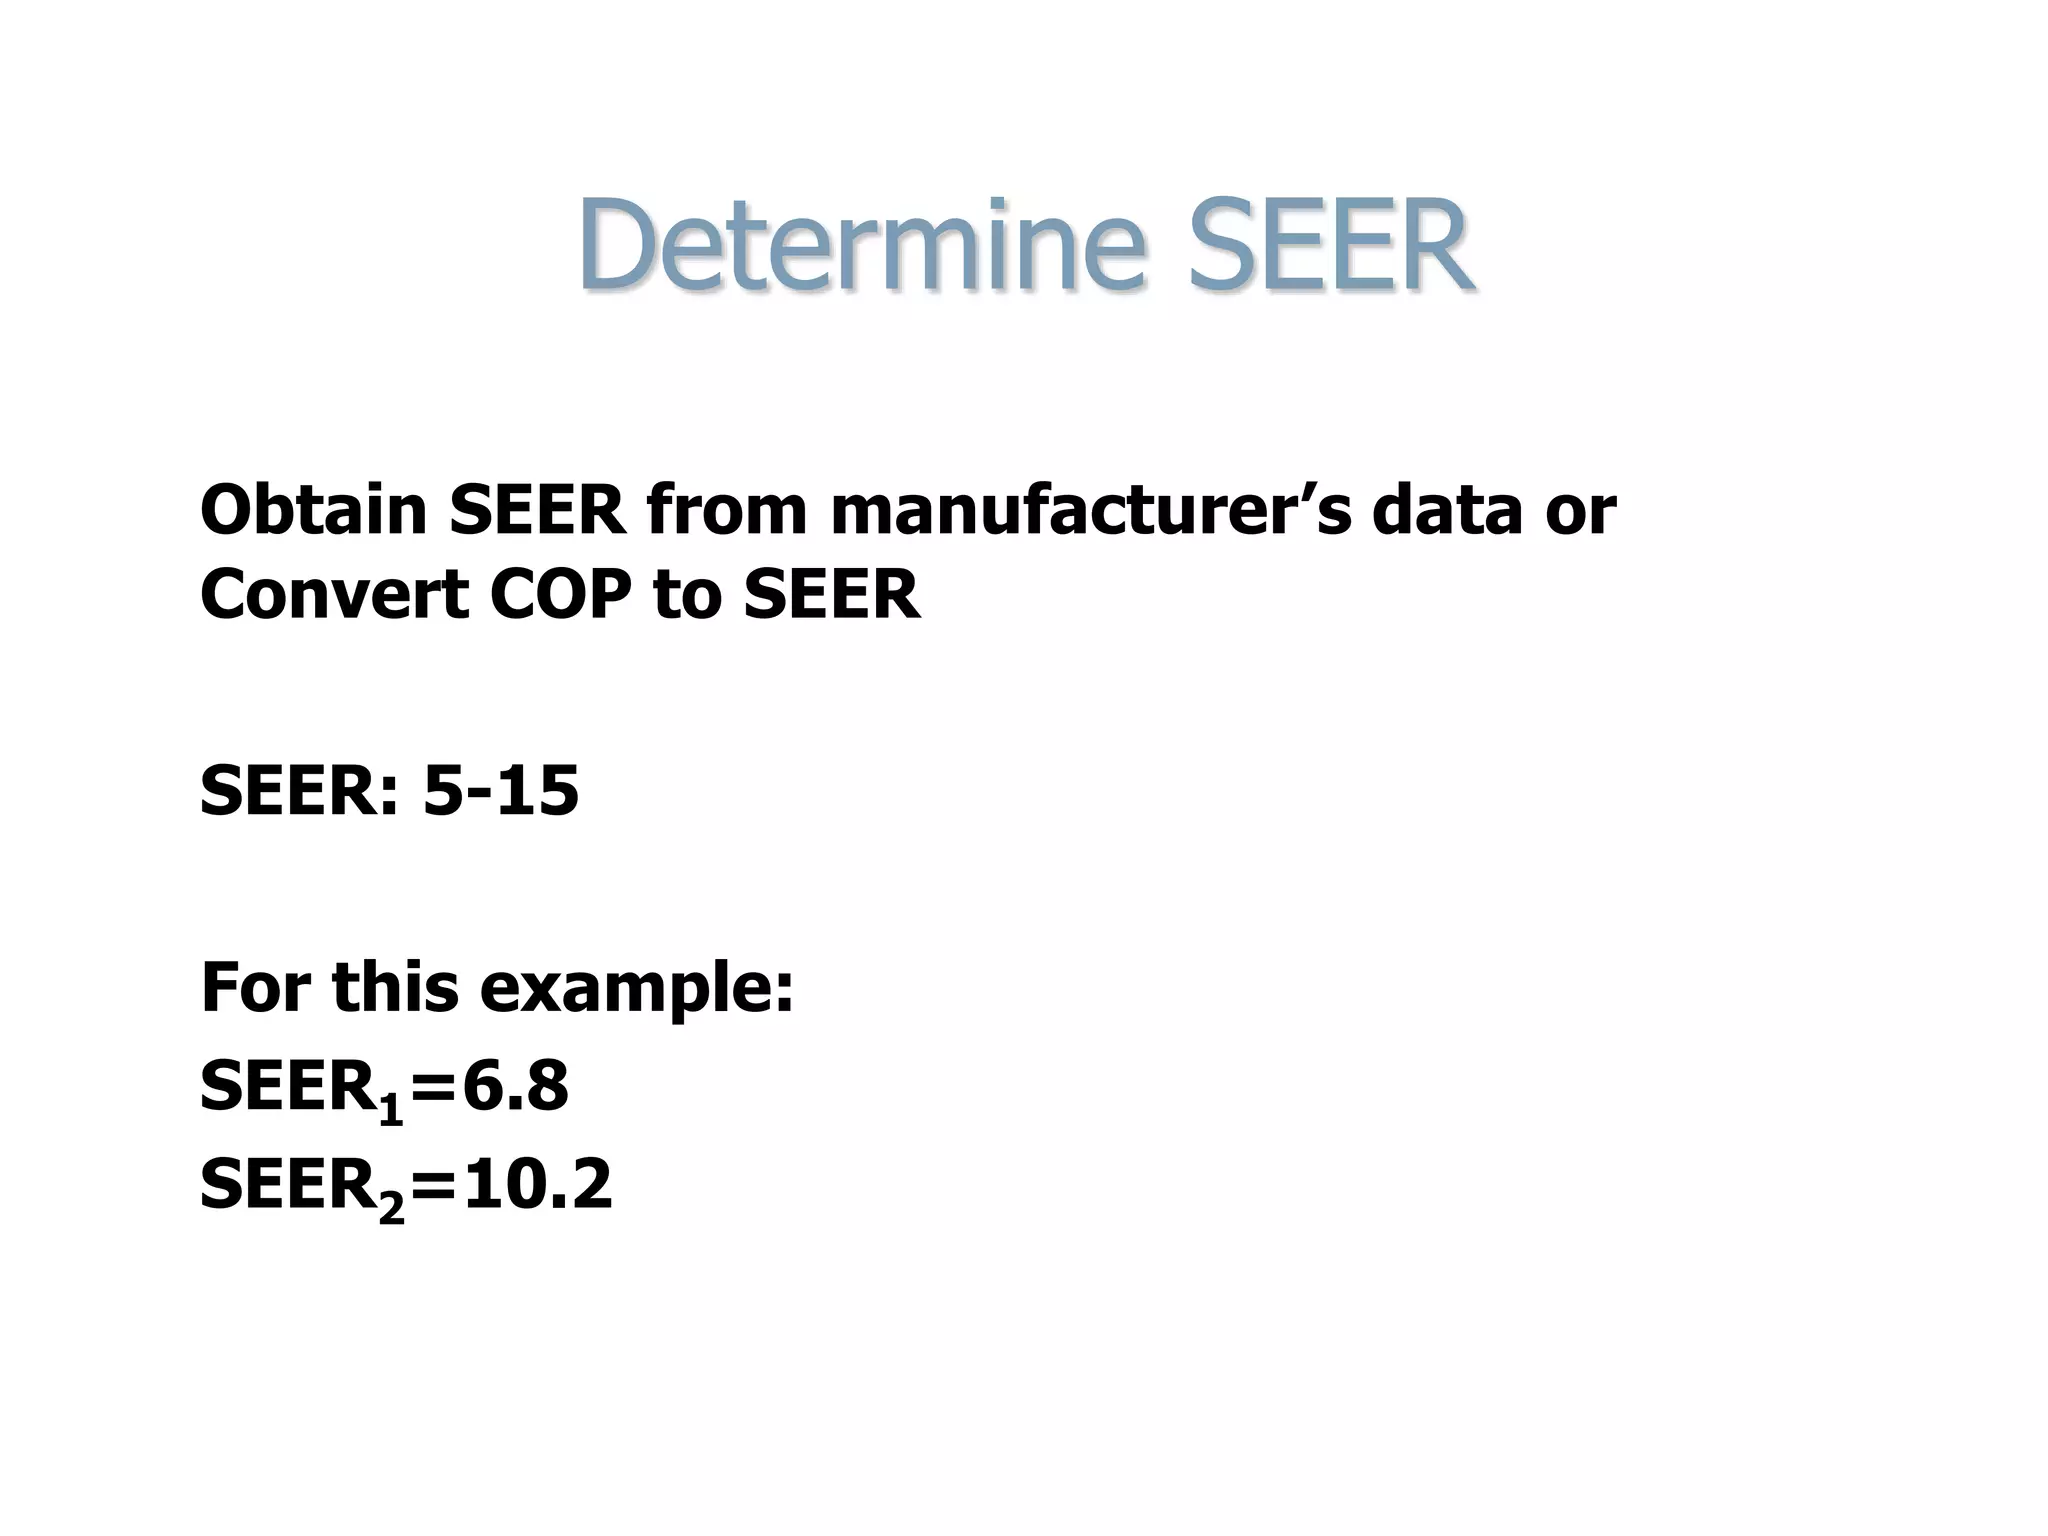
- Energy performance ratings like SEER, EER, and COP that indicate efficiency of cooling systems.
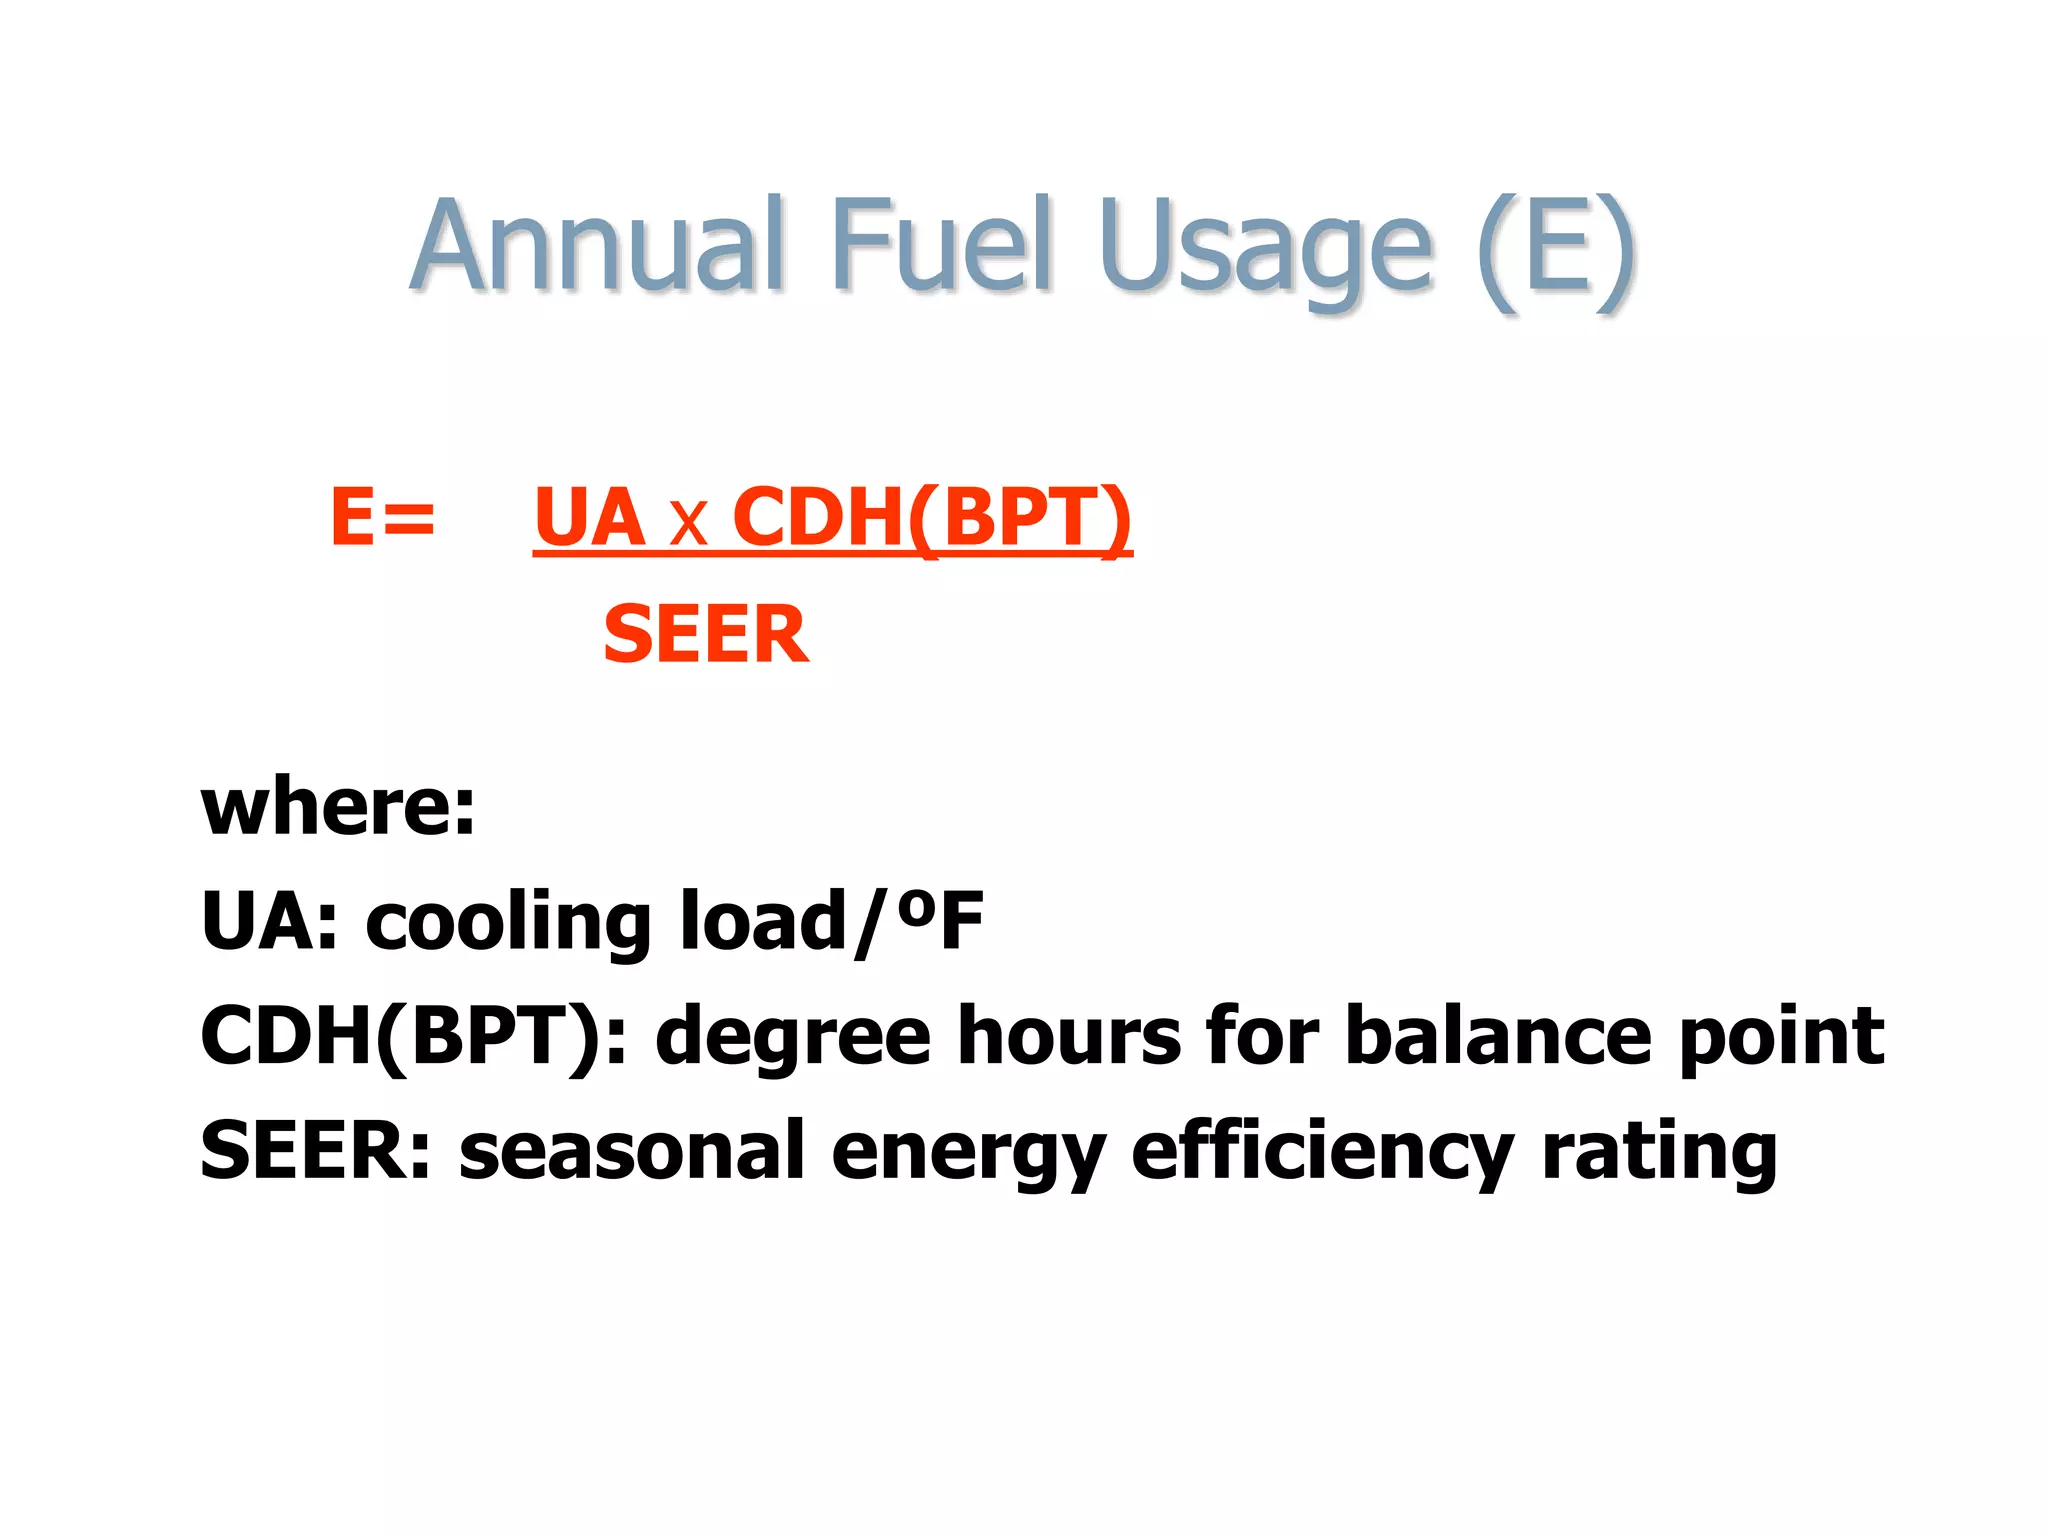
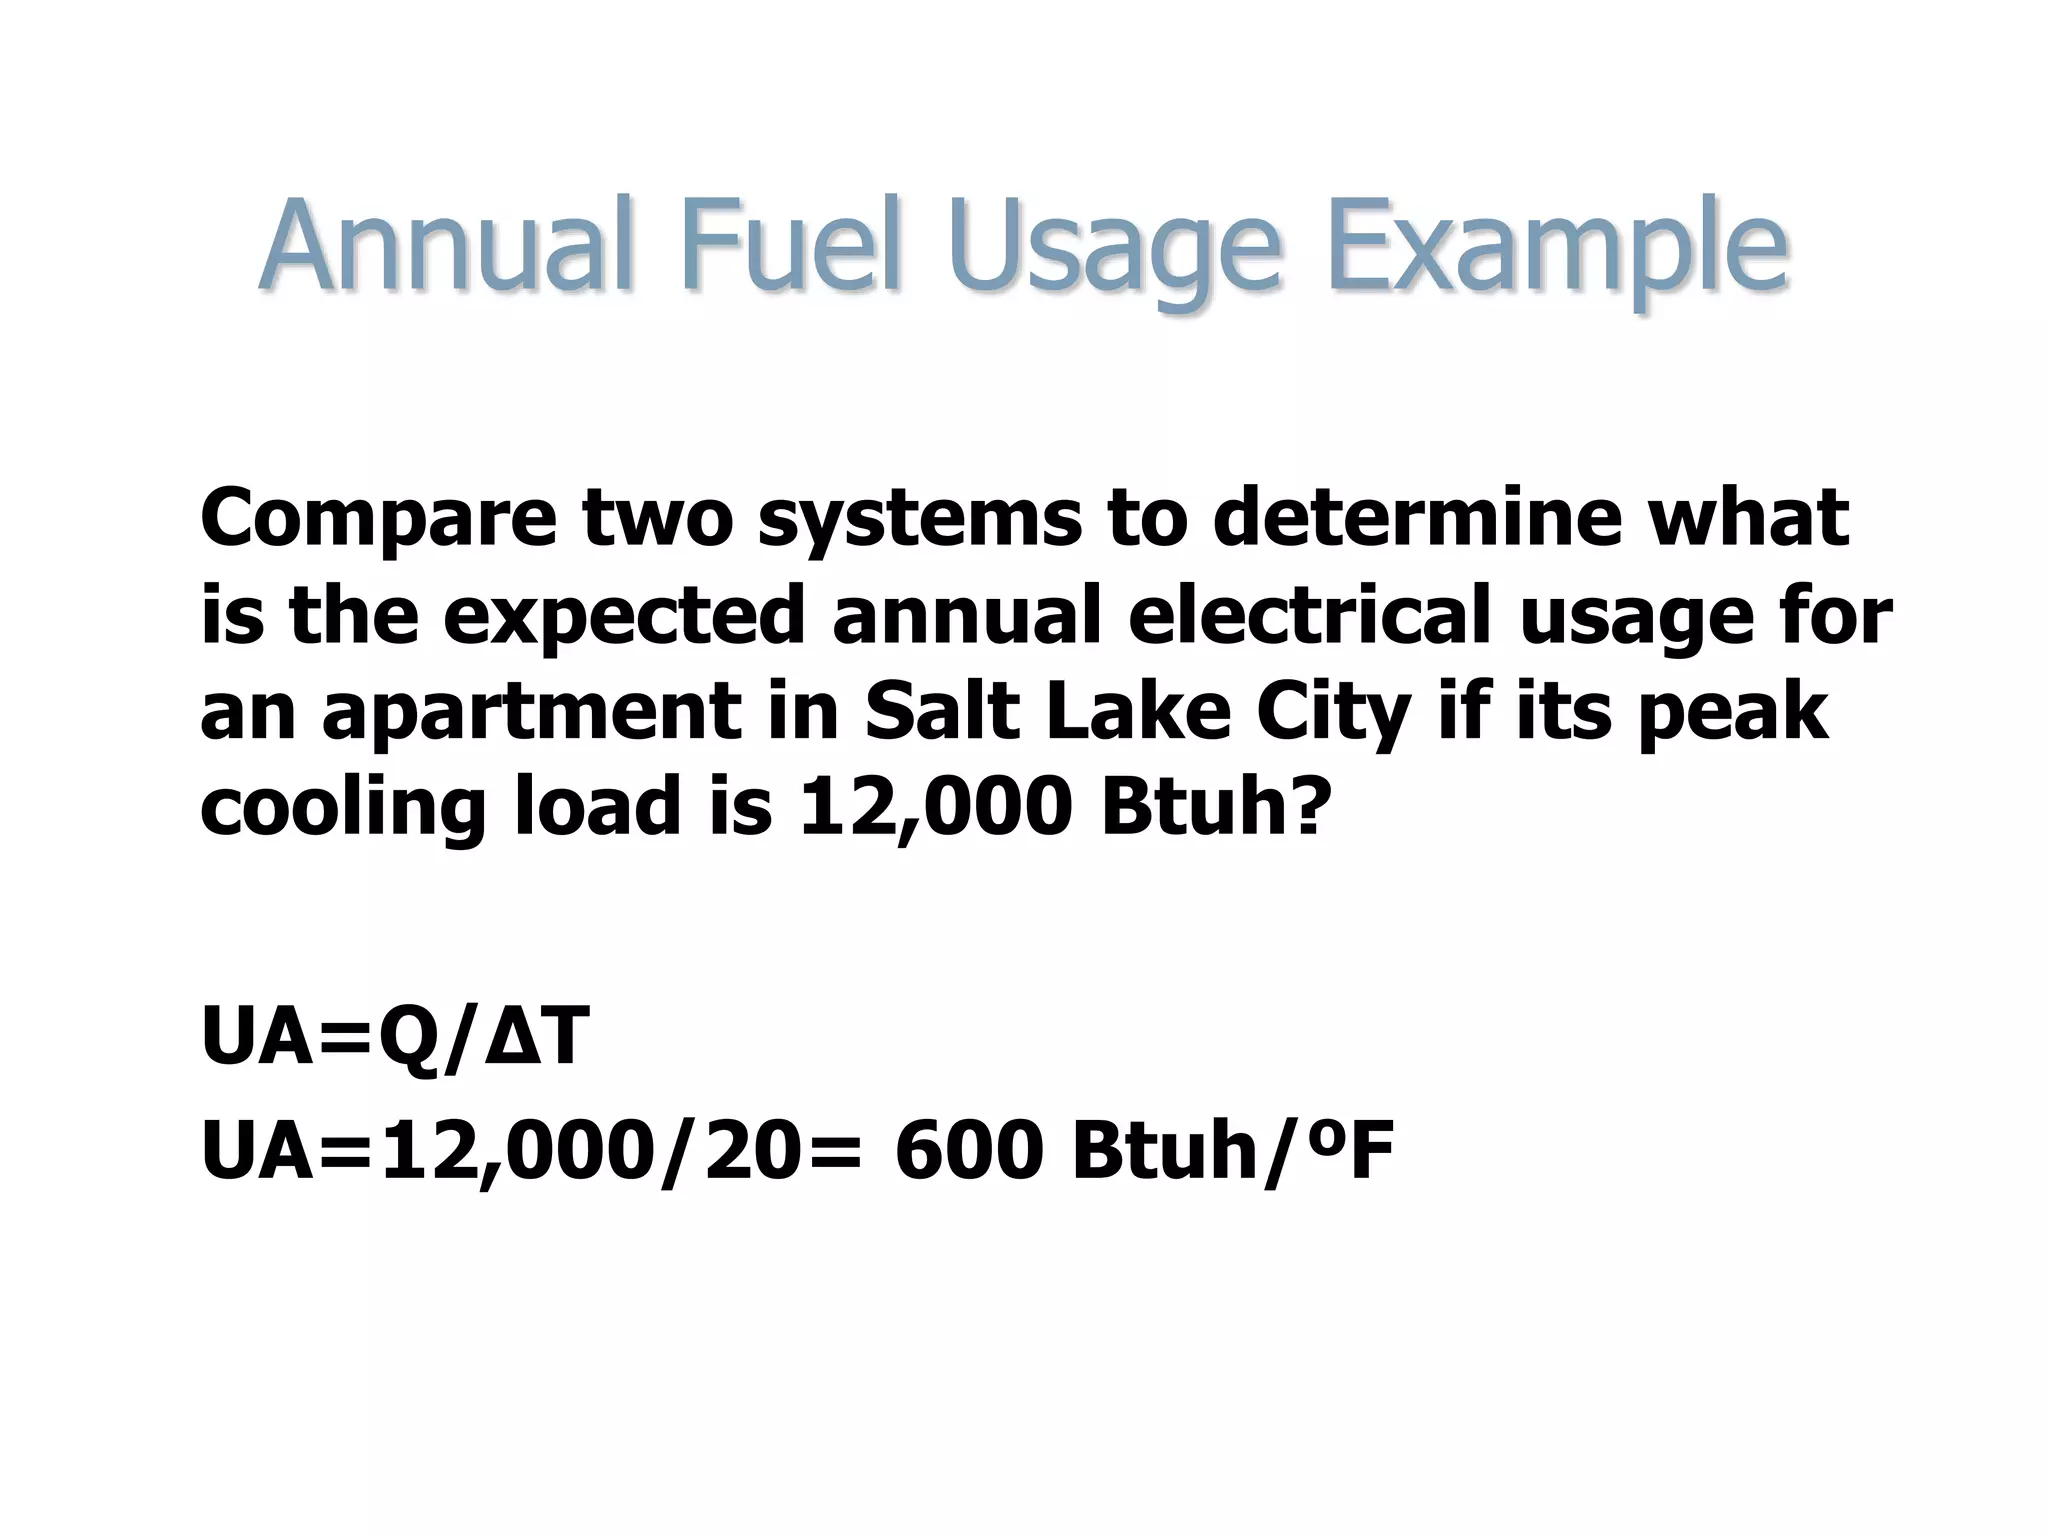
- Computing annual fuel consumption and costs based on cooling load, degree hours, and system efficiency ratings.
- Comparing simple payback periods of different cooling system options.


![[ME-20249]Complex Engineering RAC file.pdf](https://cdn.slidesharecdn.com/ss_thumbnails/me-20249complexengineeringracfile-240210072631-f4b23cdd-thumbnail.jpg?width=640&height=640&fit=bounds)


![[BROCHURE] Italy Tour Project | @SlideON](https://cdn.slidesharecdn.com/ss_thumbnails/brochure8-251215152319-2805af68-thumbnail.jpg?width=640&height=640&fit=bounds)


