Construction Industry Snapshot December 2014
•
1 like•245 views

Construction Industry Snapshot December 2014

Recommended
Recommended
More Related Content
What's hot
What's hot (20)
Similar to Construction Industry Snapshot December 2014
Similar to Construction Industry Snapshot December 2014 (20)
Recently uploaded
Recently uploaded (20)
Construction Industry Snapshot December 2014
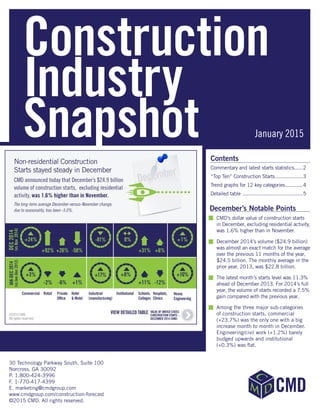
- 1. Construction Industry Snapshot January 2015 CMD’s dollar value of construction starts in December, excluding residential activity, was 1.6% higher than in November. December 2014’s volume ($24.9 billion) was almost an exact match for the average over the previous 11 months of the year, $24.5 billion. The monthly average in the prior year, 2013, was $22.8 billion. The latest month’s starts level was 11.3% ahead of December 2013. For 2014’s full year, the volume of starts recorded a 7.5% gain compared with the previous year. Among the three major sub-categories of construction starts, commercial (+23.7%) was the only one with a big increase month to month in December. Engineering/civil work (+1.2%) barely budged upwards and institutional (+0.3%) was flat. Contents Commentary and latest starts statistics......2 “Top Ten” Construction Starts....................3 Trend graphs for 12 key categories.............4 Detailed table ..........................................5 December’s Notable Points 30 Technology Parkway South, Suite 100 Norcross, GA 30092 P. 1.800-424-3996 F. 1-770-417-4399 E. marketing@cmdgroup.com www.cmdgroup.com/construction-forecast ©2015 CMD. All rights reserved.
- 2. Construction Industry Snapshot ©2015 CMD. All Rights Reserved. 2 CMD’s December Starts Stayed Steady CMD announced today that December’s $24.9 billion volume of construction starts, excluding residential activity, was 1.6% higher than in November. The small increase becomes more praiseworthy when seasonality is taken into account. CMD’s long-term average December-versus-November percentage change has been -5.0%. Worsening weather as fall turns into winter, plus the holidays, usually take a toll on starts. December 2014’s volume ($24.9 billion) was almost an exact match for the average over the previous 11 months of the year, $24.5 billion. The monthly average in the prior year, 2013, was $22.8 billion. The latest month’s starts level was 11.3% ahead of December 2013. For 2014’s full year, the volume of starts recorded a 7.5% gain compared with the previous year. The starts figures are in “current” dollars, meaning they are not adjusted for inflation. “Non-residential building” plus “engineering/civil” work accounts for a considerably larger share of total construction than residential activity. The former’s combined propor- tion of total put-in-place construction in the Census Bureau’s November report was 63% versus the latter’s 37%. CMD’s construction starts are leading indicators for the Census Bureau’s capital invest- ment or put-in-place series. Also, the reporting period for starts (December) is one month ahead of the reporting period for the investment series (November.) U.S. “real” (i.e., inflation-adjusted) gross domestic product (GDP) growth in the latest quarter for which there is data (Q3 2014) was an outsized +5.0%, on top of an almost as noteworthy +4.6% in the second quarter. The unemployment rate for the economy as a whole has dropped to only 5.6%, according to the latest report (December 2014) from the Department of Labor. In December, the construction sector added 48,000 net new jobs, the second largest month-to-monthjumpsincetherecession,beatenonlybyJanuaryoflastyear(+51,000).Year- over-year average hourly earnings in construction were restrained in December, at +1.6%, but average weekly earnings shot up to +4.5% from +2.7% in November and -1.0% in December 2013. It’s too early to say construction is storming back, but it’s beginning to seek attention. Among the three major sub-categories of construction starts, commercial (+23.7%) was the only one with a big increase month-to-month in December. Engineering/civil work (+1.2%) barely budged upwards and institutional (+0.3%) was flat. The smaller category of industrial starts (-81.4%) fell by four-fifths. The latter category is prone to wide swings that result from an irregular pattern of large project initiations. When December of this year is compared with December of last year, commercial work (+26.8%) was again the frontrunner, with heavy engineering (+9.9%) in second place. Institutional (+3.1%) hardly made any headway. Industrial (-49.8%) was down by half. The institutional category (+7.6%) fared better in the full-year 2014 versus full-year 2013 comparison, ranking only slightly behind engineering/civil (+9.6%), but with a lead on com- mercial (+3.3%). Full-year 2014’s industrial starts were up a nice 16.5% versus all of 2013. Within heavy engineering, the major sub-category — with a 42% share of the full year total — was “road/highway” work. It was unequivocally positive in December: +5.0% month to month (m/m); +7.3% year over year (y/y); and +14.7% year to date (ytd). Water and sewage work, with a runner-up 24% slice of the civil category, was +11.8% m/m; +33.2% y/y; and +10.7% ytd. Bridge work also showed lively gains: +23.0% m/m; +26.4% y/y; and +5.9% ytd. School/college starts accounted for 60% of the total institutional category in 2014. Their December m/m change (+30.6%) quickened the pace of their y/y (+11.2%) and ytd (+11.4%) performances. Hospital/clinic starts were +6.3% m/m and +3.0% y/y, but -12.3% ytd. Military starts were dismal m/m and y/y, at -88.0% and -41.1% respectively, but brilliant ytd, +68.8%. Among commercial’s major sub-categories, retail work in December was lackluster ytd (-1.7%), but much perkier m/m (+91.4%) and y/y (+112.0%). It’s good to see that private offices were +26.0% m/m, but that still left them -34.3% y/y and -6.2% ytd. Government offices were the reverse: -17.8% m/m; +1.3% y/y; and +13.4% ytd. Two other interesting changes ytd occurred in warehouses, which were ahead dramati- cally (+65.6%), and in hotels/motels (+1.3%), where the shades were drawn. The12-monthmovingaveragetrendgraphsarecontinuingtoclimbforbothnon-residential building and heavy engineering starts. Within the first category, the rise of institutional work has been a steady progression. Commercial’s upward journey has been more fitful and ragged. Retail work — based on its 12-month moving average trend graph — may be pre- paring for a take-off, but private office buildings are (probably temporarily) in reversal. School/college and road/highway starts are on gentle climbing slopes. Hospital/clinic work is still languishing. The dramatic drop in the world price of oil will undoubtedly put a halt to some expansion plans in America’s shale-rock oil and gas sector. The lower price of gasoline, however, will provide stimulus — similar to a large tax cut or a big pay raise — to the overall economy. Some politicians are seeing an opportunity to increase government revenues through mea- sures such as a hike in the federal gas tax, with the additional funding to go towards necessary infrastructure projects. The value of construction starts each month is summarized from CMD’s database of all active construction projects in the U.S. Missing project values are estimated with the help of RSMeans’ building cost models. CMD’s non-residential construction starts series, because it is comprised of total-value estimates for individual projects, some of which are enormous, has a history of being more volatile than many other leading indicators for the economy. Alex Carrick A start is determined by taking the announced bid date and adding 30 days. It is then assumed the project will actually break ground within 30 to 60 days of the start date. CMD continues to follow the project via its network of researchers. If it is abandoned or re-bid, then the start data is updated to reflect the new information. Source: CMD Research Group/Table: CMD. VALUE OF UNITED STATES CONSTRUCTION STARTS – DECEMBER 2014 YEAR TO DATE (CMD) % Change % Change % Change Jan-Dec 14 Jan-Dec 14 vs Dec 14 vs Dec 14 vs ($ billions) Jan-Dec 13 Dec 13 Nov 14 Hotel/Motel 7.093 1.3% -39.6% -58.0% Retail 18.311 -1.7% 112.0% 91.4% Parking Garage 1.799 -9.4% 22.6% -7.7% Amusement 6.139 11.4% -30.5% -31.2% Private Office 14.149 -6.2% -34.3% 26.0% Government Office 10.807 13.4% 1.3% -17.8% Laboratory 2.376 36.7% 8.5% -34.5% Warehouse 6.874 65.6% -9.0% -4.0% Miscellaneous Commercial 12.944 -9.6% 184.5% 101.0% COMMERCIAL 80.490 3.3% 26.8% 23.7% INDUSTRIAL (Manufacturing) 9.382 16.5% -49.8% -81.4% Religious 1.387 -19.5% -28.5% 21.3% Hospital/Clinic 13.147 -12.3% 3.0% 6.3% Nursing/Assisted Living 3.896 -3.1% -1.0% 4.4% Library/Museum 2.237 0.6% -23.2% 94.8% Police/Courthouse/Prison 4.004 -3.1% 65.6% -5.3% Military 8.340 68.8% -41.1% -88.0% School/College 53.962 11.4% 11.2% 30.6% Miscellaneous Government 2.332 -9.6% -62.5% -31.1% INSTITUTIONAL 89.305 7.6% 3.1% 0.3% Miscellaneous Non-residential 3.899 19.7% 17.7% -24.2% NON-RESIDENTIAL BUILDING 183.077 6.3% 12.2% 1.8% Airport 3.285 15.2% -38.5% -86.1% Road/Highway 47.239 14.7% 7.3% 5.0% Bridge 11.291 5.9% 26.4% 23.0% Dam/Marine 5.084 -5.2% 0.5% -13.6% Water/Sewage 26.235 10.7% 33.2% 11.8% Miscellaneous Civil 18.377 2.5% -13.3% -10.3% HEAVY ENGINEERING 111.512 9.6% 9.9% 1.2% TOTAL NON-RESIDENTIAL 294.589 7.5% 11.3% 1.6% Data source: Reed Research Group and Reed Construction Data (RCD). Table: Reed Construction Data - CanaData. Name of file: "RCD Starts FINAL (Dec 14) - Extra.xlsx" in "U.S. 2014" folder VALUE OF UNITED STATES CONSTRUCTION STARTS - DECEMBER 2014 YEAR TO DATE (Reed Construction Data) Alex Carrick is Chief Economist for CMD. He has delivered presentations throughout North America on the U.S., Canadian and world construction outlooks. Mr. Carrick has been with CMD since 1985.
- 3. Construction Industry Snapshot ©2015 CMD. All Rights Reserved. 3 REGION (EAST TO WEST) TYPE OF CONSTRUCTION DESCRIPTION SQUARE FEET 000S DOLLARS 000,000S Connecticut Waterbury Engineering/Civil CTDOT I-84 * $261 I-84 Connecticut Transportation Department New York Bronx Engineering/Civil Robert F Kennedy Bridge Bronx Plaza & Structure * $213 I-278 MTA Bridges & Tunnels New Jersey Newark Commercial Prudential Financial Tower Phases 1 & 2 782 $444 (2 structures; 20 stories) 687-695 Broad St Prudential Insurance Co Long Beach Engineering/Civil Long Beach Island Beachfill & Little Egg Inlet * $128 Philadelphia District Engineers Corp North Carolina Forsyth County Engineering/Civil NCDOT Grading Drainage * $154 various locations North Carolina Department of Transportation Raleigh Florida Orlando Commercial Orlando International Airport South Intermodal Terminal * $213 (1 structure; 5 stories) 365 Rickenbacker Dr Greater Orlando Airport Authority Planning & Engineering Illinois Stickney Engineering/Civil Metropolitan Water Reclamation District Settling Tanks & Aerated Grit Facility * $225 6001 W Pershing Rd Metropolitan Water Reclamation District Arizona Yuma Institutional Yuma Regional Medical Center 59 $250 2400 South Ave A Yuma Regional Medical Center Nevada Reno Commercial Logisticenter 395 Office Complex 735 $150 Lemmon Dr & Hwy 395 Dermody Properties Washington King County Engineering/Civil WADOT 2 Way Transit & HOV Operations Stage 3 * $120 I-90 Washington Department of Transportation TOTALS: 1,576 $2,158 THESE ARE THE 10 LARGEST PROJECTS IN THE U.S. START FIGURES FOR DECEMBER 2014 *A square footage measure does not apply for alteration and engineering/civil work. Source: CMD/Table: CMD.
- 4. Construction Industry Snapshot ©2015 CMD. All Rights Reserved. 4 Source: CMD/Charts: CMD. U.S. NON-RESIDENTIAL CONSTRUCTION STARTS – CMD (12-MONTH MOVING AVERAGES) U.S. RETAIL AND PRIVATE OFFICE BUILDING CONSTRUCTION STARTS – CMD (12-MONTH MOVING AVERAGES) U.S. ROAD/HIGHWAY AND WATER/SEWAGE CONSTRUCTION STARTS – CMD (12-MONTH MOVING AVERAGES) U.S. COMMERCIAL AND INSTITUTIONAL CONSTRUCTION STARTS – CMD (12-MONTH MOVING AVERAGES) U.S. HOSPITAL/CLINIC AND SCHOOL/COLLEGE CONSTRUCTION STARTS – CMD (12-MONTH MOVING AVERAGES) U.S. BRIDGES AND MISCELLANEOUS CIVIL CONSTRUCTION STARTS – CMD (12-MONTH MOVING AVERAGES) Data source: Reed Construction Data. Table: Reed Construction Data - CanaData. U.S. Non-residential Construction Starts ‒ CMD (12-month moving averages) Name of file: "RCD Starts FINAL (Dec 14) - Extra.xlsx" in "U.S. 2014" folder $0.0 $2.0 $4.0 $6.0 $8.0 $10.0 $12.0 $14.0 $16.0 $18.0 $20.0 05-J M M J S N 06-J M M J S N 07-J M M J S N 08-J M M J S N 09-J M M J S N 10-J M M J S N 11-J M M J S N 12-J M M J S N 13-J M M J S N 14-J M M J S N Current$billions Year and month Non-residential building Heavy engineering Dec Data source: Reed Construction Data. Table: Reed Construction Data - CanaData. U.S. Retail & Private Office Building Construction Starts ‒ CMD (12-month moving averages) Name of file: "RCD Starts FINAL (Dec 14) - Extra.xlsx" in "U.S. 2014" folder $0.0 $1.0 $2.0 $3.0 05-J M M J S N 06-J M M J S N 07-J M M J S N 08-J M M J S N 09-J M M J S N 10-J M M J S N 11-J M M J S N 12-J M M J S N 13-J M M J S N 14-J M M J S N Current$billions Year and month Retail Private Office Buildings Dec Data source: Reed Construction Data. Table: Reed Construction Data - CanaData. (12-month moving averages) Name of file: "RCD Starts FINAL (Dec 14) - Extra.xlsx" in "U.S. 2014" folder U.S. Road/Highway & Water/Sewage Construction Starts ‒ CMD Commercial $0.0 $1.0 $2.0 $3.0 $4.0 $5.0 05-J M M J S N 06-J M M J S N 07-J M M J S N 08-J M M J S N 09-J M M J S N 10-J M M J S N 11-J M M J S N 12-J M M J S N 13-J M M J S N 14-J M M J S N Current$billions Year and month Roads/Highways Water/Sewage Dec Data source: Reed Construction Data. Table: Reed Construction Data - CanaData. U.S. Commercial & Institutional Construction Starts ‒ CMD (12-month moving averages) Name of file: "RCD Starts FINAL (Dec 14) - Extra.xlsx" in "U.S. 2014" folder $4.0 $5.0 $6.0 $7.0 $8.0 $9.0 $10.0 05-J M M J S N 06-J M M J S N 07-J M M J S N 08-J M M J S N 09-J M M J S N 10-J M M J S N 11-J M M J S N 12-J M M J S N 13-J M M J S N 14-J M M J S N Current$billions Year and month Institutional Commercial Dec Data source: Reed Construction Data. Table: Reed Construction Data - CanaData. U.S. Hospital/Clinic & School/College Construction Starts ‒ CMD (12-month moving averages) Name of file: "RCD Starts FINAL (Dec 14) - Extra.xlsx" in "U.S. 2014" folder Retail Private Office Building $0.0 $1.0 $2.0 $3.0 $4.0 $5.0 $6.0 05-J M M J S N 06-J M M J S N 07-J M M J S N 08-J M M J S N 09-J M M J S N 10-J M M J S N 11-J M M J S N 12-J M M J S N 13-J M M J S N 14-J M M J S N Current$billions Year and month Schools/Colleges Hospitals/Clinics Dec Data source: Reed Construction Data. Table: Reed Construction Data - CanaData. (12-month moving averages) Name of file: "RCD Starts FINAL (Dec 14) - Extra.xlsx" in "U.S. 2014" folder U.S. Bridges & Miscellaneous Civil Construction Starts ‒ CMD Commercial $0.0 $0.5 $1.0 $1.5 $2.0 05-J M M J S N 06-J M M J S N 07-J M M J S N 08-J M M J S N 09-J M M J S N 10-J M M J S N 11-J M M J S N 12-J M M J S N 13-J M M J S N 14-J M M J S N Current$billions Year and month Bridges Miscellaneous civil (e.g., power plants, etc.) Dec
- 5. Construction Industry Snapshot ©2015 CMD. All Rights Reserved. 5 Source: CMD/Table: CMD. VALUE OF U.S. CONSTRUCTION STARTS – DECEMBER 2014 – CMD BILLIONS OF CURRENT $S, NOT SEASONALLY ADJUSTED (NSA) Jan-Dec, Jan-Dec, Oct 14 Nov 14 Dec 14 Oct 14 Nov 14 Dec 14 Oct 14 Nov 14 Dec 14 2013 2014 Single Family 10.128 10.460 10.646 9.874 10.118 10.411 9.793 9.887 9.956 114.268 119.477 month-over-month % change 3.7% 3.3% 1.8% 1.4% 2.5% 2.9% 0.7% 1.0% 0.7% year-over-year % change 9.0% 12.1% 8.5% 5.9% 8.3% 9.8% 6.2% 6.1% 4.6% 12.8% 4.6% Apartment 2.391 3.147 2.471 3.099 3.006 2.670 3.621 3.522 3.477 42.833 41.721 month-over-month % change -31.3% 31.6% -21.5% -9.4% -3.0% -11.2% -4.2% -2.7% -1.3% year-over-year % change -44.3% -27.4% -18.1% -24.8% -33.0% -31.2% 6.4% 0.2% -2.6% 39.0% -2.6% TOTAL RESIDENTIAL 12.519 13.607 13.117 12.974 13.124 13.081 13.414 13.409 13.433 157.101 161.198 month-over-month % change -5.5% 8.7% -3.6% -1.4% 1.2% -0.3% -0.7% 0.0% 0.2% year-over-year % change -7.9% -0.4% 2.2% -3.5% -5.1% -2.1% 6.2% 4.5% 2.6% 18.9% 2.6% Hotel/Motel 0.266 0.963 0.405 0.604 0.564 0.545 0.575 0.613 0.591 6.999 7.093 month-over-month % change -42.3% 261.4% -58.0% -13.6% -6.6% -3.4% -0.7% 6.6% -3.6% year-over-year % change -14.7% 88.8% -39.6% 6.9% 30.4% 9.5% -6.9% 1.6% 1.3% 13.8% 1.3% Retail 1.183 1.244 2.382 1.362 1.330 1.603 1.424 1.421 1.526 18.629 18.311 month-over-month % change -24.2% 5.2% 91.4% -13.2% -2.4% 20.6% -0.5% -0.2% 7.4% year-over-year % change -6.6% -2.3% 112.0% -21.3% -4.8% 31.2% -9.9% -9.6% -1.7% 42.0% -1.7% Parking Garages 0.134 0.214 0.198 0.172 0.155 0.182 0.140 0.147 0.150 1.987 1.799 month-over-month % change 14.1% 60.2% -7.7% -9.9% -9.8% 17.3% -1.6% 4.8% 2.1% year-over-year % change -16.9% 61.3% 22.6% -7.1% 17.7% 19.9% -15.4% -10.2% -9.4% 35.0% -9.4% Amusement 0.411 0.498 0.342 0.720 0.687 0.417 0.540 0.524 0.512 5.512 6.139 month-over-month % change -64.3% 21.1% -31.2% 0.6% -4.7% -39.3% -2.0% -3.0% -2.4% year-over-year % change -24.4% -27.9% -30.5% 47.0% 23.8% -27.5% 21.7% 13.4% 11.4% -6.8% 11.4% Office 1.577 0.928 1.170 1.049 1.148 1.225 1.338 1.230 1.179 15.089 14.149 month-over-month % change 67.8% -41.1% 26.0% 28.7% 9.5% 6.7% -0.8% -8.1% -4.1% year-over-year % change -7.9% -58.3% -34.3% -19.1% -34.9% -35.7% 21.8% 4.1% -6.2% -7.3% -6.2% Governmental Offices 1.084 0.863 0.709 1.026 1.019 0.886 0.881 0.900 0.901 9.529 10.807 month-over-month % change -2.2% -20.4% -17.8% 2.0% -0.7% -13.1% 2.8% 2.1% 0.1% year-over-year % change 36.9% 35.2% 1.3% 22.1% 31.5% 24.7% 11.1% 14.9% 13.4% 0.1% 13.4% Laboratories 0.062 0.185 0.121 0.110 0.116 0.123 0.240 0.197 0.198 1.738 2.376 month-over-month % change -37.4% 196.6% -34.5% 2.9% 4.8% 6.2% -3.7% -18.0% 0.4% year-over-year % change -63.8% -73.7% 8.5% 11.9% -63.6% -62.7% 168.2% 36.4% 36.7% 66.4% 36.7% Warehouse 0.464 0.435 0.418 0.817 0.635 0.439 0.578 0.576 0.573 4.152 6.874 month-over-month % change -54.0% -6.2% -4.0% 9.3% -22.2% -30.9% 2.6% -0.2% -0.6% year-over-year % change 59.3% -3.5% -9.0% 188.6% 76.4% 9.6% 73.8% 69.1% 65.6% -5.6% 65.6% Misc Commercial 1.143 1.101 2.213 1.627 0.944 1.486 0.987 0.959 1.079 14.313 12.944 month-over-month % change 94.5% -3.6% 101.0% 11.2% -42.0% 57.4% 5.2% -2.9% 12.5% year-over-year % change 106.7% -23.5% 184.5% 149.7% 5.4% 60.9% -12.7% -20.0% -9.6% 13.2% -9.6% TOTAL COMMERCIAL 6.325 6.433 7.958 7.487 6.597 6.905 6.704 6.567 6.708 77.948 80.490 month-over-month % change -10.1% 1.7% 23.7% 2.4% -11.9% 4.7% 0.7% -2.0% 2.1% year-over-year % change 9.0% -20.3% 26.8% 21.9% -0.5% 2.8% 7.2% 1.8% 3.3% 10.5% 3.3% TOTAL INDUSTRIAL (Manufacturing) 0.771 1.425 0.265 0.689 0.743 0.820 0.712 0.804 0.782 8.052 9.382 month-over-month % change 2270.7% 84.9% -81.4% 46.8% 7.8% 10.5% -4.3% 12.8% -2.7% year-over-year % change -33.2% 334.1% -49.8% -13.9% 23.8% 22.4% 5.3% 21.4% 16.5% 50.9% 16.5% Religious 0.111 0.083 0.101 0.116 0.111 0.099 0.129 0.119 0.116 1.723 1.387 month-over-month % change -18.8% -25.2% 21.3% -8.1% -4.7% -10.9% -3.0% -8.0% -2.8% year-over-year % change -30.2% -59.9% -28.5% -19.7% -34.6% -41.9% -8.6% -18.2% -19.5% -4.8% -19.5% Hosptials/Clinics 0.975 1.246 1.324 1.090 1.218 1.182 1.068 1.092 1.096 14.991 13.147 month-over-month % change -32.1% 27.9% 6.3% 14.8% 11.8% -3.0% -6.7% 2.3% 0.3% year-over-year % change -48.7% 31.1% 3.0% -18.7% -9.2% -14.3% -20.2% -14.9% -12.3% 4.9% -12.3% Nursing/Assisted Living 0.381 0.358 0.374 0.403 0.373 0.371 0.333 0.325 0.325 4.019 3.896 month-over-month % change -0.1% -5.9% 4.4% 8.1% -7.3% -0.6% -3.4% -2.3% -0.1% year-over-year % change -27.0% -20.5% -1.0% 6.2% -7.7% -17.6% 3.4% -2.4% -3.1% 11.9% -3.1% Libraries/Museums 0.121 0.094 0.182 0.218 0.142 0.132 0.196 0.191 0.186 2.224 2.237 month-over-month % change -42.8% -22.7% 94.8% 2.1% -34.9% -6.9% -10.7% -2.5% -2.4% year-over-year % change -69.9% -38.9% -23.2% -16.5% -43.0% -49.9% 9.3% 8.0% 0.6% -15.2% 0.6% Police/Courthouse/Prison 0.269 0.456 0.432 0.317 0.342 0.386 0.313 0.319 0.334 4.131 4.004 month-over-month % change -9.9% 69.4% -5.3% -6.7% 7.7% 13.0% -4.5% 2.2% 4.5% year-over-year % change -39.8% 22.1% 65.6% -16.1% -4.7% 7.0% -19.5% -11.4% -3.1% -19.3% -3.1% Military 0.731 1.240 0.149 0.909 0.918 0.706 0.647 0.704 0.695 4.942 8.340 month-over-month % change -6.9% 69.6% -88.0% -14.9% 1.0% -23.1% 1.7% 8.7% -1.2% year-over-year % change 21.0% 121.1% -41.1% 75.5% 61.6% 49.5% 57.2% 72.8% 68.8% -50.0% 68.8% Schools/Colleges 5.210 3.240 4.232 4.660 4.053 4.227 4.446 4.461 4.497 48.421 53.962 month-over-month % change 40.4% -37.8% 30.6% -0.5% -13.0% 4.3% 3.6% 0.4% 0.8% year-over-year % change 56.4% 6.2% 11.2% 16.6% 22.7% 24.5% 8.1% 9.3% 11.4% -6.1% 11.4% Misc Government 0.140 0.193 0.133 0.167 0.176 0.155 0.223 0.213 0.194 2.580 2.332 month-over-month % change -28.2% 37.7% -31.1% -3.9% 5.4% -11.8% -2.9% -4.6% -8.7% year-over-year % change -36.2% -38.7% -62.5% -0.6% -22.7% -47.6% 16.1% 3.1% -9.6% 9.7% -9.6% TOTAL INSTITUTIONAL 7.938 6.910 6.928 7.881 7.334 7.258 7.354 7.425 7.442 83.031 89.305 month-over-month % change 11.0% -12.9% 0.3% -0.6% -6.9% -1.0% 0.4% 1.0% 0.2% year-over-year % change 4.6% 14.0% 3.1% 9.7% 10.7% 6.9% 3.8% 6.1% 7.6% -9.0% 7.6% Misc Non Residential 0.280 0.425 0.322 0.322 0.340 0.342 0.306 0.321 0.325 3.258 3.899 month-over-month % change -10.8% 51.8% -24.2% -7.3% 5.4% 0.8% -0.4% 4.7% 1.3% year-over-year % change -5.2% 69.3% 17.7% 8.9% 23.6% 25.3% 13.2% 19.6% 19.7% 14.8% 19.7% TOTAL NON-RES BUILDING 15.314 15.193 15.474 16.379 15.013 15.327 15.076 15.117 15.256 172.289 183.077 month-over-month % change 5.4% -0.8% 1.8% 2.0% -8.3% 2.1% 0.3% 0.3% 0.9% year-over-year % change 3.2% 3.3% 12.2% 13.6% 6.3% 6.1% 5.5% 5.2% 6.3% 1.4% 6.3% Airports 0.331 0.325 0.045 0.425 0.351 0.234 0.274 0.276 0.274 2.851 3.285 month-over-month % change -16.5% -1.9% -86.1% -18.8% -17.4% -33.4% -2.6% 0.9% -0.9% year-over-year % change -20.7% 10.5% -38.5% 3.5% -3.9% -10.7% 25.1% 17.6% 15.2% 14.4% 15.2% Roads/Highways 3.913 3.339 3.504 4.495 3.866 3.585 3.901 3.917 3.937 41.194 47.239 month-over-month % change -10.0% -14.7% 5.0% -8.4% -14.0% -7.3% 1.6% 0.4% 0.5% year-over-year % change 22.7% 6.2% 7.3% 27.8% 24.2% 12.0% 14.4% 14.4% 14.7% 0.3% 14.7% Bridges 0.487 1.002 1.232 0.703 0.801 0.907 0.906 0.919 0.941 10.664 11.291 month-over-month % change -46.7% 105.7% 23.0% -16.1% 13.9% 13.2% -3.2% 1.5% 2.3% year-over-year % change -42.8% 19.0% 26.4% -23.7% -1.7% 2.0% 5.2% 6.0% 5.9% 15.2% 5.9% Dams/Marine 0.695 0.630 0.545 0.590 0.616 0.623 0.418 0.423 0.424 5.363 5.084 month-over-month % change 32.5% -9.3% -13.6% 33.9% 4.4% 1.1% 4.3% 1.4% 0.1% year-over-year % change 42.5% 12.4% 0.5% 24.5% 20.2% 17.6% -0.3% -2.4% -5.2% 59.1% -5.2% Water/Sewage 2.335 2.230 2.493 2.295 2.247 2.353 2.124 2.135 2.186 23.702 26.235 month-over-month % change 7.3% -4.5% 11.8% -0.7% -2.1% 4.7% 1.1% 0.5% 2.4% year-over-year % change 14.1% 5.9% 33.2% 2.4% 5.4% 17.1% 10.2% 8.6% 10.7% 5.0% 10.7% Misc Civil 1.112 1.785 1.601 1.452 1.464 1.499 1.605 1.552 1.531 17.933 18.377 month-over-month % change -25.6% 60.6% -10.3% -10.7% 0.8% 2.4% -0.5% -3.3% -1.3% year-over-year % change -8.2% -26.3% -13.3% -1.1% -15.8% -17.9% -3.0% 5.7% 2.5% -7.8% 2.5% TOTAL ENGINEERING 8.872 9.311 9.419 9.961 9.345 9.201 9.227 9.222 9.293 101.707 111.512 month-over-month % change -9.9% 4.9% 1.2% -6.4% -6.2% -1.5% 0.6% -0.1% 0.8% year-over-year % change 8.2% -0.6% 9.9% 10.3% 7.7% 5.6% 8.7% 9.9% 9.6% 3.6% 9.6% GRAND TOTAL 36.705 38.111 38.010 39.313 37.482 37.609 37.718 37.748 37.982 431.097 455.787 month-over-month % change -2.5% 3.8% -0.3% -1.4% -4.7% 0.3% 0.0% 0.1% 0.6% year-over-year % change 0.2% 1.0% 8.0% 6.5% 2.3% 3.0% 6.5% 6.0% 5.7% 7.7% 5.7% NON-RES BLDG + ENGINEERING 24.186 24.504 24.893 26.340 24.358 24.527 24.303 24.339 24.549 273.996 294.589 month-over-month % change -0.8% 1.3% 1.6% -1.4% -7.5% 0.7% 0.4% 0.1% 0.9% year-over-year % change 4.9% 1.8% 11.3% 12.3% 6.8% 5.9% 6.7% 6.9% 7.5% 2.2% 7.5% Data source: Reed Construction Data. Table: Reed Construction Data - CanaData. Name of file: "RCD Starts FINAL (Dec 14) - Extra.xlsx" in "U.S. 2014" folder Latest month actuals Year to Date. Value of U.S. Construction Starts - December 2014 - Reed Construction Data Billions of current $s, not seasonally adjusted (NSA) 3-months Moving averages (placed in end month) 12-months