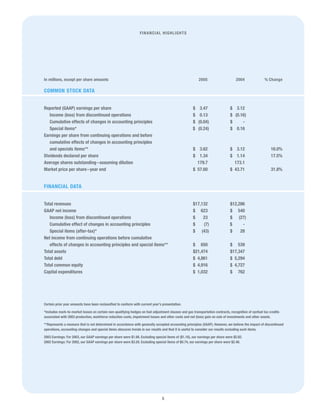
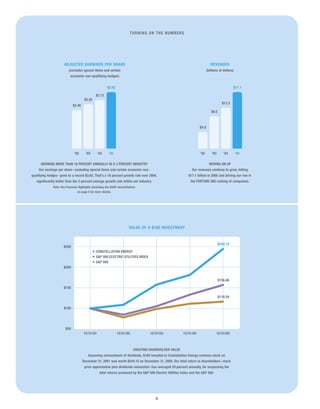
The 2005 annual report summarizes Constellation Energy's strong financial performance and strategic moves that positioned it for continued success. Record earnings per share of $3.62 in 2005 represented 16% growth over 2004. Total revenues reached $17.1 billion. The company also announced a merger with FPL Group that would make it the largest competitive energy supplier and second-largest utility in the US, positioning it as an "end-game player" in industry consolidation. Chairman Mayo Shattuck expressed confidence that the company's balanced business strategy would continue delivering superior returns for shareholders in the future.
DTE Energy reported first quarter 2003 earnings of $155 million, or $0.92 per share, compared to $200 million, or $1.24 per share in the first quarter of 2002. Operating earnings, which exclude non-recurring items, were $178 million, or $1.06 per share, comparable to operating earnings of $181 million, or $1.12 per share in the same period of 2002. The company's non-regulated businesses showed strong earnings growth, led by synthetic fuels and energy trading, which partially offset cost pressures at the regulated utilities. DTE Energy maintained its 2003 operating earnings guidance of $3.75-3.95 per share after adjusting for the sale of its transmission business
The 2001 Annual Report summarizes Anthem's performance in 2001. Key highlights include:
- Membership grew 10% to 7.9 million members, making Anthem the 5th largest publicly traded health plan.
- Anthem successfully completed its demutualization and IPO, becoming a publicly traded company.
- Financial results improved with operating revenue up 18% and operating gain up 74%.
- Anthem focused on growing enrollment, reducing costs, improving quality, and expanding specialty benefits.
- The report outlines Anthem's strategies and accomplishments across these areas that contributed to its growth, change and success in 2001.
This document brings together a set
of latest data points and publicly
available information relevant for
Retail & Consumer Goods Industry.
We are very excited to share this
content and believe that readers will
benefit from this periodic publication
immensely.
Calpine Corporation is a leading North American power company focused on serving wholesale and industrial customers with reliable and cost-competitive electricity. In 2002, Calpine successfully expanded its fleet of natural gas and geothermal power plants despite challenging market conditions, nearly doubling its capacity. While profits were lower than desired due to economic factors, Calpine maintained its strategic focus on integrity, liquidity, long-term vision, and earnings.
Celanese Corporation reported strong third quarter results, with net sales increasing 10% to $1.685 billion compared to the prior year. Operating profit more than doubled to $200 million, driven by increased volumes, higher margins, and lower charges. The company adjusted its full year earnings per share outlook to a range of $2.70 to $2.80 per share, towards the top end of its previous guidance. All business segments saw increased sales and profits compared to the third quarter of 2005.
Omnicom reported strong financial results for 2007, with revenue increasing 11.6% to $12.7 billion and net income growing 13% to $976 million. Diluted earnings per share rose 18% to $2.95. The company continued to invest in its businesses, adding capabilities and talent to better serve major clients globally. Omnicom agencies received numerous awards for creative excellence. Looking ahead, Omnicom is well positioned with a diversified portfolio to navigate potential economic challenges while continuing to deliver consistent long-term results.
RJ Reynolds posted solid financial results in 2008, with net income increasing 2.3% to $1.3 billion and EPS growing 3.2% to $4.57, demonstrating the company's strength even in a difficult economic environment. Key brands like Camel and Grizzly captured market share, and new innovative smokeless tobacco products like Camel Snus performed well. Reynolds American is well positioned for future challenges and opportunities with its total tobacco business model and range of tobacco products.
The letter discusses Southern Company's performance in 2006 and plans for the future. Key points include:
- Southern Company earned $2.12 per share in 2006, down slightly due to reduced synthetic fuel tax credits. Excluding this, earnings were $2.10 per share.
- The company increased its dividend for the 5th straight year and has paid dividends for 237 consecutive quarters.
- Southern Company is undertaking a $11 billion capital investment program over 3 years to upgrade infrastructure and comply with environmental regulations.
- Safety remains a top priority, and the company is making progress towards its goal of zero accidents.
David Ratcliffe will become President of Southern Company in April and Chairman and CEO in July, succeeding Allen Franklin who will retire after 34 years with the company. Ratcliffe praises Franklin's leadership and the consistent success Southern Company has achieved. He expresses confidence in the company's strategy and team to continue delivering solid long-term results and earnings growth of 5% annually. The transition will be seamless as Southern Company's strengths remain its focus on the Southeast region and balanced business portfolio.
DTE Energy reported strong third quarter 2006 earnings of $188 million compared to $4 million in third quarter 2005. Operating earnings, which exclude non-recurring items, were $255 million in third quarter 2006 compared to $5 million in third quarter 2005. All of DTE Energy's business segments experienced increased operating earnings except for Gas Utility which typically has a seasonal loss in the third quarter. DTE Energy tightened its full year 2006 operating earnings guidance excluding synthetic fuels to be between $2.42 to $2.53 per share.
PSEG Global announced plans to sell its ownership interests in SAESA Group, a major electric distribution and transmission company in Chile. SAESA Group serves over 2.6 million people across six distribution companies and has over 100 MW of generation capacity. PSEG engaged Credit Suisse to advise on the sale. Proceeds from the sale, along with other recent asset sales, will be used to redeem $200 million in bonds. The sale is expected to dilute earnings in the near term but strengthen PSEG's financial position overall.
The document is TXU's 2003 annual report which provides an overview of the company's operations and progress over the past year. It discusses TXU's business segments including TXU Energy, Oncor, and TXU Australia. The report highlights that in 2003, TXU delivered on its financial plan by achieving earnings per share of $2.03, generating $2.8 billion in cash from operations, and increasing production across its business segments.
The document compares the pay of two CEOs, one who increased profits significantly but took an 81% pay rise to £23m, while the other reversed losses, reduced debt, but took a 60% pay cut to £1.4m. It also analyzes executive pay trends in the food and drink sector, finding that CEO pay has increased substantially over the past 20 years while average worker pay has remained stagnant, leading to criticism of high executive pay packages.
The annual report summarizes Energy East's financial performance in 2005. Earnings per share increased 11% to $1.75 compared to 2004. The company plans to invest nearly $2 billion over the next five years to maintain reliable energy delivery infrastructure, with a focus on improving electric transmission grids. Regulatory proceedings in New York could significantly impact Energy East's utility operations and future earnings, as regulators may eliminate utility-provided electric supply options for customers.
This document contains the prepared remarks and Q&A from Duke Energy Corporation's earnings conference call for the second quarter of 2006. Key points:
- Duke Energy reported ongoing EPS of $0.43 compared to consensus of $0.38.
- Financial results were impacted by mild weather, lower bulk power sales, and purchase accounting charges from the Cinergy merger.
- The company achieved several strategic objectives in the quarter including closing the Cinergy merger early and announcing the sale of the Commercial Marketing and Trading business.
- While some business units are performing ahead of plan, overall the company is on track to achieve its $1.90 EPS target for 2006.
Kohl's opened 28 new stores in Southern California in March 2003, establishing a major presence on the West Coast and becoming a national retailer. The expansion was the result of extensive preparation over the past two years, including hiring store management teams in 2002, researching the local market to develop an appropriate merchandise mix, and opening a new distribution center in San Bernardino in late 2002 to support the region. The successful opening of 28 stores simultaneously demonstrated Kohl's disciplined approach to expansion and ability to consistently execute its strategies.
Oshkosh Corporation held an earnings conference call to discuss its first quarter fiscal year 2008 results. Sales increased 49% to $1.5 billion due to strong growth in access equipment and defense, while earnings per share declined 9.1% to $0.50. For fiscal year 2008, the company estimates revenue of $7.1-7.3 billion, operating income of $675-700 million, and earnings per share of $4.15-4.35. Challenging economic conditions are impacting commercial and fire & emergency segments, but global initiatives and cost reductions will support the full-year outlook.
This document provides an overview and summary of American Electric Power's (AEP) 2014 Corporate Accountability Report. It discusses AEP's business structure, corporate governance, strategy for growth including capital investment and transmission expansion. It summarizes AEP's 2013 financial and operational performance, including safety, environmental, reliability and workforce initiatives. It also outlines challenges facing AEP such as EPA regulations and capacity market issues, and AEP's efforts to address these challenges through policy engagement and grid security investments.
This annual report provides key financial highlights for Omnicom for the years 2002-2006. Some key details include:
- Revenue grew from $7.5 billion in 2003 to $11.4 billion in 2006, a CAGR of 10.6% over the five year period.
- Net income increased from $570.5 million in 2003 to $864 million in 2006, a CAGR of 9.9% over five years.
- Earnings per share grew from $3.07 in 2002 to $4.99 in 2006, an 11.3% CAGR.
- Omnicom's agency networks placed first, second and third in the Gunn Report for
Gibson Energy is recommended as a Buy based on its commitment to growth through $700M in capital expenditures, ability to provide continued shareholder value through increasing dividends, and strong liquidity position to withstand depressed oil prices. Valuation analyses using comparable companies and a discounted cash flow model imply the share price is undervalued at current levels. However, risks include continued weakness in commodity prices and environmental concerns potentially limiting future growth opportunities.
This document brings together a set of latest data points and publicly available information relevant for Utilities Industry. We are very excited to share this content and believe that readers will benefit from this periodic publication immensely.
Acro Energy Technologies is a leading renewable energy solutions provider that has sold and installed over 2,000 solar energy systems. It is helping consumers reduce power costs by engineering, installing, and financing renewable energy systems. Acro has experienced strong growth and is led by an experienced management team with a track record of success in renewable energy and mergers and acquisitions. The company aims to continue growing organically and through acquisitions to become the largest downstream renewable energy company in the US.
1. Constellation Energy's 2003 annual report summarizes the company's performance and strategic vision.
2. The company grew significantly in 2003, with revenues reaching almost $10 billion and total shareholder return of 45%.
3. Constellation Energy serves over 8,000 megawatts of peak load in wholesale energy markets across North America and has expanded its customer base.
Constellation Energy Group reported strong financial results in 2002 despite challenges in the energy sector. Earnings per share grew to $3.20 compared to $0.57 in 2001, though some of the growth came from special items like asset sales. Excluding special items, earnings still grew 4.6% to $2.52 per share. The company sharpened its focus on core businesses of generating and selling energy by selling $708 million in non-core assets. It also strengthened its balance sheet through debt refinancing, allowing it to be well positioned for future growth in a challenging environment.
Who is the social consumer and how did the 'social' behaviour affect organisations? How does the 'social shift' affect local government organisations?
This presentation was delivered by James Leavesley - CEO of CrowdControlHQ, to the LGComms meeting on the 8th of March 2012
1) AEP faces significant challenges transforming its business due to stricter environmental regulations, a shifting energy landscape, and economic pressures.
2) AEP is developing a transition plan to address grid reliability, customer costs, job creation, and a more diverse fuel portfolio in response to these changes.
3) AEP supports rational environmental regulation but is concerned about the affordability and timeline of EPA rules, which could prematurely retire some coal plants and significantly increase costs passed to customers. AEP hopes the EPA will consider feedback calling for a more flexible approach.
The 2007 Summary Annual Report provides an overview of AmerisourceBergen Corporation for the year. AmerisourceBergen is one of the largest pharmaceutical distribution companies in the world, serving healthcare providers and pharmaceutical manufacturers in the US and Canada. The report discusses the company's financial performance, operations, services provided across the pharmaceutical supply chain, and goals of reducing costs and improving patient outcomes. It also provides brief letters from the President/CEO and Chairman of the Board, as well as financial statements and corporate information.
Aetna's 2003 annual report summarizes the company's financial and operational performance over the past year. Key highlights include:
1) Aetna achieved strong financial results in 2003, with full-year operating earnings of $5.18 per share, more than double the previous year. The company also reduced expenses by $194 million while improving customer satisfaction.
2) Aetna launched new products and services to support consumer-directed health plans and integrated benefits. The company also enhanced online tools for plan sponsors and members.
3) Aetna made progress in quality initiatives like disease management programs and worked to strengthen relationships with physicians and dentists through agreements settling lawsuits.
4) Looking ahead
credit-suisse Credit Suisse First Boston Foundation Social Responsibility Rep...QuarterlyEarningsReports2
1) Over 400 CSFB employees volunteered with Habitat for Humanity to help build a home for the Swaby family in Brooklyn over the past year. This helped foster teamwork and collaboration across divisions at CSFB.
2) CSFB employees have also volunteered with Habitat for Humanity in London to help build homes for low-income families in Southwark and Tower Hamlets, donating sweat equity and technical expertise.
3) CSFB is a major supporter of Habitat for Humanity globally and locally in New York and London, providing grants, volunteers, and leadership to help build over 100,000 homes for families worldwide.
At the request of Canadian-American Security Review (www.casr.ca), we prepared an analysis of what might follow the demise of the demise of the US Army’s Future Combat System (FCS) program, and what relevance that might have for the Canadian Army.
In our estimation, the final end of the FCS has certainly opened opportunities for far more practical plans for armored vehicle modernization, as the US Army has replaced its formerly all-encompassing and over-reaching approach with a vector of perhaps ten separate efforts to update, extend, and recapitalize its fleet. For Canadian purposes, the large sums being invested in even these more modest efforts may be particularly useful beyond just American needs. In particular, upgrades to the Stryker, and development of so many designs for the MRAP All Terrain Vehicle (M-ATV) and Joint Light Tactical Vehicle (JLTV) programs, may be very valuable to two specific Canadian Army vehicle initiatives: LAV-III modernization and the Tactical Armored Patrol Vehicle (TAPV).
In the last several pages, we comment on the implications for the industry, and offer advice to the Canadian Department of National Defence on how to manage its limited equipment acquisition budget and staff.
HCA's 2003 annual report discusses developments that positioned the company for future growth. Key points include:
1) HCA invested over $1.8 billion to update its existing facilities with new technology and increase capacity.
2) The acquisition of Health Midwest expanded HCA's presence in the Kansas City market.
3) HCA invested $130 million to improve its revenue management and supply chain operations by consolidating them into regional centers.
4) New patient safety technologies like barcoded medication administration were deployed across HCA hospitals.
The Social Media Phenomenon: How to leverage it to best effectClayton Wehner
Presentation to Deakin University Alumni in Adelaide at the National Wine Centre, Monday 12 September 2010.
Presentation provides an overview of social media, discussion of the various social media tools, and 23 principles for social media success
2013 Annual Report - The Arc of MonmouthBrett Colby
The annual report summarizes the achievements of The Arc of Monmouth in fiscal year 2013, highlighting the support provided to over 1,300 individuals through various departments and programs. Key achievements include the first graduating class of the Kach program providing a college experience for individuals with disabilities, the new Achievement Zone transition program, and the opening of the Wayside Oaks residential facility providing affordable housing. The report provides an overview of the employment services, individual and family supports, adult services, health services, and residential services provided by The Arc of Monmouth.
Risks of social media for businesses (and how to manage them)CrowdControlHQ
In a meeting with Security specialists held at the University of Loughborough we discussed the risks of social media and how they can be managed. This is our contribution to the topic.
Investment banking project on Bank of America -Merrill LynchPankaj Gaurav
• Working model to serve the client
• Integrated operating model
• Lines of businesses
• Activities in global commercial banking
• Investment banking activities
• Details of advisory services in recent Deal in M&A, IPO issue
This document discusses discrimination faced by the LGBT community and efforts to promote equality. It provides statistics showing high rates of bullying, family rejection, and mental health issues among LGBT youth. It outlines types of discrimination like abuse and unfair treatment. The document also summarizes how Section 15 of the Canadian constitution protects against LGBT discrimination, especially in workplaces and schools. It stresses the importance of education to promote understanding and acceptance of LGBT individuals.
F101 - Behaviors, Configuration, and RuntimeJosh Arnold
I’m going to drill our entire architecture into your head. I’ll explain this magic BehaviorGraph and Behavior idea that we always talk. By the end of this, you should understand what makes FubuMVC different.
The document discusses WWF Netherlands' strategies for online engagement and fundraising. It identifies 6 key insights: (1) everyone can be an ambassador; (2) relevance, closeness and trust are important; (3) different levels of engagement are wanted; (4) social media activation and friending; (5) listening to supporters and facilitating ambassadors; (6) engaging where supporters congregate online. The strategies outlined include listening to supporters, informing them, encouraging participation, facilitating ambassadors, and organizing internally to coordinate social media efforts. The goal is to better engage the over 1 million supporters through online communities.
The document announces a vernal pool monitoring workshop to be held at West Geauga Middle School on March 7, 2009. It provides an agenda for the workshop which will include presentations on the Ohio Environmental Council's vernal pool program, vernal pools in the context of development, how to construct and monitor vernal pools, and a field trip. It also lists organizations sponsoring or participating in the workshop and gives an overview of the Ohio Environmental Council's water program and efforts to monitor and protect vernal pools in Ohio.
The document discusses a reef cleanup effort in Pattaya, Thailand on September 25th, 2010. It mentions taking a bus and boat ride out to an island for the cleanup project and shows a photo of someone named Mathieu relaxing with Calvin and Hobbes during the boat trip to the cleanup site.
David Ratcliffe, Chairman and CEO of Southern Company, summarizes the company's performance in 2005. While challenges arose like Hurricane Katrina, Southern Company exceeded its financial targets and continued excellent customer satisfaction and reliability. The company increased its dividend for the 4th straight year and saw share price gains. Looking ahead, Ratcliffe emphasizes continuing the company's clear strategy and focus on safety and values like trust and commitment through its Southern Style program.
The document summarizes Integrys Energy Group's fourth quarter 2008 earnings conference call. Key points include:
- Integrys reported $25.6 million in income available for common shareholders for Q4 2008, down from $85.1 million in Q4 2007, largely due to non-cash accounting losses at Integrys Energy Services.
- In response to the economic downturn, Integrys plans to substantially scale back or exit its nonregulated energy services business, reduce capital expenditures at its regulated utilities by 30-40% in 2009-2010, and lower its long-term EPS growth target from 6-8% to 4-6%.
- Integrys also updated its liquidity
The document is the annual report for Energy East Corporation for the year 2004. It provides the following key information:
- Energy East saw increases in earnings per share and dividends paid to shareholders in 2004 compared to 2003.
- The company realized cost savings from consolidation efforts and improved its corporate governance practices.
- Regulatory agreements for the company's utilities, including multi-year rate plans, were important for providing stable rates and earnings. A new rate agreement for Rochester Gas & Electric was approved in 2004.
- The company continued investing in infrastructure projects while exiting non-core businesses, including the sale of a nuclear power plant. Management focused on efficient operations and regulatory certainty going forward.
The document is the annual report for Energy East Corporation for the year 2004. It provides the following key information:
- Energy East achieved 8% growth in both basic and diluted earnings per share compared to 2003. It also increased its common stock dividend by 6%.
- The company realized cost savings through consolidation efforts and received improved credit ratings after selling its Ginna nuclear power plant.
- Regulatory agreements for Energy East's utilities, including Rochester Gas & Electric and Central Maine Power, provided stable rates for customers through 2008 while allowing the company to recover costs and earn a fair return.
The document is the 2005 annual report and proxy statement from PHI (Pepco Holdings Inc.). It discusses PHI's strategy of focusing on stable power delivery and growing energy businesses. In 2005, PHI achieved earnings of $371.2 million and strengthened its balance sheet by paying down over $1 billion in debt. Rising energy prices present challenges for PHI and its customers. The proxy statement announces the annual meeting to elect directors and ratify the independent auditor.
This document summarizes Duke Energy's and Cinergy's first quarter 2006 earnings conference call. David Hauser, Duke Energy's CFO, discussed the financial results of both companies. For Duke Energy, earnings per share were $0.48, up from the prior year. Segment EBIT increased across most business units due to factors like customer and volume growth. For Cinergy, ongoing earnings per share were $0.62, up slightly from the prior year, while reported earnings were $0.39 due to merger costs. Hauser provided an overview of key financial metrics and outlook for both companies.
fpl group library.corporate-4Q08%20 Script_FINAL%20_APfinance17
FPL Group held a conference call to discuss its financial results for the fourth quarter and full year of 2008. The call began with introductions from senior management. Lew Hay, the CEO, then provided an overview of FPL Group's performance in 2008, highlighting record adjusted earnings of over $1.5 billion. Armando Pimentel, the CFO, discussed the financial results in more detail, noting lower than expected earnings for Florida Power & Light due to the economic downturn. Pimentel provided analysis of FPL's customer growth, usage, and other key operating metrics for the quarter and year.
air products & chemicals fy 08 q2 earningsfinance26
- Air Products reported a 40% increase in quarterly EPS to $1.43 per share and a 38% increase in net income to $314 million for its fiscal second quarter.
- Revenues increased 13% to $2.6 billion due to higher volumes in Tonnage Gases and Electronics and Performance Materials as well as higher pricing in Merchant Gases.
- Based on strong first half performance, Air Products raised its full year EPS guidance to a range of $4.95 to $5.05 per share, representing 18-20% annual growth.
This document is FirstEnergy's 2006 annual report. It summarizes the company's strong financial and operational performance in 2006, including record earnings per share of $3.84. Operationally, FirstEnergy achieved record electricity generation of 82 million megawatt-hours and industry-leading safety and transmission system performance. The company invested $1.2 billion in its generation, transmission, and distribution assets to increase capacity and reliability. FirstEnergy also continued initiatives to enhance customer service and the environmental profile of its diversified generation fleet.
Calpine Corporation is a leading North American power company that generated $7.4 billion in revenue in 2002. While the power industry faced turmoil that year with a weak economy and low electricity prices, Calpine expanded its fleet of natural gas and geothermal power plants, increasing capacity by nearly 100% and generation by 71%. Calpine also raised over $3 billion in financing despite tight capital markets. The company reported recurring net income of $309 million for 2002.
Ball Corporation is a leading provider of metal and plastic packaging for beverages and foods. In 2001, Ball reported a net loss of $1.85 per share due to business consolidation charges, but excluding these charges earnings were $1.78 per share. Ball took actions to improve its packaging operations in China and North America to better position them for the future. Ball also expects solid performance in 2002 and beyond as it builds on its strengths of quality, customer relationships, and creative employees.
This document is Ball Corporation's 2001 annual report. It provides an overview of Ball Corporation, including that it is a leading provider of metal and plastic packaging for beverages and foods, as well as aerospace technologies. It discusses Ball's vision, mission, and strategy. The report notes challenges in 2001 from rising costs but performance was still slightly below 2000 levels when excluding charges. It describes actions taken to improve Ball's packaging and aerospace operations and position them for future growth.
The 2006 annual report of PPL Corporation provides an overview of the company's business and financial performance in 2006. PPL controls over 11,000 megawatts of electricity generating capacity in key U.S. markets and provides electricity delivery services to over 5 million customers. The report discusses PPL's strategy for continued growth, including expanding its wholesale energy marketing business, increasing generating capacity, potential acquisitions of power plants, and exploring new plant construction. The Chairman expresses optimism that PPL is well-positioned for future growth and success in both regulated and deregulated electricity markets.
air products & chemicals Q4 FY 08 earningsfinance26
- Air Products reported fiscal Q4 EPS from continuing operations of $1.26, up 10% from $1.15 in the prior year on an adjusted basis. Fiscal year 2008 sales increased 14% to $10.4 billion and income from continuing operations grew 16% to $1.1 billion.
- For fiscal year 2009, Air Products expects EPS to be in the range of $5.10 to $5.35, representing year-over-year earnings growth on a continuing operations basis of 1% to 6%.
[1] The chairman reports that while 2001 presented challenges from mild weather and a weak economy, the company delivered solid financial results including $1.12 billion in net income and 6.6% growth in earnings per share.
[2] Key accomplishments in 2001 that positioned the company for continued success included focusing on their Southeast region after the Mirant spinoff, concluding major rate reviews with regulators, and strengthening executive management.
[3] Going forward, the company will continue concentrating on their regulated utilities in the Southeast and growing their competitive generation business, which produces reliable returns. The outlook for 2002 and beyond remains excellent due to the company's strong fundamentals and focus on shareholders and customers.
public serviceenterprise group Investor 06//17/06finance20
PSEG Global announced the sale of its SAESA Group in Chile to a consortium formed by Morgan Stanley Infrastructure and the Ontario Teachers' Pension Plan for a base equity value of approximately $870 million. The sale is expected to generate an after-tax gain of $170-180 million for PSEG in 2008. PSEG Global's remaining international assets consist of small investments in electric generation plants in Italy, India and Venezuela.
Air Products reported a 15% increase in net income and 16% increase in diluted EPS for its fiscal first quarter ended December 31, 2007 compared to the prior year. Revenues increased 9% to $2.47 billion due to higher volumes, improved pricing, and a weaker dollar. Operating income increased 17% to $372 million. For the full fiscal year, Air Products raised its EPS guidance from $4.80-$5.00 to $4.85-$5.00 due to strong first quarter performance and expectations of continued solid demand and high bidding activity.
View Summary Manpower Inc. Withdraws Fourth Quarter 2008 Guidance 12/22/2008finance12
Manpower Inc. withdrew its fourth quarter 2008 guidance due to continued declines in the global labor markets and changes in foreign currencies. The company experienced a 20% revenue decline in the two months ended November 30, 2008 compared to the prior year. As a result of the weaker operating environment, Manpower Inc. will take restructuring charges related to employee severance and office closures in the fourth quarter. Despite the economic challenges, the company's liquidity and financial strength remains strong with $675 million in cash and $182 million in net debt as of the end of November.
The document is the 1999 annual report of Manpower Inc. It discusses the company's financial highlights for 1999, including increased systemwide sales, revenues, and operating margin compared to previous years. It summarizes the company's strategies to focus on providing workforce solutions, investing in technology, improving efficiency, and expanding in professional and specialty staffing. The report discusses how these strategies helped drive growth while improving profitability in 1999.
Manpower provided staffing solutions for a variety of clients around the world in 2000. Some key examples include:
1) Manpower Venezuela used a performance-based compensation model to win staffing contracts for three call centers in Venezuela.
2) In Australia, the Defense Force outsourced its military recruitment to Manpower due to their ability to provide a full-service solution.
3) In North Carolina, Manpower's workforce program helped IBM achieve significant contractor staffing cost savings.
This document highlights Manpower's global reach and ability to customize staffing solutions to meet the diverse needs of clients around the world.
The document is Manpower Inc.'s 2001 annual report. It summarizes that in 2001:
- Systemwide sales decreased 5.3% to $11.8 billion due to a weaker global economy and strengthening US dollar.
- Revenues decreased 3.3% and operating profit declined 23.6% as revenue growth slowed but investments continued.
- Earnings per share decreased 27% to $1.62 primarily due to currency exchange impacts. The company remained focused on providing skilled employees and workforce solutions to customers during economic uncertainty.
The document discusses Manpower's performance and strategies during a period of economic uncertainty in 2002. It summarizes that Manpower strengthened its financial position, improved efficiency, expanded services, and increased customer relationships despite challenging market conditions. Manpower emerged stronger and confident in its leadership position. The speed of work increased pressure on companies, but Manpower provided flexibility and quality service to help customers.
This document contains a long list of place names from around the world arranged in no clear order. The places span multiple continents and countries, including locations in France, Italy, Germany, Japan, Canada, Mexico, Argentina and many others.
The document is Manpower Inc.'s 2004 annual report. It discusses Manpower's 57-year history of providing temporary staffing solutions and how it has expanded its services over time. It also discusses how the world of work is constantly changing and how Manpower continues to adapt its solutions to help clients with their HR strategies and market competition. The report features perspectives from clients, including IBM's vice president of global talent discussing how IBM partners with Manpower for just-in-time talent management to source skills globally on demand.
This document is Manpower Inc.'s 2005 annual report. It summarizes the company's financial performance for 2005, noting revenues exceeded $16 billion, a 7.7% increase over 2004. Net income increased 8% to $260 million. It also discusses strategic moves taken in 2005 to expand operations in emerging markets like China and India. Finally, it describes the company's rebranding effort, launching a new logo and tagline - "What do you do?" - to reflect its expanded services beyond temporary staffing.
Manpower Inc. reported record financial results in 2006. Revenues increased 10.8% to $17.6 billion and net earnings increased 53% to $398 million. The company's stock price rose 61% in 2006, outperforming the broader market. Operating profit increased 24% to $532 million due to growth in business and effective cost management across regions. The company has transitioned to focus on providing a wider range of employment services beyond temporary staffing alone. The rebranding launched in 2006 aligned the company's image with this strategic transition and positioned Manpower for continued strong performance.
Manpower Inc. had record revenues and earnings in 2007. Revenues increased 17% to $20.5 billion while net earnings grew 22% to $484.7 million. The company has diversified its services over the past decade to include specialty services beyond temporary staffing, such as permanent recruitment and leadership development. This has improved profit margins and reduced sensitivity to economic cycles. Investments in new services like recruitment process outsourcing have positioned Manpower for continued growth.
The document is a Form 8-K filed by The Goodyear Tire & Rubber Company with the SEC on May 22, 2007. It announces that the company entered into an underwriting agreement to sell over 22 million shares of its common stock in a public offering at $33 per share, for total proceeds of over $750 million. The underwriters exercised their option to purchase additional shares. The company's general counsel issued a legality opinion on the shares offering. The proceeds will be used for general corporate purposes.
The Goodyear Tire & Rubber Company issued notices to partially redeem outstanding notes. It will redeem $140 million of its 9% Senior Notes due 2015 at 109% of par value, and $175 million of its 8.625% Senior Notes due 2011 at 108.625% of par value. Both redemptions will occur on June 29, 2007. Goodyear is using proceeds from a recent equity offering of common stock to fund the redemptions, as allowed under provisions permitting redemption of up to 35% of notes with equity offering proceeds.
Abhay Bhutada, the Managing Director of Poonawalla Fincorp Limited, is an accomplished leader with over 15 years of experience in commercial and retail lending. A Qualified Chartered Accountant, he has been pivotal in leveraging technology to enhance financial services. Starting his career at Bank of India, he later founded TAB Capital Limited and co-founded Poonawalla Finance Private Limited, emphasizing digital lending. Under his leadership, Poonawalla Fincorp achieved a 'AAA' credit rating, integrating acquisitions and emphasizing corporate governance. Actively involved in industry forums and CSR initiatives, Abhay has been recognized with awards like "Young Entrepreneur of India 2017" and "40 under 40 Most Influential Leader for 2020-21." Personally, he values mindfulness, enjoys gardening, yoga, and sees every day as an opportunity for growth and improvement.
Seminar: Gender Board Diversity through Ownership NetworksGRAPE
Seminar on gender diversity spillovers through ownership networks at FAME|GRAPE. Presenting novel research. Studies in economics and management using econometrics methods.
STREETONOMICS: Exploring the Uncharted Territories of Informal Markets throug...sameer shah
Delve into the world of STREETONOMICS, where a team of 7 enthusiasts embarks on a journey to understand unorganized markets. By engaging with a coffee street vendor and crafting questionnaires, this project uncovers valuable insights into consumer behavior and market dynamics in informal settings."
how to sell pi coins effectively (from 50 - 100k pi)DOT TECH
Anywhere in the world, including Africa, America, and Europe, you can sell Pi Network Coins online and receive cash through online payment options.
Pi has not yet been launched on any exchange because we are currently using the confined Mainnet. The planned launch date for Pi is June 28, 2026.
Reselling to investors who want to hold until the mainnet launch in 2026 is currently the sole way to sell.
Consequently, right now. All you need to do is select the right pi network provider.
Who is a pi merchant?
An individual who buys coins from miners on the pi network and resells them to investors hoping to hang onto them until the mainnet is launched is known as a pi merchant.
debuts.
I'll provide you the what'sapp number.
+12349014282
Abhay Bhutada Leads Poonawalla Fincorp To Record Low NPA And Unprecedented Gr...Vighnesh Shashtri
Under the leadership of Abhay Bhutada, Poonawalla Fincorp has achieved record-low Non-Performing Assets (NPA) and witnessed unprecedented growth. Bhutada's strategic vision and effective management have significantly enhanced the company's financial health, showcasing a robust performance in the financial sector. This achievement underscores the company's resilience and ability to thrive in a competitive market, setting a new benchmark for operational excellence in the industry.
What price will pi network be listed on exchangesDOT TECH
The rate at which pi will be listed is practically unknown. But due to speculations surrounding it the predicted rate is tends to be from 30$ — 50$.
So if you are interested in selling your pi network coins at a high rate tho. Or you can't wait till the mainnet launch in 2026. You can easily trade your pi coins with a merchant.
A merchant is someone who buys pi coins from miners and resell them to Investors looking forward to hold massive quantities till mainnet launch.
I will leave the what's app number of my personal pi vendor to trade with.
+12349014282
"Does Foreign Direct Investment Negatively Affect Preservation of Culture in the Global South? Case Studies in Thailand and Cambodia."
Do elements of globalization, such as Foreign Direct Investment (FDI), negatively affect the ability of countries in the Global South to preserve their culture? This research aims to answer this question by employing a cross-sectional comparative case study analysis utilizing methods of difference. Thailand and Cambodia are compared as they are in the same region and have a similar culture. The metric of difference between Thailand and Cambodia is their ability to preserve their culture. This ability is operationalized by their respective attitudes towards FDI; Thailand imposes stringent regulations and limitations on FDI while Cambodia does not hesitate to accept most FDI and imposes fewer limitations. The evidence from this study suggests that FDI from globally influential countries with high gross domestic products (GDPs) (e.g. China, U.S.) challenges the ability of countries with lower GDPs (e.g. Cambodia) to protect their culture. Furthermore, the ability, or lack thereof, of the receiving countries to protect their culture is amplified by the existence and implementation of restrictive FDI policies imposed by their governments.
My study abroad in Bali, Indonesia, inspired this research topic as I noticed how globalization is changing the culture of its people. I learned their language and way of life which helped me understand the beauty and importance of cultural preservation. I believe we could all benefit from learning new perspectives as they could help us ideate solutions to contemporary issues and empathize with others.
5 Tips for Creating Standard Financial ReportsEasyReports
Well-crafted financial reports serve as vital tools for decision-making and transparency within an organization. By following the undermentioned tips, you can create standardized financial reports that effectively communicate your company's financial health and performance to stakeholders.
where can I find a legit pi merchant onlineDOT TECH
Yes. This is very easy what you need is a recommendation from someone who has successfully traded pi coins before with a merchant.
Who is a pi merchant?
A pi merchant is someone who buys pi network coins and resell them to Investors looking forward to hold thousands of pi coins before the open mainnet.
I will leave the what'sapp contact of my personal pi merchant to trade with
+12349014282
2. Elemental Economics - Mineral demand.pdfNeal Brewster
After this second you should be able to: Explain the main determinants of demand for any mineral product, and their relative importance; recognise and explain how demand for any product is likely to change with economic activity; recognise and explain the roles of technology and relative prices in influencing demand; be able to explain the differences between the rates of growth of demand for different products.
2. IN INNOVATIVE WAYS
Everything we do is about providing the energy to turn on life. From night lights to
cityscapes, from assembly lines to shopping malls, from business to pleasure, our
energy is there. We do it with a proven strategy, progressive energy solutions, superior
risk management, wise investments, cleaner energy and passionate employees. We’re
also getting bigger and better – working to become a company that combines unmatched
financial strength with the fastest growth rate in our industry.
3. BY BEING THE BEST AT WHAT WE DO
Our goal is to be the premier energy company in North America. We generate, transmit and
deliver energy, help customers manage energy costs and usage, buy and manage fuels for
other power generators, and excel at serving customers all along the energy value chain.
We know the way energy works, and that’s how We Turn It On.
1
5. LETTER TO SHAREHOLDERS
CONSTELLATION ENERGY HAS TURNED IT ON.
In 2005, our performance reached new heights. We reported record-setting results and made significant strategic strides–
including our pending merger with FPL Group – that represent both the culmination of years of hard work and the beginning of
an exciting new chapter in our long and distinguished history.
We’ve maintained our position as the leader in competitive energy markets, continually increased productivity and
reduced our costs, and consistently achieved earnings growth that ranks among the best in our industry–all of which have
enabled us to deliver superior total returns to our shareholders. That’s what I call turning it on.
Our earnings per share in 2005 – excluding special items and certain economic hedges that do not qualify for hedge
accounting – were a record $3.62. That’s a 16 percent growth rate over our 2004 adjusted earnings. Between late 2001–when
our current management team came together and developed and implemented our business model–and December 2005, our
stock price appreciated 159 percent. During the same time, assuming reinvestment of dividends, our average annual return to
shareholders was 29 percent.
We also continue to deliver on our promises. Our commitment to shareholders has included increasing dividends
approximately in-line with our earnings growth. In January 2006, we announced a quarterly dividend increase of nearly
13 percent – from 33.5 cents per share to 37.75 cents per share, equivalent to a new annual rate of $1.51 per share. And with our
fourth quarter 2005 financial results, we have met or exceeded our earnings guidance for 17 consecutive quarters.
RIGHT CHOICES. RIGHT RESULTS.
In late 2001, when the energy industry was in a state of flux, we made a crucial strategic decision that has led to our current suc-
cess. While others were retreating from competitive markets, we decided to aggressively move forward, creating an unmatched
combination of portfolio and risk management expertise, outstanding customer focus and advanced logistical capabilities. Our
strategy has gained us significant opportunities and made us a leader all along the energy value chain–from the mouth of the
mine to the light switch and everywhere in between.
Today, we are the No. 1 provider of competitive energy in wholesale and retail markets in North America. Our wholesale
marketing and risk management operation has built a truly diversified platform across three commodities: power, natural gas
and coal. Last year, our Commodities Group added an integrated natural gas platform that far exceeded growth expectations. And
our international coal business is establishing itself as a growing player, delivering more than 12 million tons of coal in 2005 to
our own fleet, as well as to customers in the United States, Europe and the Far East.
Meanwhile, our retail competitive supply business, Constellation NewEnergy, continues to strengthen its position as the
largest supplier of electricity to commercial and industrial customers in North America, including more than two-thirds of the
FORTUNE 100 companies.
Baltimore Gas and Electric, our regulated utility in Central Maryland, has a strong track record in customer service, scoring
in the top quartile in all three J.D. Power surveys. In addition, BGE’s focus on keeping costs low once again placed it in the top
decile of comparable utilities and contributed significantly to our overall earnings. As I write this letter, we are continuing to
work diligently with Governor Ehrlich and Maryland officials to ease the transition to market-based electric rates, which are
scheduled to take effect July 1, 2006. Although rising prices for the coal, oil and natural gas needed to produce electricity have
sent energy costs soaring, residential electricity rates in Maryland have been frozen for six years at 6.5 percent below 1993
levels. No utility, including BGE, can afford to buy power at 2006 prices and collect payment at below 1993 levels. Still, our goal
is to make any electric rate increase as manageable as possible for our customers, while also providing BGE with the resources
it needs to invest in its infrastructure and maintain its financial strength.
3
6. LETTER TO SHAREHOLDERS
POSITION OF STRENGTH.
Others have taken notice of our success. The Edison Electric Institute awarded us the power industry’s highest honor –the
prestigious 2005 Edison Award – for our leadership in the competitive energy marketplace. FORTUNE magazine named us one of
the 100 Fastest-Growing Companies in the country. President George W. Bush visited our flagship Calvert Cliffs Nuclear Power
Plant, where he delivered a speech on energy policy and called for a renewed interest in building the nation’s next generation
of nuclear power plants.
While that recognition is gratifying, it’s our successful and balanced business strategy that puts us in a position of
strength. Our strategy is on target. We will continue to build on it and deliver on our financial commitments.
Expanding our participation along the energy value chain is the key. We’re working to improve our balance sheet and
cash flow, and we use a disciplined investment approach to grow our business. We make investments and acquisitions only if
they provide sufficient risk-adjusted returns.
STAYING AHEAD OF THE CURVE.
I believe the energy industry is nearing another phase of major change. This time the major change will be consolidation.
Given the benefits of economies of scale and the advantages of serving diversified geographic areas and customers all
along the energy value chain, it makes sense that companies will seek partners to form larger and more efficient operations.
Once again, we’re ahead of the curve. In December, we announced our plan to merge with FPL Group. The merger will bring
together two of the strongest, fastest-growing and most successful energy companies in America. It is an exciting, strategic com-
bination that will position us as what I call an end-game player.
BECOMING AN END-GAME PLAYER.
When the merger receives the required regulatory and shareholder approvals, our combined company not only will be the No. 1
competitive energy supplier in the United States, it will also be the nation’s largest power generator and second-largest electric
utility portfolio.
Most importantly, this merger puts us in a position to achieve something very special. Consolidation will increase in the
energy industry, with a shift from many, smaller companies to fewer, larger companies. The leaders at the end of this shift will
be those with a large diversified geographic reach, cost and efficiency advantages produced by economies of scale, and strong
balance sheets.
We’re taking the right strategic steps now – at a time and with a partner of our own choosing–to secure our place as an
end-game player in the energy marketplace of the future.
It’s been an exhilarating last four years, with accomplishments beyond even our own expectations. It’s all due to the suc-
cess of our bold strategy and the hard work of our employees–it’s their energy that keeps this company turned on. As we move
forward and become an end-game player in our consolidating industry, I’m confident that our strong success will continue.
I’m glad to be a part of it and hope you are too.
Mayo A. Shattuck III
Chairman, President and CEO
April 19, 2006
4
7. FINANCIAL HIGHLIGHTS
In millions, except per share amounts 2005 2004 % Change
COMMON STOCK DATA
Reported (GAAP) earnings per share $ 3.47 $ 3.12
Income (loss) from discontinued operations $ 0.13 $ (0.16)
Cumulative effects of changes in accounting principles $ (0.04) $ -
Special items* $ (0.24) $ 0.16
Earnings per share from continuing operations and before
cumulative effects of changes in accounting principles
and specials items** $ 3.62 $ 3.12 16.0%
Dividends declared per share $ 1.34 $ 1.14 17.5%
Average shares outstanding– assuming dilution 179.7 173.1
Market price per share– year end $ 57.60 $ 43.71 31.8%
FINANCIAL DATA
Total revenues $17,132 $12,286
GAAP net income $ 623 $ 540
Income (loss) from discontinued operations $ 23 $ (27)
Cumulative effect of changes in accounting principles $ (7) $ -
Special items (after-tax)* $ (43) $ 28
Net income from continuing operations before cumulative
effects of changes in accounting principles and special items** $ 650 $ 539
Total assets $21,474 $17,347
Total debt $ 4,861 $ 5,294
Total common equity $ 4,916 $ 4,727
Capital expenditures $ 1,032 $ 762
Certain prior year amounts have been reclassified to conform with current year’s presentation.
*Includes mark-to-market losses on certain non-qualifying hedges on fuel adjustment clauses and gas transportation contracts, recognition of synfuel tax credits
associated with 2003 production, workforce reduction costs, impairment losses and other costs and net (loss) gain on sale of investments and other assets.
**Represents a measure that is not determined in accordance with generally accepted accounting principles (GAAP). However, we believe the impact of discontinued
operations, accounting changes and special items obscures trends in our results and that it is useful to consider our results excluding such items.
2003 Earnings: For 2003, our GAAP earnings per share were $1.66. Excluding special items of ($1.16), our earnings per share were $2.82.
2002 Earnings: For 2002, our GAAP earnings per share were $3.20. Excluding special items of $0.74, our earnings per share were $2.46.
5
8. TURNING ON THE NUMBERS
ADJUSTED EARNINGS PER SHARE REVENUES
(excludes special items and certain (billions of dollars)
economic non-qualifying hedges)
$3.62 $17.1
$3.12
$2.82
$12.3
$2.46
$9.5
$4.8
’02 ’03 ’04 ’05 ’02 ’03 ’04 ’05
GROWING MORE THAN 10 PERCENT ANNUALLY IN A 3 PERCENT INDUSTRY MOVING ON UP
Our earnings per share–excluding special items and certain economic non- Our revenues continue to grow, hitting
qualifying hedges – grew to a record $3.62. That’s a 16 percent growth rate over 2004, $17.1 billion in 2005 and driving our rise in
significantly better than the 3 percent average growth rate within our industry. the FORTUNE 500 ranking of companies.
Note: See Financial Highlights (including the GAAP reconciliation)
on page 5 for more details.
VALUE OF A $100 INVESTMENT
$244.15
$250
• CONSTELLATION ENERGY
• S&P 500 ELECTRIC UTILITIES INDEX
• S&P 500
$200
$156.68
$150
$116.59
$100
$50
12/31/01 12/31/02 12/31/03 12/31/04 12/31/05
CREATING SHAREHOLDER VALUE
Assuming reinvestment of dividends, $100 invested in Constellation Energy common stock on
December 31, 2001 was worth $244.15 on December 31, 2005. Our total return to shareholders–stock
price appreciation plus dividends reinvested–has averaged 29 percent annually, far surpassing the
total returns produced by the S&P 500 Electric Utilities Index and the S&P 500.
6
9. TURNING ON THE NUMBERS
PRODUCTIVITY GAINS RETAIL PEAK LOAD
(millions of dollars)
• NewEnergy • TXU • SUEZ
Total / $190 • Reliant • Great Plains • Direct Energy (US only)
2007 / $60 15,000
Megawatts
2006 / $40 10,000
5,000
2005 / $90 actual $80 projected
0
’03 ’04 ’05
WORKING SMARTER AT LOWER COST CONTINUED MOMENTUM IN RETAIL SUPPLY
Exceeding our 2005 goal by $10 million, we’re Constellation NewEnergy retained its No. 1 market position in competitive
on track to achieve at least $190 million of retail supply and outpaced its competitors in peak load served.
productivity gains by 2008. That scale benefits virtually every aspect of the business.
Source: KEMA 2005 Retailer Review – September 2005
POWER GAS COAL
Percent of FERC Reported Volumes* Natural Gas Reported Volumes Coal Deliveries (million tons)*
(Bcf/day)*
8.2 5.6 12.6
7.5
5.9
4.7
5.6 5.6
2.2
2.6
0
’01 ’02 ’03 ’04 ’05 ’03 ’04 ’05 ’03 ’04 ’05
*Source: Platts Megawatt Daily *Source: Platts Gas Daily *Exclusive of agency volumes
STAYING ON TOP AND REACHING NEW HEIGHTS
We retained our No. 1 market position in wholesale power while
rising to the No. 6 market position in natural gas and more than
doubling the volumes of coal we deliver.
7
10. EXCEEDING EXPECTATIONS
We invest strategically, leveraging our skills and expertise without disproportionately increasing risk. Acquisitions, as well as
internal investments, must meet strict hurdle rates or they’re not made. Thanks to a great strategy and sharp execution, we’ve
been successful in achieving above-average rates of return on our investments. Among those leading and guiding our success
are: (pictured left to right on the next page) Andrew Good, Chief Financial Officer of our Commodities Group; Kevin Hadlock,
Director of Investor Relations; Kathi Hyle, Senior Vice President of Finance and Operations; and E. Follin Smith, Executive Vice
President, Chief Financial Officer and Chief Administrative Officer.
WE TURN YOUR INVESTMENT ON
Our strategy continues to be successful. Our returns significantly exceed those from the
S&P 500 Electric Utilities Index and from the S&P 500. From the development and imple-
mentation of our balanced strategy in November 2001 through the end of 2005, our stock
price appreciated 159 percent. Assuming the reinvestment of dividends, our average
annual total return to shareholders during that same time was 29 percent.
8
11. WITH A PROVEN STRATEGY
Our priority is to build shareholder value. We’re careful with cash, and we use it wisely.
That means continually looking for ways to permanently reduce our cost base, improve
gross margins from our generation fleet and add to our efficiencies. In 2005, our efforts
resulted in $90 million in productivity gains, beating our goal by $10 million. We’re work-
ing to achieve an additional $100 million in productivity gains by 2008.
9
12. WE TURN INDUSTRY & COMMERCE ON
Competition drives American business – and we power it. As North America’s No. 1 sup-
plier of competitive energy, we help customers gain a critical competitive advantage
by providing them with customized tools and services to manage their entire energy
portfolio. Characterized by intense innovation, sharp customer focus and an unwavering
commitment to excellence, no company is better prepared to provide progressive energy
solutions than Constellation Energy.
10
13. A KEEN FOCUS ON CUSTOMERS’ NEEDS
Constellation NewEnergy is a North American business with a regional focus, serving more than 10,000 competitive energy
customers throughout the United States and Canada, many of which are leaders in their own industries–ranging from
manufacturing and retail, to hospitality and education, to technology and health care. For more than 70 years, Baxter
International, Inc. has been a leader in health care, applying its expertise in medical devices, pharmaceuticals and
biotechnology to make a meaningful difference in patients’ lives. We provide energy and related services–electricity,
natural gas, risk management and other progressive energy solutions–to 16 of Baxter’s facilities in Illinois, Maryland and
California. As with all of our competitive energy customers, managing Baxter’s energy needs is a team effort. Members of
the team gathered in the lobby at Baxter’s headquarters in Deerfield, Ill., are: (left to right) Brad Christensen, Constellation
NewEnergy Director of National Sales; Doug Bushing, Baxter Energy Manager; YaLonda Lockett, Constellation NewEnergy Senior
Business Development Manager; and Charlie McLaughlin, Baxter Strategic Alliance Director.
WITH PROGRESSIVE SOLUTIONS
We show customers how to purchase and manage energy as a strategic asset. Traditional
energy procurement models cannot meet the demands of volatile commodity prices–so
we’ve introduced a new one. We help customers manage through market volatility with
a flexible yet disciplined risk management model that offers significant advantages over
rigid annual contracts. That’s why more than two-thirds of the FORTUNE 100 companies
turn to us for their energy needs.
11
14. LEVERAGING OUR EXPERTISE TO BENEFIT OUR CUSTOMERS
By optimizing the supply and delivery of both fuel and power for our customers–some of the world’s largest producers and con-
sumers of power, natural gas, oil and coal – we help them successfully manage their energy supply and price risk. Our disciplined
focus on physical energy markets and on rigorous risk management drives our success and the success of our customers. For
example, we help the Wellesley Municipal Light Plant in Massachusetts meet its commitment to provide reliable and efficient
electricity at fair and competitive rates to more than 27,000 residents. From street lamps to stop lights, from living rooms to
classrooms, we meet all of the town’s power requirements.
WE TURN CUSTOMERS ON
Our superior risk management capability is the core of our competitive advantage. We
believe that our valuation tools and infrastructure – along with the expertise of our team–
are unsurpassed in the industry. Our track record of growth and success clearly demon-
strates the value of our world-class risk management.
12
15. DICK JOYCE, Director
Wellesley Municipal Light Plant
Wellesley, Mass.
WITH SUPERIOR RISK MANAGEMENT
In a complex field, our strategy is simple. We combine highly trained experts in mar-
ket analysis with best-in-class risk management technology to effectively manage the
physical and financial risks in the energy industry. Proficient management of our large
portfolio of physical and contractual assets enables us to continuously help our cus-
tomers realize more value from their energy investments.
13
16. LARRY RICHARDS, Supervisor
Tool and Test Equipment
Calvert Cliffs Nuclear Power Plant
WE TURN THE FUTURE ON
Through NuStart Energy, an industry consortium, we’re working toward new nuclear
power plant development with other leading energy companies. In 2005, NuStart applied
to the Nuclear Regulatory Commission for a combined construction and operating license
for the next generation of nuclear power plants. It was a first step that can lead to the
development and deployment of the first nuclear power plant in the U.S. in more than 30 years.
14
17. NUCLEAR BALANCE AND GROWTH
As one of the nation’s premier nuclear power plant owners and operators, we’re demonstrating that nuclear power is reliable,
cost-effective and environmentally friendly. Our nuclear power strategy balances the present with the future. We continuously
work to safely improve production at our five operating nuclear units, which produced 52 percent of the power we generated in
2005. And we’re working to provide the framework to help build the next generation of nuclear power plants. Our efforts were
recognized when President George W. Bush visited our industry-leading Calvert Cliffs Nuclear Power Plant (the plant’s spent
fuel pool is shown in photo at left) and delivered an energy policy speech that advocated the development and building of new
nuclear power plants and reinforced the significant role that nuclear power will play in our nation’s energy future.
BY INVESTING WISELY
In addition, we’ve joined with AREVA, Inc., a preeminent nuclear reactor vendor, to form
UniStar Nuclear. Combining our experience as a nuclear fleet owner and operator with
AREVA’s technological expertise, UniStar has pioneered a new business model through
which Constellation Energy and other nuclear owners may design, certify, license, build,
operate and own a standard fleet of new nuclear power plants. Together, we’re working
to make a new fleet of advanced design nuclear power plants a reality.
15
18. DOING GOOD
Our Panther Creek generating facility– located in Nesquehoning, Pa.–turns otherwise unusable waste coal into energy.
Anthracite coal mining throughout Eastern Pennsylvania–once the region’s booming industry–left behind countless piles of a
black powdery waste coal product called culm. Panther Creek has been part of an innovative environmental solution, burning
the culm to produce electricity. Since beginning operations in 1992, our generating plant has helped remove more than 7 million
tons of culm from the Pocono Mountain foothills, leading to the restoration of more than 200 acres of land.
WE TURN OUR WORLD ON
We remain steadfast in our commitment to environmental stewardship. Our diverse energy
portfolio includes emission-free nuclear and renewable energy sources – including geo-
thermal, solar, biomass and hydropower – and with the growth of our competitive supply
business, Constellation Energy now supplies more green power than ever before.
16
19. JIM CARROLL, Manager
Environmental Health and Safety
Panther Creek
WITH CLEANER ENERGY
Over the last several years, we have spent more than $170 million to install air pollution
controls at our fossil plants, helping to reduce emissions such as nitrogen oxides and
particulates and facilitate the utilization of low-sulfur coal. We plan to invest an additional
$570 million in environmental initiatives through 2008. And we continue to evaluate the
latest technologies and processes that will enable us to produce cleaner energy in the future.
17
20. WE TURN OUR COMPANY ON
Talent, commitment, excellence – that’s the combination that makes our employees
passionate about the way energy works. We provide customers with the energy and
the services and products they need to effectively manage costs and usage. By doing
that all along the energy value chain, our dynamic and diverse workforce drives our
business success.
18
21. SMART PEOPLE DRIVE OUR SUCCESS
Shown left to right, Wynne Hayes, Joe Maranto and Fred Jackson are just three of the thousands of passionate people who turn
our company on and are the foundation of our success.
“I’m passionate about the people I “Every customer is unique. My passion “Seeing the growth and development
work with – a team of enthusiastic is earning the trust and confidence of of the young people who are coming
people with ‘can do’ attitudes. Work- our customers by looking at situations into the company is my passion. It’s
ing together across the organization from their perspective and providing so rewarding to see them join the
to develop business solutions that them with customized energy solu- company, work hard, learn the busi-
deliver results is very gratifying.” tions that meet their needs.” ness and become great contributors.
We all feel a tremendous commitment
WYNNE HAYES, Vice President JOE MARANTO, Director to the job and to our customers.”
Business Performance Improvement Business Development
& Information Technology Constellation Energy Projects FRED JACKSON, Supervisor
Constellation Energy Generation Group & Services Group, Inc. Distribution Operations
Baltimore Gas and Electric
WITH PASSIONATE PEOPLE
We deliver results for our customers and shareholders by employing and retaining the
best and the brightest talent. With an eye for transforming the way energy works, our
employees focus on satisfying customers’ needs and meeting our business objectives. In
return, our employees gain a work experience that rewards their contributions, supports
their work and life needs, and provides the opportunity to learn and to grow.
19
22. B OA R D O F D I R E C T O R S
Mayo A. Shattuck III Yves C. de Balmann Douglas L. Becker
James T. Brady Frank P. Bramble, Sr. Edward A. Crooke
James R. Curtiss, Esq. Dr. Freeman A. Hrabowski III Nancy Lampton
Robert J. Lawless Lynn M. Martin Michael D. Sullivan
CORPORATE GOVERNANCE
We are an industry leader in corporate governance. Copies of the charters of each of the committees of the Board of Directors, as well as copies of our Corporate
Governance Guidelines, Principles of Business Integrity, Corporate Compliance Program and Insider Trading Policy are available on our Web site at constellation.com.
In addition, 11 of the 12 members of our Board of Directors are independent. Michael D. Sullivan, one of our independent directors, serves as Lead Director.
20
23. B OA R D O F D I R E C T O R S
Mayo A. Shattuck III Yves C. de Balmann Douglas L. Becker
Chairman, President and Chief Executive Officer Co-Chairman Chairman and Chief Executive Officer
Constellation Energy Bregal Investments Laureate Education, Inc.
Age 51 Age 59 Age 40
Director since 1999 Director since 2003 Director since 1998*
James T. Brady Frank P. Bramble, Sr. Edward A. Crooke
Managing Director, Mid-Atlantic Retired Vice Chairman Retired Vice Chairman
Ballantrae International, Ltd. MBNA Corporation Constellation Energy
Age 65 Age 57 Age 67
Director since 1999 Director since 2002 Director since 1988*
James R. Curtiss, Esq. Dr. Freeman A. Hrabowski III Nancy Lampton
Partner President Chairman and Chief Executive Officer
Winston & Strawn University of Maryland American Life and Accident Insurance Company
Age 52 Baltimore County of Kentucky
Director since 1994* Age 55 Age 63
Director since 1994* Director since 1994*
Robert J. Lawless Lynn M. Martin Michael D. Sullivan
Chairman, President and Chief Executive Officer President Chairman
McCormick & Company, Inc. The Martin Hall Group LLC Life Source, Inc.
Age 59 Age 66 Age 66
Director since 2002 Director since 2003 Director since 1992*
*Formerly a BGE Director, was elected to the Constellation Energy Board of Directors in April 1999 at the formation of the holding company.
COMMITTEES OF THE BOARD
Executive Committee Compensation Committee Nominating and Corporate Governance Committee
Mayo A. Shattuck III, Chairman Robert J. Lawless, Chairman Michael D. Sullivan, Chairman and Lead Director
Frank P. Bramble, Sr. Douglas L. Becker Douglas L. Becker
Edward A. Crooke Dr. Freeman A. Hrabowski III Dr. Freeman A. Hrabowski III
Robert J. Lawless Lynn M. Martin Robert J. Lawless
Michael D. Sullivan Lynn M. Martin
Audit Committee
James T. Brady, Chairman Committee on Nuclear Power
Yves C. de Balmann James R. Curtiss, Chairman
Frank P. Bramble, Sr. Edward A. Crooke
Nancy Lampton
Lynn M. Martin
INTERESTS ALIGNED WITH SHAREHOLDERS
We maintain share ownership guidelines to further align the interests of our directors with the interests of our shareholders. The guidelines require directors to
acquire and maintain holdings of Constellation Energy stock equal to at least five times the annual cash retainer.
21
24. EXECUTIVE TEAM
Mayo A. Shattuck III
Thomas V. Brooks Thomas F. Brady E. Follin Smith
Michael J. Wallace Irving B. Yoskowitz Paul J. Allen
John R. Collins Kenneth W. DeFontes, Jr. Beth S. Perlman
George E. Persky
Marc L. Ugol Felix J. Dawson
22
25. EXECUTIVE TEAM
Mayo A. Shattuck III
Chairman, President and Chief Executive Officer
Elected Chairman of the Board in July 2002, appointed
President and Chief Executive Officer in November 2001…
age 51… prior to Constellation Energy, was Chairman of
the Board of Deutsche Banc Alex. Brown … also was Global
Head of Investment Banking and Global Head of Private
Banking at Deutsche Bank, Vice Chairman at Bankers Trust
and President at Alex. Brown & Sons.
Thomas V. Brooks Thomas F. Brady E. Follin Smith
Vice Chairman and Executive Vice President Executive Vice President, Corporate Strategy and Retail Executive Vice President, Chief Financial Officer and Chief
Chairman, Constellation Energy Commodities Group Competitive Supply Administrative Officer
Responsible for wholesale energy strategy, capital Serves as managing executive for Constellation NewEnergy, Responsible for finance, information technology, human
allocation and risk management…previously was President BGE HOME and Constellation Energy Projects & Services resources, legal, audit, risk management, investor relations
of Constellation Energy Commodities Group and also served Group… responsible for corporate strategy, acquisitions and and business process improvement … age 46 … joined
as Vice President, Business Development and Strategy… dispositions, retail competitive supply, governmental affairs Constellation Energy in 2001… prior to Constellation Energy,
age 43…joined Constellation Energy in 2001…prior to and corporate branding … previously was Chief Accounting was Senior Vice President and Chief Financial Officer of
Constellation Energy, worked in the Fixed Income and Officer at Baltimore Gas and Electric and also served in Armstrong Holdings, Inc .… also served in various financial
Commodities Division at Goldman Sachs. various executive and management positions, including executive and management positions at General Motors.
Vice President of Customer Service and Distribution … age
56…joined Baltimore Gas and Electric in 1969.
Michael J. Wallace Irving B. Yoskowitz Paul J. Allen
Executive Vice President Executive Vice President and General Counsel Senior Vice President, Corporate Affairs
President, Constellation Energy Generation Group Responsible for corporate governance and compliance, Responsible for external affairs, government and regulatory
Responsible for our power generation business…age 58 mergers and acquisitions, and litigation … age 60 … joined relations and environmental policy … age 54 … joined
…joined Constellation Energy in 2002…prior to Constellation Energy in 2005 … prior to Constellation Constellation Energy in 2001… prior to Constellation Energy,
Constellation Energy, was co-founder and Managing Energy, was Senior Partner of Global Technology Partners was Senior Vice President and Group Head, Ogilvy Public
Director of Barrington Energy Partners, LLC…also was LLC, Senior Counsel at Crowell & Moring LLC and Senior Relations … also was a senior staff member at the Natural
Chief Nuclear Officer and served in various executive Consultant at Charles River Associates … also was Resources Defense Council, Press Secretary for Senator
positions at Unicom/ComEd. Executive Vice President and General Counsel at United Christopher Dodd (D-Conn.), and Foreign News Editor and
Technologies Corporation and served in various positions Editor of Morning Edition at National Public Radio.
at IBM.
John R. Collins Kenneth W. DeFontes, Jr. Beth S. Perlman
Senior Vice President and Chief Risk Officer Senior Vice President Senior Vice President and Chief Information Officer
Responsible for assessing and managing risk…previously President and Chief Executive Officer, Baltimore Gas Responsible for information technology initiatives and
was Managing Director of Finance and Treasurer of and Electric standardization of systems and architecture … age 45 …
Constellation Power Source Holdings and Constellation Responsible for our regulated distribution utility business … joined Constellation Energy in 2002 … prior to Constellation
Energy Commodities Group, and also served in various previously was Vice President, Electric Transmission and Energy, was Vice President of Wholesale Trading
leadership positions at Constellation Energy Commodities Distribution, and also served in various executive and Technology and served in various other technology and
Group and Baltimore Gas and Electric…age 48…joined management positions … age 55 … joined Baltimore Gas operations management positions at Enron … also served in
Baltimore Gas and Electric in 1988…prior to Baltimore and Electric in 1972. financial and technology management positions at Lehman
Gas and Electric, served in various financial management Brothers; Kidder, Peabody & Company; and J.P. Morgan.
positions at Bell Atlantic Corporation and Perdue Farms, Inc.
Marc L. Ugol Felix J. Dawson George E. Persky
Senior Vice President, Human Resources Co-President and Co-Chief Executive Officer, Constellation Co-President and Co-Chief Executive Officer, Constellation
Responsible for organizational effectiveness, staffing, labor Energy Commodities Group Energy Commodities Group
relations, compensation and benefits…age 47…joined Responsible for wholesale energy, commodity services Responsible for wholesale energy, commodity services
Constellation Energy in 2002…prior to Constellation and risk management for electricity, coal, natural gas and and risk management for electricity, coal, natural gas and
Energy, was Senior Vice President of Human Resources at related commodities … previously was Co-Chief Commercial related commodities … previously was Co-Chief Commercial
Tellabs, Inc.…also served in human resources management Officer, Constellation Energy Commodities Group, and Officer, Constellation Energy Commodities Group, and
positions at Platinum Technology, Inc., System Software served in various leadership positions in origination and served in leadership positions in portfolio management and
Associates, Inc. and Amoco Corporation. portfolio management…age 38…joined Constellation Energy trading … age 36 … joined Constellation Energy in 2001…
in 2001… prior to Constellation Energy, worked in various prior to Constellation Energy, worked in various positions
positions at Goldman Sachs. at Goldman Sachs.
Our executive team leads the development and implementation of our aggressive growth strategy, creating a leading competitive position that combines superior risk management skills and
intimate knowledge of physical energy logistics with an intense focus on meeting customer needs. Our vision now is to be an end-game player – one of the leading companies after our industry
goes through a significant period of consolidation. This leadership team has the skills and expertise to take us there.
INTERESTS ALIGNED WITH SHAREHOLDERS
We maintain ownership guidelines to further align the interests of our executives with the interests of our shareholders. The guidelines require our executives to acquire and maintain holdings
of Constellation Energy stock ranging from three times base salary for senior vice presidents to seven times base salary for our CEO.
23
26. WE TURN IT ON
WE’RE… IN 2005, WE… OTHERS ARE TAKING NOTICE. WE…
• A FORTUNE 200 competitive energy company • Provided a 35 percent total return to share- • Received the prestigious 2005 Edison Award–the power industry’s
headquartered in Baltimore. holders, assuming reinvestment of dividends. highest honor.
• North America’s No. 1 supplier of energy to • Earned $3.62 per share, excluding special • Were named one of America’s 100 Fastest-Growing Companies by
wholesale and retail commercial and industrial items and certain economic non-qualifying FORTUNE magazine.
customers in competitive markets. hedges, up 16 percent from 2004. • Ranked as a top 250 Global Energy Company by Platts, earning a position
• A major generator of electricity with a diversi- • Implemented productivity improvements that as the No. 2 independent power producer worldwide.
fied fleet of power plants located strategically delivered $90 million in pre-tax savings. • Ranked as the No. 1 utility in BusinessWeek’s annual evaluation of the
throughout the United States. • Strengthened our balance sheet by reducing best-performing companies on the S&P 500 stock index.
• A regulated distributor of electricity and our debt-to-total capitalization ratio. • Garnered media attention from leading publications, including Forbes,
natural gas in Central Maryland. • Advanced to No. 125 on the FORTUNE 500 list. FORTUNE, BARRON’S, the Washington Post and the Baltimore Sun.
• Were named to the Dow Jones Sustainability
North America Index.
OUR BUSINESSES OUR BUSINESS FOCUS OUR CUSTOMERS
Constellation Energy Serving the needs of producers and consumers of electricity, coal, natural gas and oil Intensive energy users–including distribution utilities,
Commodities Group power generators, cooperatives, municipalities, oil and
Managing the commodity price risk for power generators
A wholesale marketing and risk natural gas exploration and production companies
management operation Managing the output and fuels for our own generation fleet and selling that power and others
Energy producers and consumers that require a reliable
counterparty to manage their price and supply risks
COMPETITIVE SUPPLY
Constellation NewEnergy Meeting our customers’ energy and risk management needs through innovative products More than 10,000 commercial, industrial and
A retail electricity supply operation and outstanding service governmental organizations
providing energy products and
Becoming an extension of our customers’ energy procurement function–helping More than two-thirds of the FORTUNE 100 companies,
services
customers effectively manage and control energy costs and usage based on their including FedEx, Ford Motor Company, IBM, Kimberly-
unique business requirements Clark, Merck & Co., Inc. and Staples
Constellation NewEnergy – Offering customers unparalleled service and expertise by providing the most reliable and More than 4,000 commercial, industrial, municipal and
Gas Division economical supplies of natural gas throughout the competitive energy markets local gas distribution and power generation facilities that
Natural gas supply and annually consume more than 300 billion cubic feet of
transportation-related services natural gas
Constellation Energy Owning, operating and maintaining a diversified fleet of fossil, nuclear and hydroelectric Constellation Energy Commodities Group sells most
GENERATION
Generation Group generating facilities with a capacity of approximately 12,000 megawatts of the power generated by Constellation Energy
A power generation operation Generation Group
Becoming a recognized leader in energy generation through safe, efficient, reliable
operations
Baltimore Gas and Electric Becoming a recognized leader in energy delivery–improving the reliability of our distribu- More than 1.2 million electric and more than 634,000
ENERGY DELIVERY
A regulated electric transmission tion system, reducing interruptions and improving our response to outages natural gas residential, commercial and industrial
and distribution and natural gas customers in Baltimore and in all, or part of, 10 counties
Maintaining and operating 250 substations, nearly 23,000 miles of distribution lines and
distribution utility company in Central Maryland
1,300 miles of transmission lines...as well as two peak-shaving plants, nine gate stations
and more than 6,000 miles of gas main
Fellon-McCord & Associates Offering clients energy consulting and management expertise in the physical, financial, Serving large commercial, industrial, municipal and insti-
A leading provider of energy con- regulatory and legislative aspects of the energy markets tutional energy users as well as producers, generators,
ENERGY CONSULTING/SERVICES
sulting and management services aggregators, third party marketers, utilities, storage owners
and operators
Constellation Energy Projects Providing customized solutions–including central energy plants, on-site power generation, Commercial, industrial and governmental facilities includ-
& Services Group mechanical-electrical upgrades and renewable energy products–to increase energy ing Heinz Field in Pittsburgh and municipal and commer-
A full-service energy company efficiency, reliability and cost effectiveness cial facilities in downtown Nashville, Tenn.
BGE HOME Providing energy-focused, essential products and services, including heating, air condi- Residential and small commercial customers
Competitive provider of energy- tioning, plumbing, electrical and appliance needs, as well as window and door replace-
related products and services ments, home security installations, and the sale of natural gas to the residential market
24
27. WE TURN IT ON
POSITIONED TO BECOME AN END-GAME PLAYER COMBINING STRENGTHS
Our pending merger with FPL Group will make us an end-game player. The pending merger brings together well-matched, complementary assets, creating a balanced footprint to
The merger will… serve customers all along the energy value chain in key markets.
• Join two of the strongest and most successful companies in the industry.
CONSTELLATION ENERGY FPL GROUP
• Make us a FORTUNE 100 company and strengthen our position as the
leader in North America’s competitive energy markets. • Significant growth operating in competitive markets • Significant growth operating in its regulated market
• Provide multiple channels of growth and a solid base of stable, growing • Largest supplier of energy to wholesale and retail • Owns generating assets in key competitive markets
earnings from two outstanding regulated utilities. customers in competitive markets • Leading wind power generator
• Combine two already strong balance sheets into what will be the • Leading risk management expertise • Strong nuclear power capability
strongest balance sheet in the industry. • Strong nuclear power capability • Focus on cost efficiency and service reliability
• Significantly increase the dividend paid to our current shareholders. • Focus on cost and operational efficiency
POST-MERGER, WE’LL BE THE COUNTRY’S…
• No. 1 power generator. • No. 1 retail competitive supplier.
• No. 1 wind power generator. • No. 2 regulated electric utility portfolio.
• No. 1 wholesale competitive supplier. • No. 3 nuclear power generator.
OUR MARKETS OUR STRONG 2005 PERFORMANCE OUR FOCUS IN 2006
Energy markets throughout Retained our position as the No. 1 supplier of wholesale competitive energy in Leveraging our successful model in new markets and new areas across the
North America and across North America, substantially increased our delivered volumes in natural gas, energy spectrum
the globe and delivered more than 12 million tons of coal to customers in the United
Deploying capital to grow our market share through superior risk
States, Europe and the Far East, as well as to our own fleet
management expertise
Further extended our business model for power into new areas–upstream and
downstream natural gas and coal–to meet the underserved and growing needs
of energy producers and users
Competitive electricity markets Strengthened our No. 1 market position by increasing our share to 24 percent, Continuing to strengthen our sales force, brand recognition and
throughout North America more than 50 percent larger than our nearest market competitor product excellence
Achieved outstanding customer loyalty and satisfaction–in an independent Improving gross margin by standardizing infrastructure and processes and
survey, 93 percent of our customers said they were happy they chose us, increasing Web services
that they would choose us again, and that they would recommend us to others
Increasing our market share to nearly 30 percent by 2008, and growing
volumes at a compound annual rate of 18 percent over the next three years
Competitive energy markets Expanded customer base by more than 25 percent over prior year and Aggressively take advantage of organic growth opportunities – targeting sales
throughout North America increased sales volumes to 300 billion cubic feet of natural gas of more than 500 billion cubic feet over the next five years
Competitive wholesale energy Achieved more than $70 million in pre-tax productivity savings Continuing to drive productivity gains by lowering cost and increasing output
markets across North America
Set site records for shortest refueling outages at our Calvert Cliffs, Ginna and Adding 83 megawatts to the generating capacity at Ginna Nuclear Power Plant
Nine Mile Point nuclear power plants
Remaining on the forefront of new nuclear power initiatives
Central Maryland – a 2,300- Continued to provide stable earnings and cash flow by contributing $0.98 per Using Vision 2020–a business performance improvement initiative–to develop
square-mile electric service share to our overall earnings a path for our future success
territory, and an 800-square-mile
Achieved savings and significant progress in improving productivity–ranked in Creating a new, revitalized safety culture in which every employee is committed
natural gas service territory
the top 10 percent of comparable companies in operating cost per customer to zero accidents
Energy markets across Enhanced our position as the leader in energy consulting and management Continue our global expansion to support our clients’ international energy
North America and Europe services by expanding our customer base in both North America and Europe procurement needs
Energy markets across Successfully completed the acquisition and integration of Cogenex Capitalizing on a comprehensive marketing and sales program that leverages
North America Constellation Energy’s national retail presence and takes advantage of federal,
state and local energy credits and rebate programs
Maryland Received Microsoft’s Pinnacle Award for Excellence in Customer Service in Building on core strengths and competencies and focusing on the development
recognition of our use of technology to further improve the level of service we of new technical and energy-related products and services that are essential to
provide to customers homes and small businesses
25
28. UNDERSTANDING OUR FORM 10-K
One of our priorities at Constellation Energy is to provide you with clear, easy-to-read and easy-to-
understand information about our company. We want you to know what we do, how we do it and how
we’re doing. So we’re working to make our Form 10-K – our annual report required to be filed with the
Securities and Exchange Commission–more welcoming and less complex.
This special section is intended to be a guide, describing and summarizing some of the information
contained in our Form 10-K and providing page numbers where more details can be found. Our complete
Form 10-K follows this special section.
BREAKING DOWN OUR FORM 10-K
Our Form 10-K has four parts:
Part I In-depth descriptions of our businesses
Part II Our financial performance, the information in which investors are usually most interested
Part III Directs readers to other filings made with the Securities and Exchange Commission for details
on, among other matters, our Board of Directors, executive compensation, auditor fees and
stock ownership information
Part IV A listing of financial statement schedules and exhibits
Over the next several pages, we provide descriptions and summaries of some of the major topics included
in Parts I and II.
26
29. U N D E R S TA N D I N G O U R F O R M 1 0 - K
PART I: OUR BUSINESSES
Part I of our Form 10-K provides details about our businesses:
• Our merchant energy business
• Our regulated utility – Baltimore Gas and Electric Company
• Our other nonregulated businesses
Also included is information about environmental matters, employees, properties and executive officers.
HIGHLIGHTS OF WHAT YOU’LL FIND
HERE’S WHERE YOU LOOK IN PART l
PAGES ITEM SECTION
2 1. Business Pending Merger with Our planned merger with FPL Group is contingent upon the approval by shareholders of both
FPL Group, Inc. companies and the receipt of required regulatory approvals.
2 Overview We have a merchant energy business and a regulated utility.
3 Operating Segments Our reportable operating segments are merchant energy, regulated electric and regulated gas.
We also have certain other nonregulated business activities.
3-10 Merchant Energy Our business
Business We provide wholesale electricity and services to distribution utilities and municipalities...
electricity and natural gas supply and services to large commercial, industrial and govern-
mental customers...coal logistics services...we generate electricity...and we manage
energy price risk over geographic regions and time.
Fuel sources
Our electricity generated by fuel type in 2005: nuclear–52 percent, coal–30 percent,
natural gas–14 percent, renewable and alternative–2 percent, and oil and dual oil-
natural gas–2 percent.
Our competition
We encounter competition from companies of various sizes with varying levels of experience
and financial and human resources and differing strategies.
Merchant energy business operating statistics for the last five years
Our revenues and megawatt hours generated have increased.
10-15 Baltimore Gas and Our business
Electric Company We’re an electric transmission and distribution utility and a natural gas distribution utility with
a service territory that includes the City of Baltimore and parts of Central Maryland.
Electric and gas operating statistics for the last five years
Revenues by type, distribution volumes to our customers and the number of our customers.
15 Other Nonregulated Our businesses
Businesses We offer energy solutions to residential, commercial, industrial and governmental customers.
15 Consolidated Capital Our total capital requirements for 2005 were $1.0 billion, and we expect them to be $1.3 billion
Requirements in 2006.
15-18 Environmental Matters We are subject to regulations concerning air quality, water quality and disposal of hazardous
substances–over the next three years our estimated capital requirements are $570 million.
NOTE: This special section is intended to be a guide. You can find more details about all these items in our Form 10-K. Our Form 10-K follows this special section.
27
30. U N D E R S TA N D I N G O U R F O R M 1 0 - K
PART I: OUR BUSINESSES (continued)
HIGHLIGHTS OF WHAT YOU’LL FIND
HERE’S WHERE YOU LOOK IN PART l
PAGES ITEM SECTION
18 Employees We had approximately 9,850 employees at year-end 2005.
19-24 1A. Risk Factors There are a number of risks that could adversely affect our financial results relating to our
businesses, the industries in which we operate and our pending merger with FPL Group.
25-27 2. Properties Our offices and facilities
Our corporate offices are in Baltimore. We have plants and marketing offices throughout
North America and we also lease space internationally.
Our generating plants
We own nearly 12,000 megawatts of generating capacity diversified by fuel type and located
strategically throughout the United States.
27-28 4. Submission of Executive Officers of Our executive officers
Matters to Vote of the Registrant Our executive officers have a diverse mix of energy, financial and other experience in competi-
Security Holders tive and regulated markets.
PART lI: OUR FINANCIAL PERFORMANCE
Part II contains management’s discussion and analysis of our results of operations and financial condition and our audited
financial statements. It compares 2005 results to 2004’s, and 2004 results to 2003’s. The sections in Part II include:
• Introductory Items – the basics
• Management’s Discussion and Analysis – the context
• Financial Statements – the numbers
• Notes to the Financial Statements – the details
INTRODUCTORY ITEMS
THE BASICS. Here’s information about our common stock, prices and dividends, and historical financial data.
HIGHLIGHTS OF WHAT YOU’LL FIND
HERE’S WHERE YOU LOOK IN PART ll
PAGES ITEM SECTION
29 5. Market for Our dividend information
Registrant’s Common We declared dividends of $1.34 per share in 2005, and increased our annual dividend rate
Equity and Related to $1.51 per share in January 2006.
Shareholder Matters
Our stock price
The price of our common stock–based on New York Stock Exchange Composite
Transactions–ranged from $43.01 to $62.60 in 2005.
30-31 6. Selected Financial Summary of our operations and financial condition and our financial statistics for the last
Data five years.
NOTE: This special section is intended to be a guide. You can find more details about all these items in our Form 10-K. Our Form 10-K follows this special section.
28
31. U N D E R S TA N D I N G O U R F O R M 1 0 - K
MANAGEMENT’S DISCUSSION AND ANALYSIS
THE CONTEXT. Our management discusses in detail the financial results and condition of our company...and the way we
manage our business.
HIGHLIGHTS OF WHAT YOU’LL FIND
HERE’S WHERE YOU LOOK IN PART ll
PAGES ITEM SECTION
32 7. Management’s Introduction and We summarize how we have organized our discussion and analysis.
Discussion and Analysis Overview
of Financial Condition and
Results of Operations
32-33 Strategy We are pursuing a strategy to provide energy and energy-related services through our competi-
tive supply activities and our regulated Maryland utility.
33-35 Business Environment While energy markets continue to be highly volatile with significant changes in natural gas
and power prices, the Energy Policy Act of 2005 encourages investments in energy produc-
tion and delivery infrastructure and promotes the use of a diverse mix of fuels and renewable
technologies.
36-39 Critical Accounting These are the accounting policies that are most important to the portrayal of our financial con-
Policies dition and results of operations–while also requiring difficult, subjective or complex judgment.
39 Significant Events 2005 significant events include our pending merger with FPL Group, higher commodity prices,
selling our Oleander generating facility and our other nonregulated international investments,
acquiring Cogenex and working interests in gas-producing fields in Texas and Alabama, and
our dividend increase.
40-56 Results of Operations The detailed discussion of our earnings
Our overall net income
Our net income for 2005 was $623.1 million, an increase of $83.4 million from 2004 –
driven mostly by higher earnings from our wholesale marketing and risk management
operation, nuclear generating facilities in New York, our regulated and other nonregulated
businesses, higher income from discontinued operations, and higher investment and
interest income.
Our net income for our merchant energy business
Our merchant energy net income was $425.8 million in 2005, an increase of $35.9 million
from 2004–reflecting our continued growth and increases in gross margin.
Our net income for our regulated electric and gas businesses
Our regulated electric net income for 2005 was $149.4 million, an increase of $18.3 mil-
lion from 2004; and our regulated gas net income for 2005 was $26.7 million, an increase
of $4.5 million from 2004.
57-59 Financial Condition Cash flow
Cash provided by our operations was $627.2 million in 2005.
Security ratings
All of our security ratings are investment-grade.
59-62 Capital Resources Capital requirements
We’re estimating that we’ll need $1.3 billion in capital for 2006 and $1.3 billion in 2007 to fund
existing and anticipated projects.
62-67 Market Risk We are exposed to various risks. Our risk management program uses an effective system of
internal controls and the audit committee of the Board of Directors periodically reviews compli-
ance with our risk parameters, limits and trading guidelines.
NOTE: This special section is intended to be a guide. You can find more details about all these items in our Form 10-K. Our Form 10-K follows this special section.
29
32. U N D E R S TA N D I N G O U R F O R M 1 0 - K
OUR FINANCIAL STATEMENTS
THE NUMBERS. We provide separate financial statements for Constellation Energy and Baltimore Gas and Electric. This section
also includes our management and auditor’s reports on our financial information and the effectiveness of our internal controls.
HIGHLIGHTS OF WHAT YOU’LL FIND
HERE’S WHERE YOU LOOK IN PART ll
PAGES ITEM SECTION
68 8. Financial Statements Report of Management Our management accepts responsibility for the information and representations in our financial
and Supplementary statements and concludes that our internal control over financial reporting was effective as of
Data December 31, 2005–signed by Chairman of the Board, President and Chief Executive Officer
Mayo A. Shattuck III, and by Executive Vice President, Chief Financial Officer and Chief Admin-
istrative Officer E. Follin Smith.
68-70 Reports of Independent PricewaterhouseCoopers LLP states its opinion that our consolidated financial statements
Registered Public present fairly, in all material respects, the financial condition of our company and that we
Accounting Firm maintained, in all material respects, effective internal control over financial reporting at
December 31, 2005.
71 Consolidated Statements Our net income for 2005 was $623.1 million.
of Income
72-73 Consolidated Balance Our total assets were $21.5 billion at December 31, 2005.
Sheets
74 Consolidated Statements Our cash and cash equivalents at December 31, 2005, were $813.0 million, an increase of
of Cash Flows $106.7 million from a year earlier.
75 Consolidated Statements We declared $238.4 million in dividends during 2005, and our retained earnings were
of Common Shareholders’ $2.8 billion at year-end.
Equity and Comprehen-
sive Income
76-77 Consolidated Statements At December 31, 2005, our total capitalization was $9.5 billion–$4.4 billion in long-term debt,
of Capitalization $22.4 million in minority interests, $190.0 million in preference stock and $4.9 billion in com-
mon shareholders’ equity.
78-81 Baltimore Gas and Elec- We include financial statements for BGE because it is a separate registrant required to file
tric Financial Statements reports with the SEC.
NOTES TO OUR FINANCIAL STATEMENTS
THE DETAILS. We explain the processes, events, actions, projects, issues and specifics that produce the amounts reflected in
our financial statements.
HIGHLIGHTS OF WHAT YOU’LL FIND
HERE’S WHERE YOU LOOK IN PART ll
PAGES ITEM SECTION
82-92 NOTE 1: Significant Accounting methods that we use and how they’re applied throughout our businesses, along
Accounting Policies with the new accounting standards issued and adopted.
93-95 NOTE 2: Other Events In 2005, other events added $23.6 million to our pre-tax earnings, reflecting $45.0 million in
income from discontinued operations offset by $17.0 million in merger-related transaction
costs and $4.4 million in workforce reduction costs.
NOTE: This special section is intended to be a guide. You can find more details about all these items in our Form 10-K. Our Form 10-K follows this special section.
30
33. U N D E R S TA N D I N G O U R F O R M 1 0 - K
NOTES TO OUR FINANCIAL STATEMENTS (continued)
HIGHLIGHTS OF WHAT YOU’LL FIND
HERE’S WHERE YOU LOOK IN PART ll
PAGES ITEM SECTION
95-96 NOTE 3: Information by Our revenues, net income and other financial information broken out by operating segment
Operating Segment show the growth of our merchant energy business.
97-99 NOTE 4: Investments Our investments are mainly financial investments related to our nuclear decommissioning
trust funds.
100 NOTE 5: Intangible At December 31, 2005, our carrying amount of goodwill was $147.1 million, and our net amount
Assets of amortizable intangible assets was $293.0 million.
101-102 NOTE 6: Regulatory Our total regulatory assets (net) were $154.3 million at December 31, 2005.
Assets (net)
102-105 NOTE 7: Pension, We provide details–obligations, assets, funded status, assumption details and company contri-
Postretirement, Other butions–about our employee benefit plans.
Postemployment, and
Employee Savings Plan
Benefits
106 NOTE 8: Credit Facilities Our short-term borrowings–debt that matures within one year from the date it’s issued – may
and Short-Term include bank loans, commercial paper and bank lines of credit.
Borrowings
106-108 NOTE 9: Long-Term Debt We provide details about our long-term debt–debt that matures a year or more from the date
and Preference Stock it’s issued–and about our preference stock.
109-110 NOTE 10: Taxes Our income tax expense for 2005 was $204.1 million, which reflected the favorable impact of
$114.9 million of synthetic fuel tax credits.
111 NOTE 11: Leases Our lease expense was $128.0 million in 2005.
111-116 NOTE 12: Commit- We provide details about our commitments and financial guarantees, environmental matters,
ments, Guarantees and legal proceedings involving us and our insurance coverage.
Contingencies
116-117 NOTE 13: Hedging We explain how we manage interest rate exposure and commodity price fluctuations and
Activities and Fair disclose the fair value of our financial instruments.
Value of Financial
Instruments
118-119 NOTE 14: Stock-Based We provide stock-based compensation in the form of stock options, restricted stock,
Compensation performance-based units and equity to employees.
120-121 NOTE 15: Merger and We entered into an Agreement and Plan of Merger with FPL Group and are working to obtain all
Acquisitions necessary approvals before the end of 2006. We also acquired Cogenex and working interests
in gas-producing fields in Texas and Alabama.
122 NOTE 16: Related Party Our merchant energy business provides BGE with a portion of the energy it needs and we
Transactions–BGE provide BGE with the services of certain corporate functions.
123-124 NOTE 17: Quarterly We break out our financial results–and those of BGE–by quarter for the last two years.
Financial Data
(unaudited)
NOTE: This special section is intended to be a guide. You can find more details about all these items in our Form 10-K. Our Form 10-K follows this special section.
31