Download as PDF, PPTX

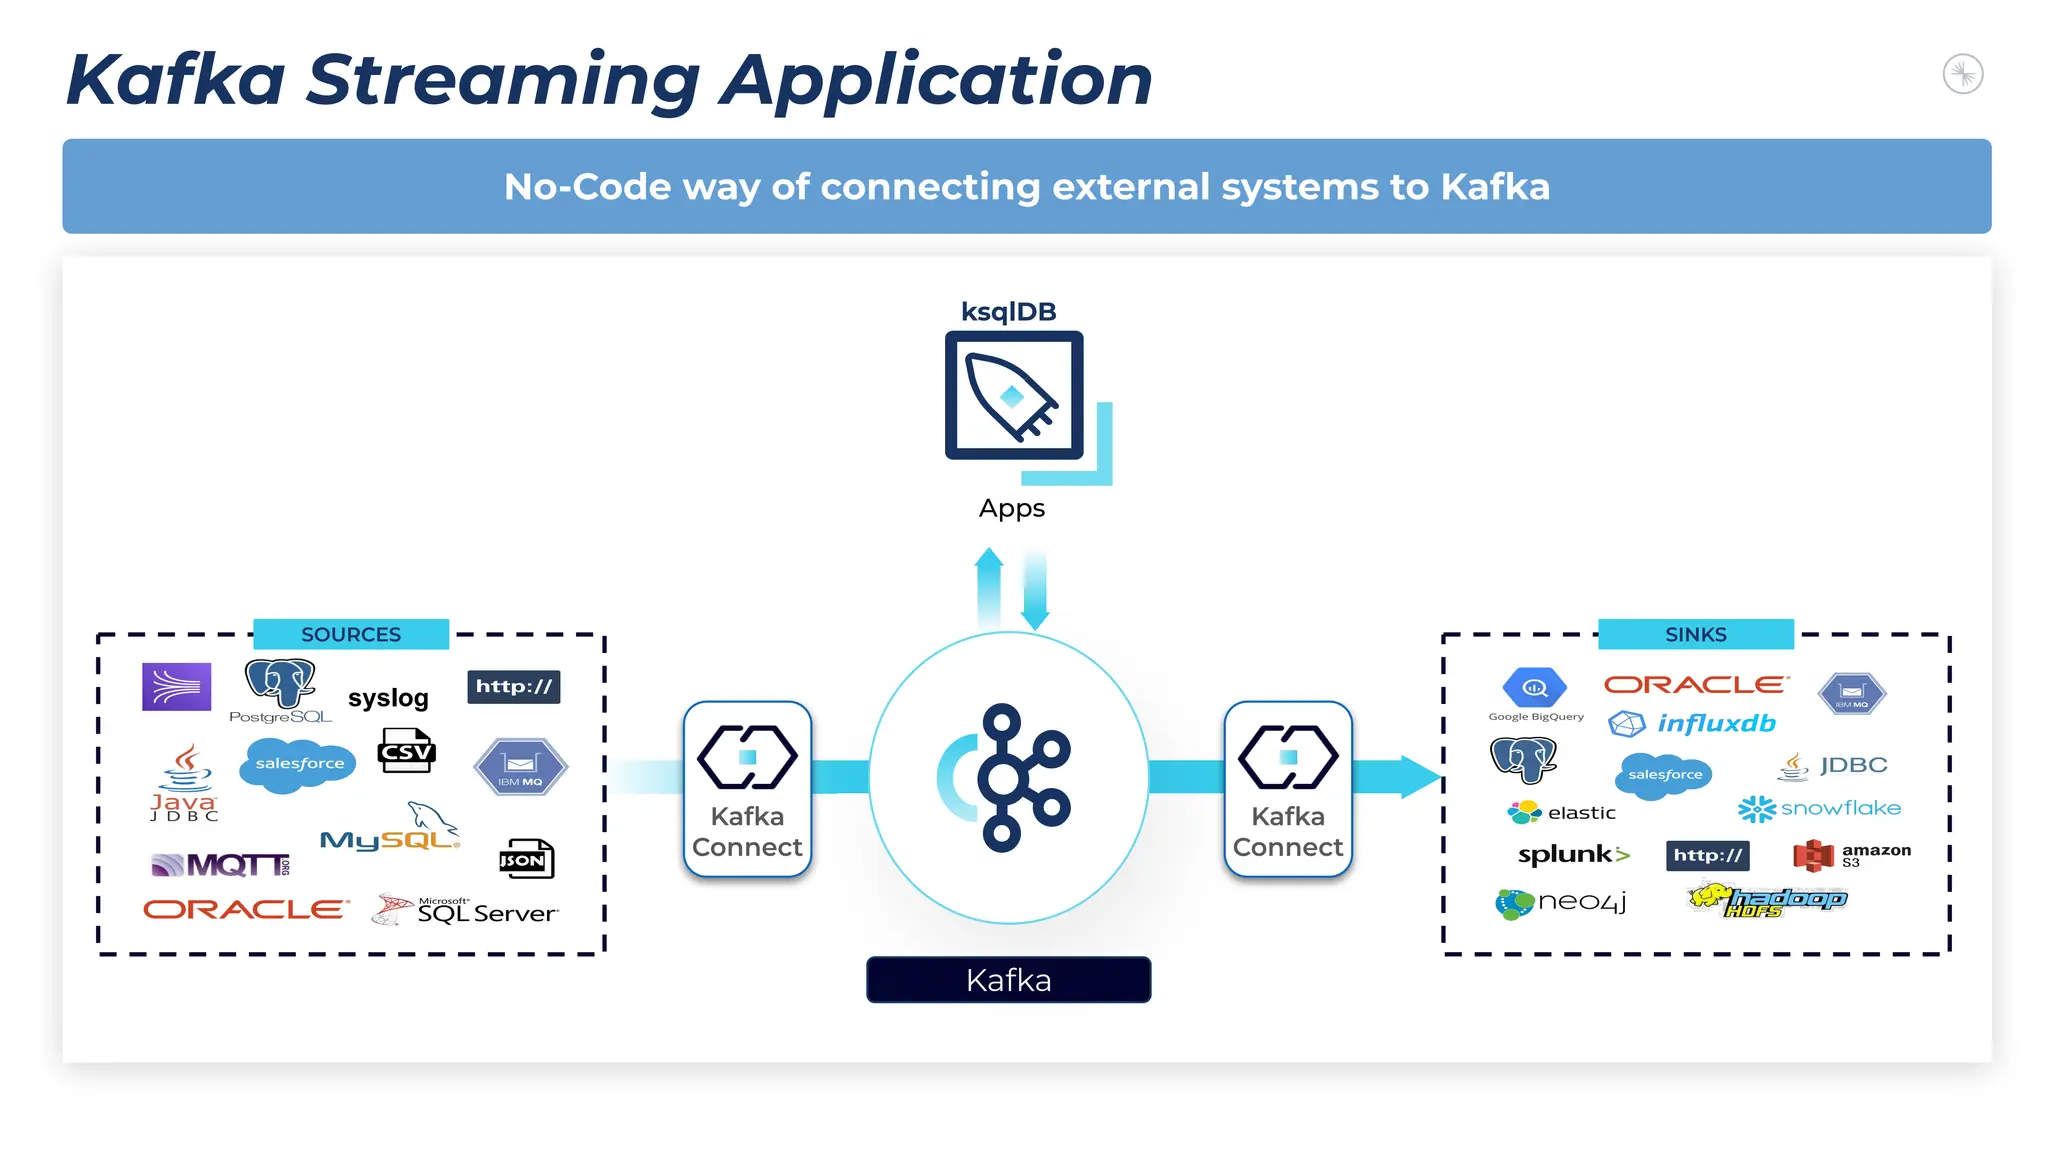
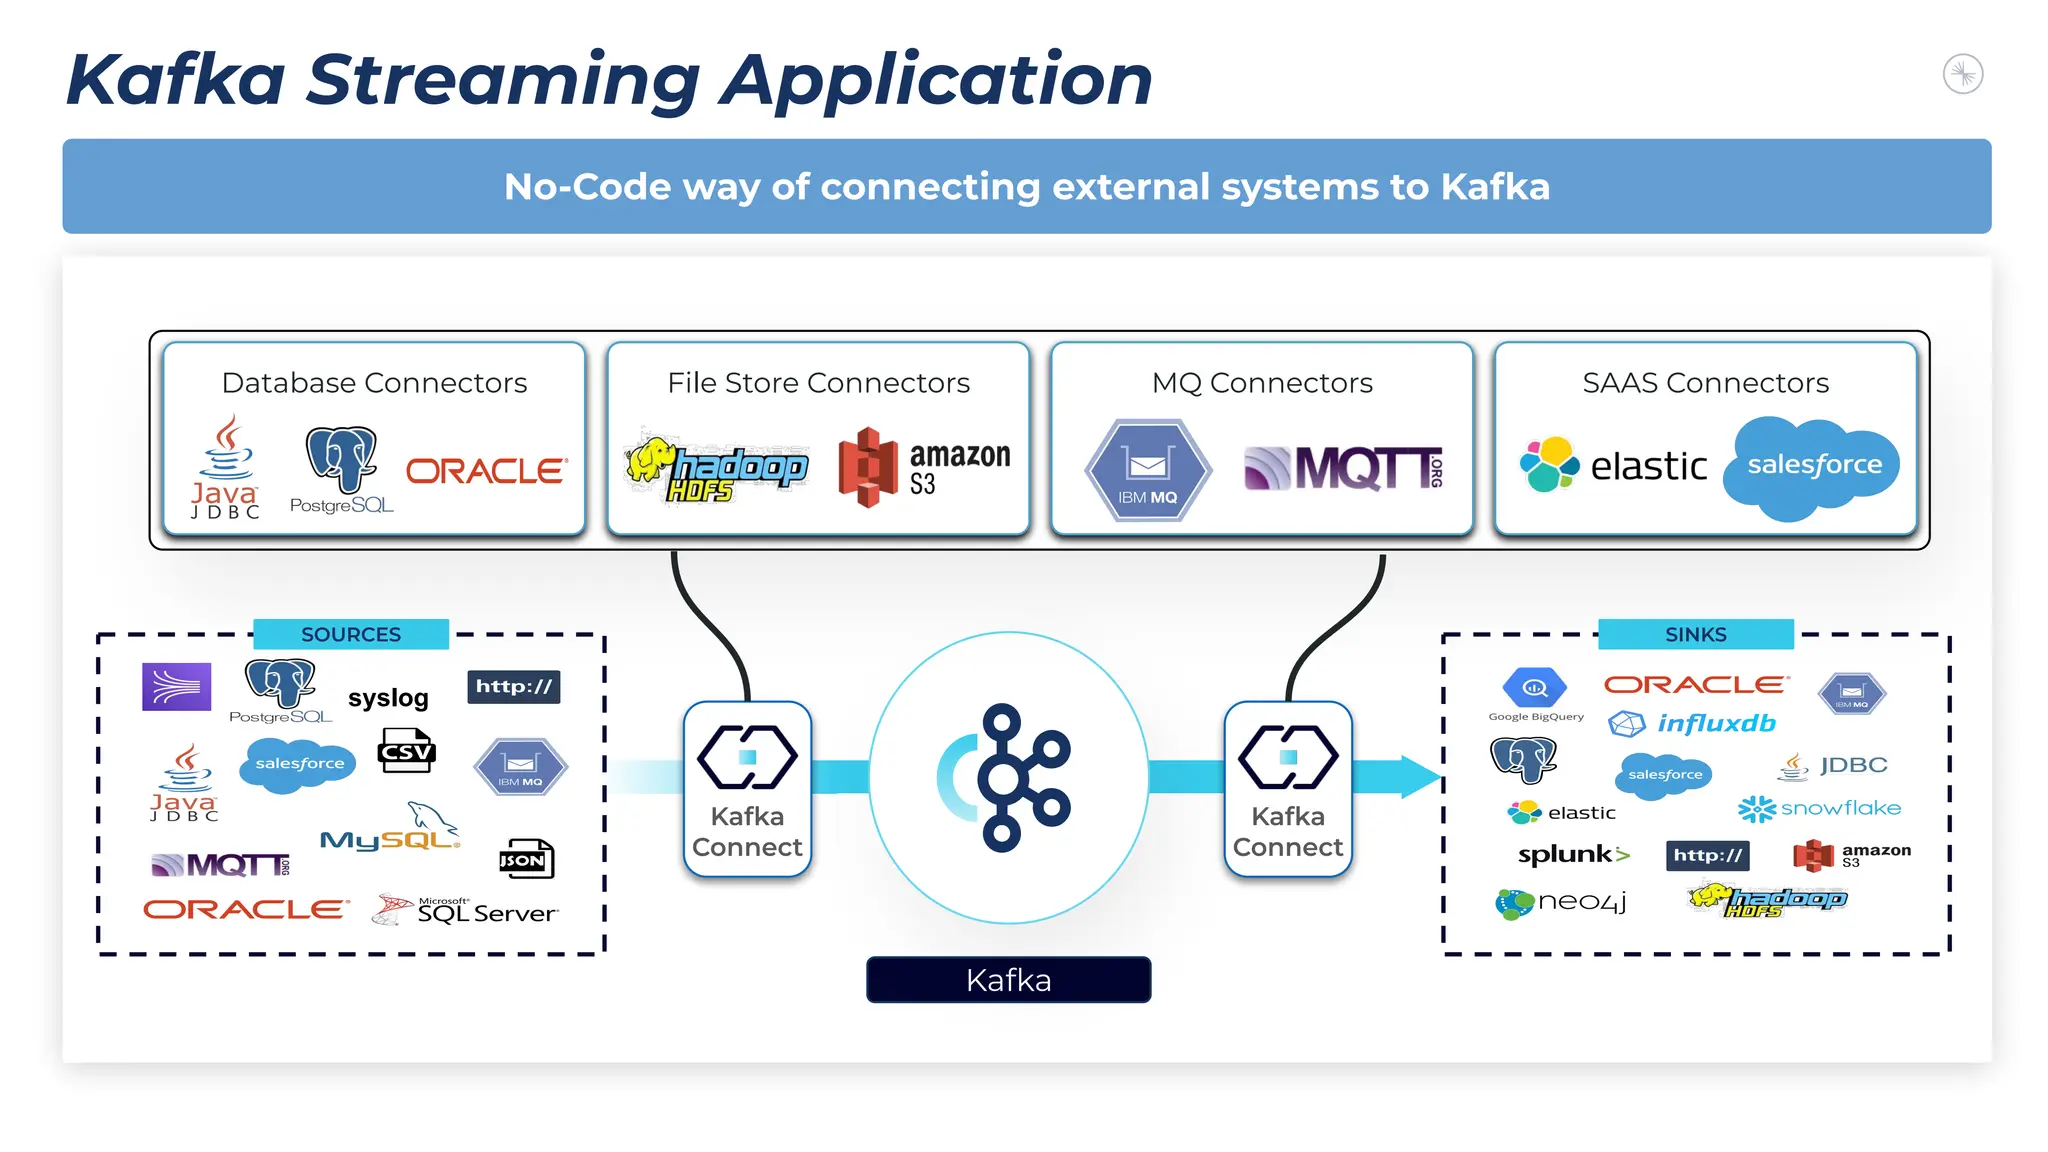
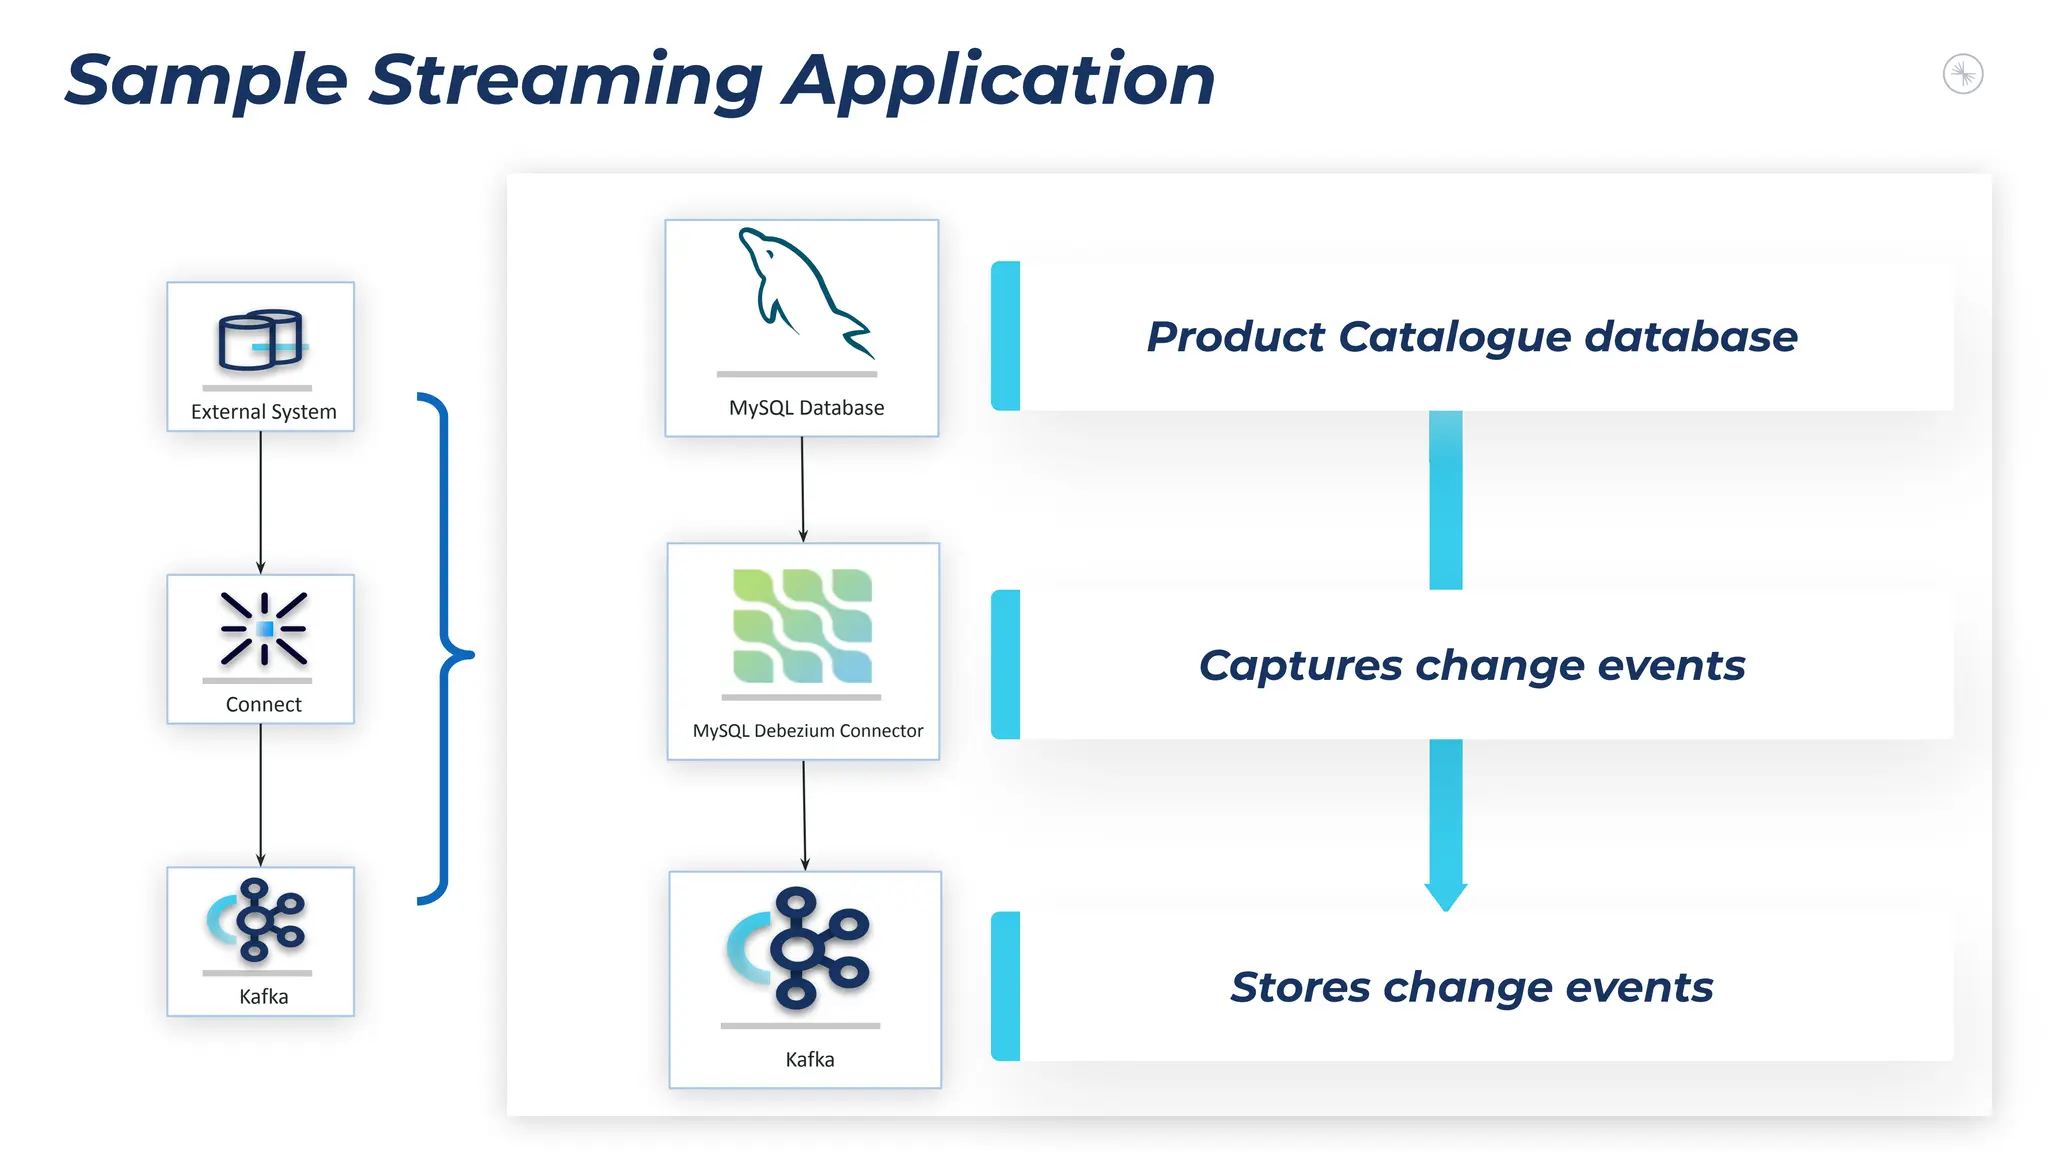
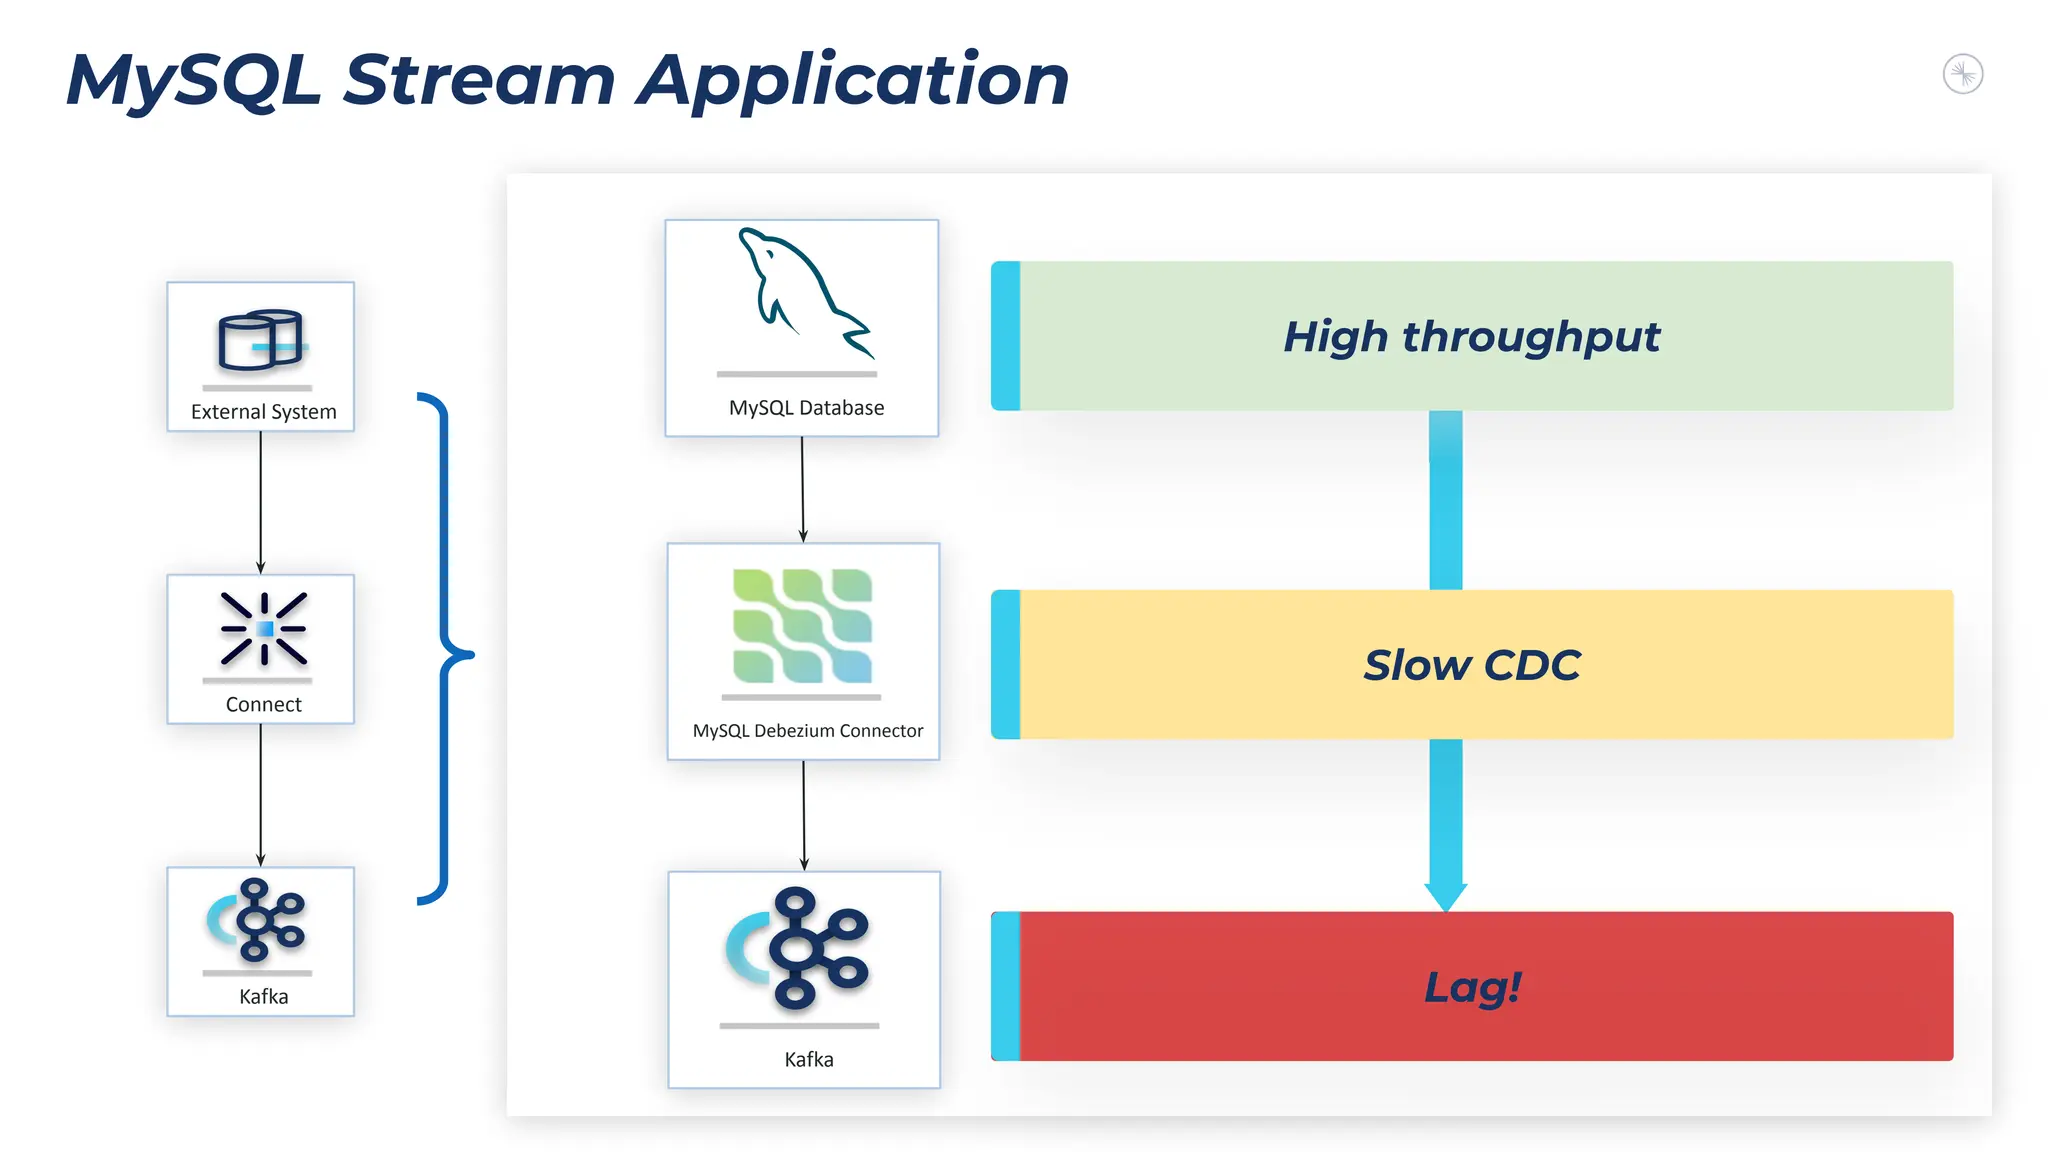
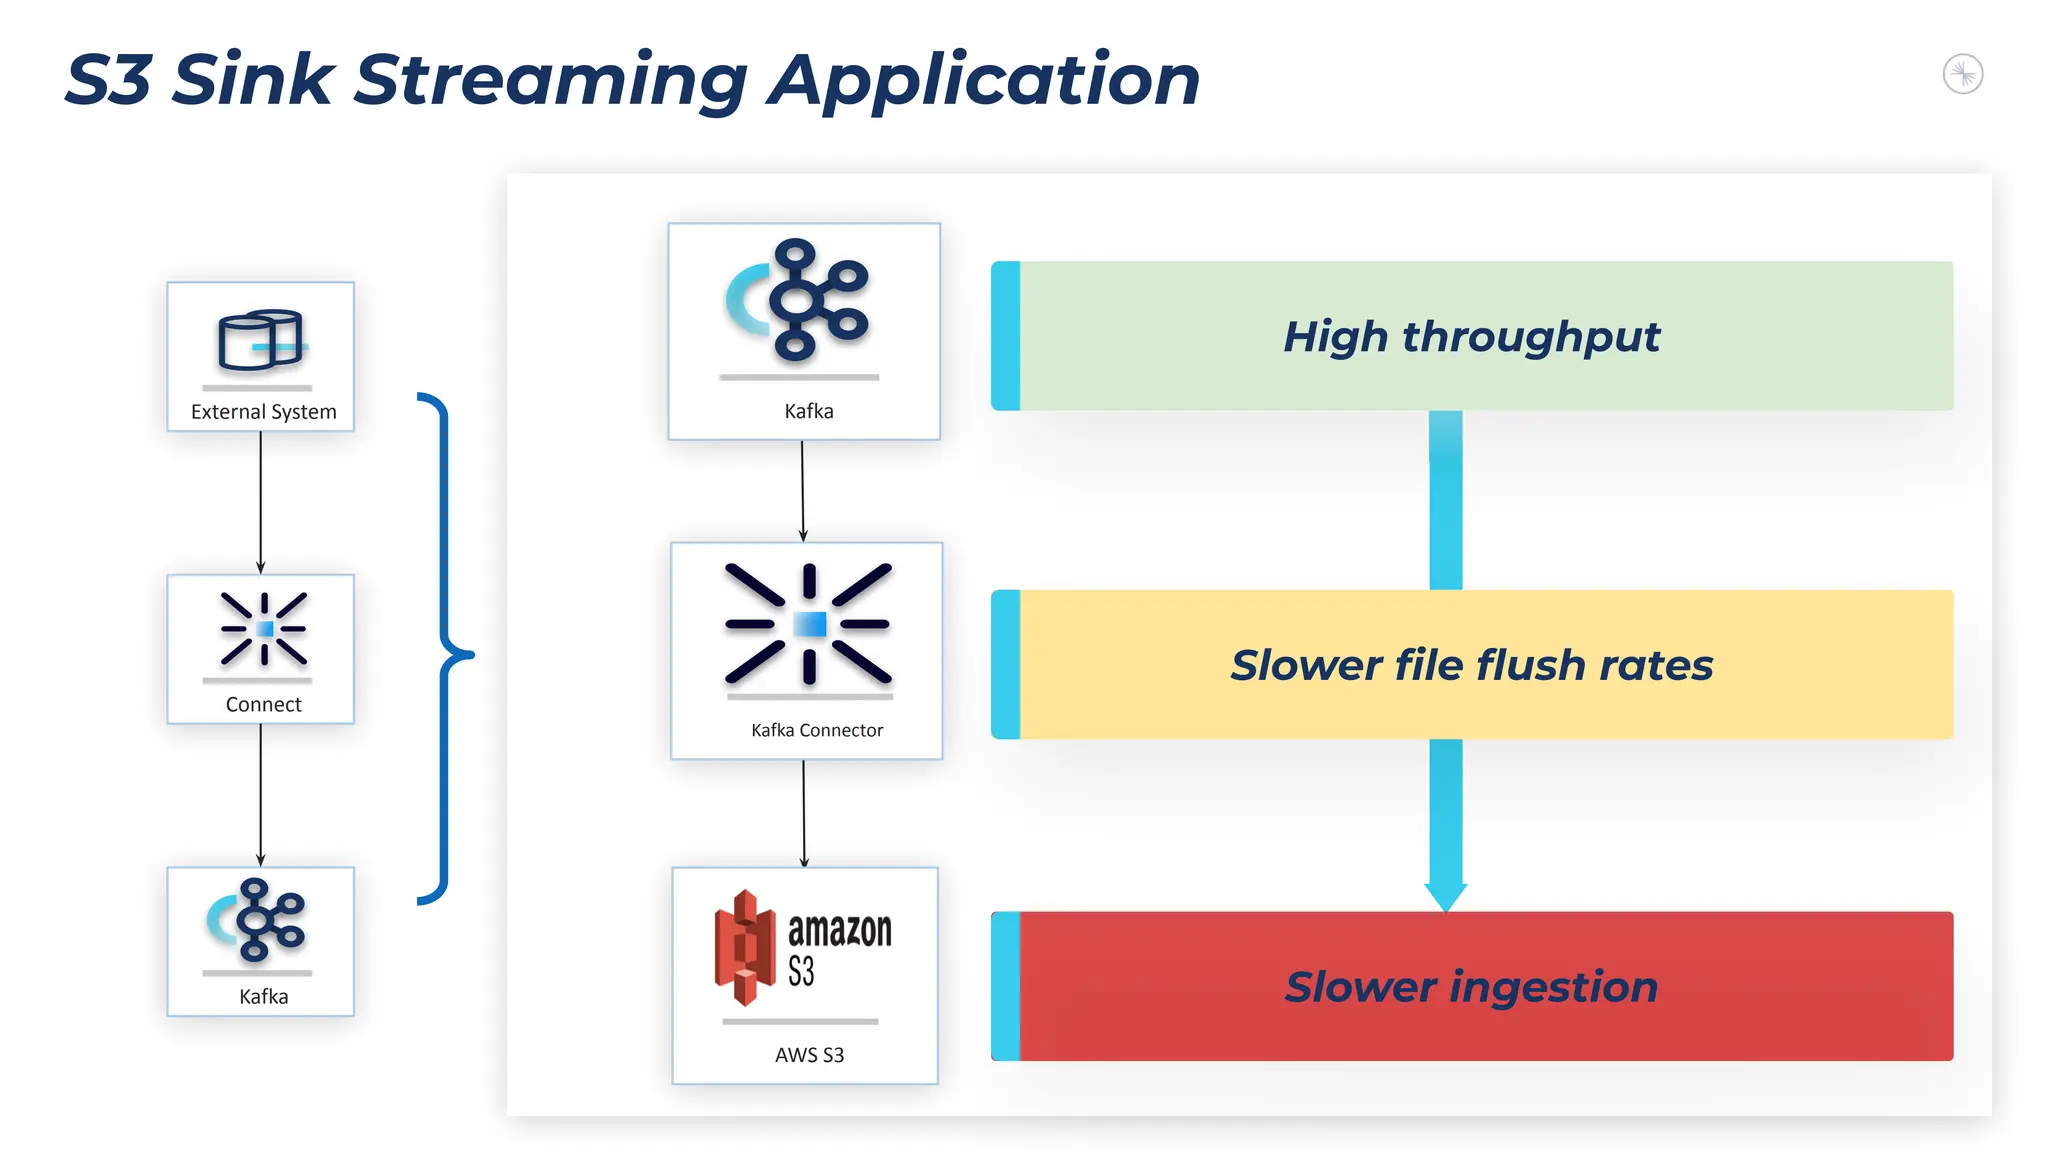
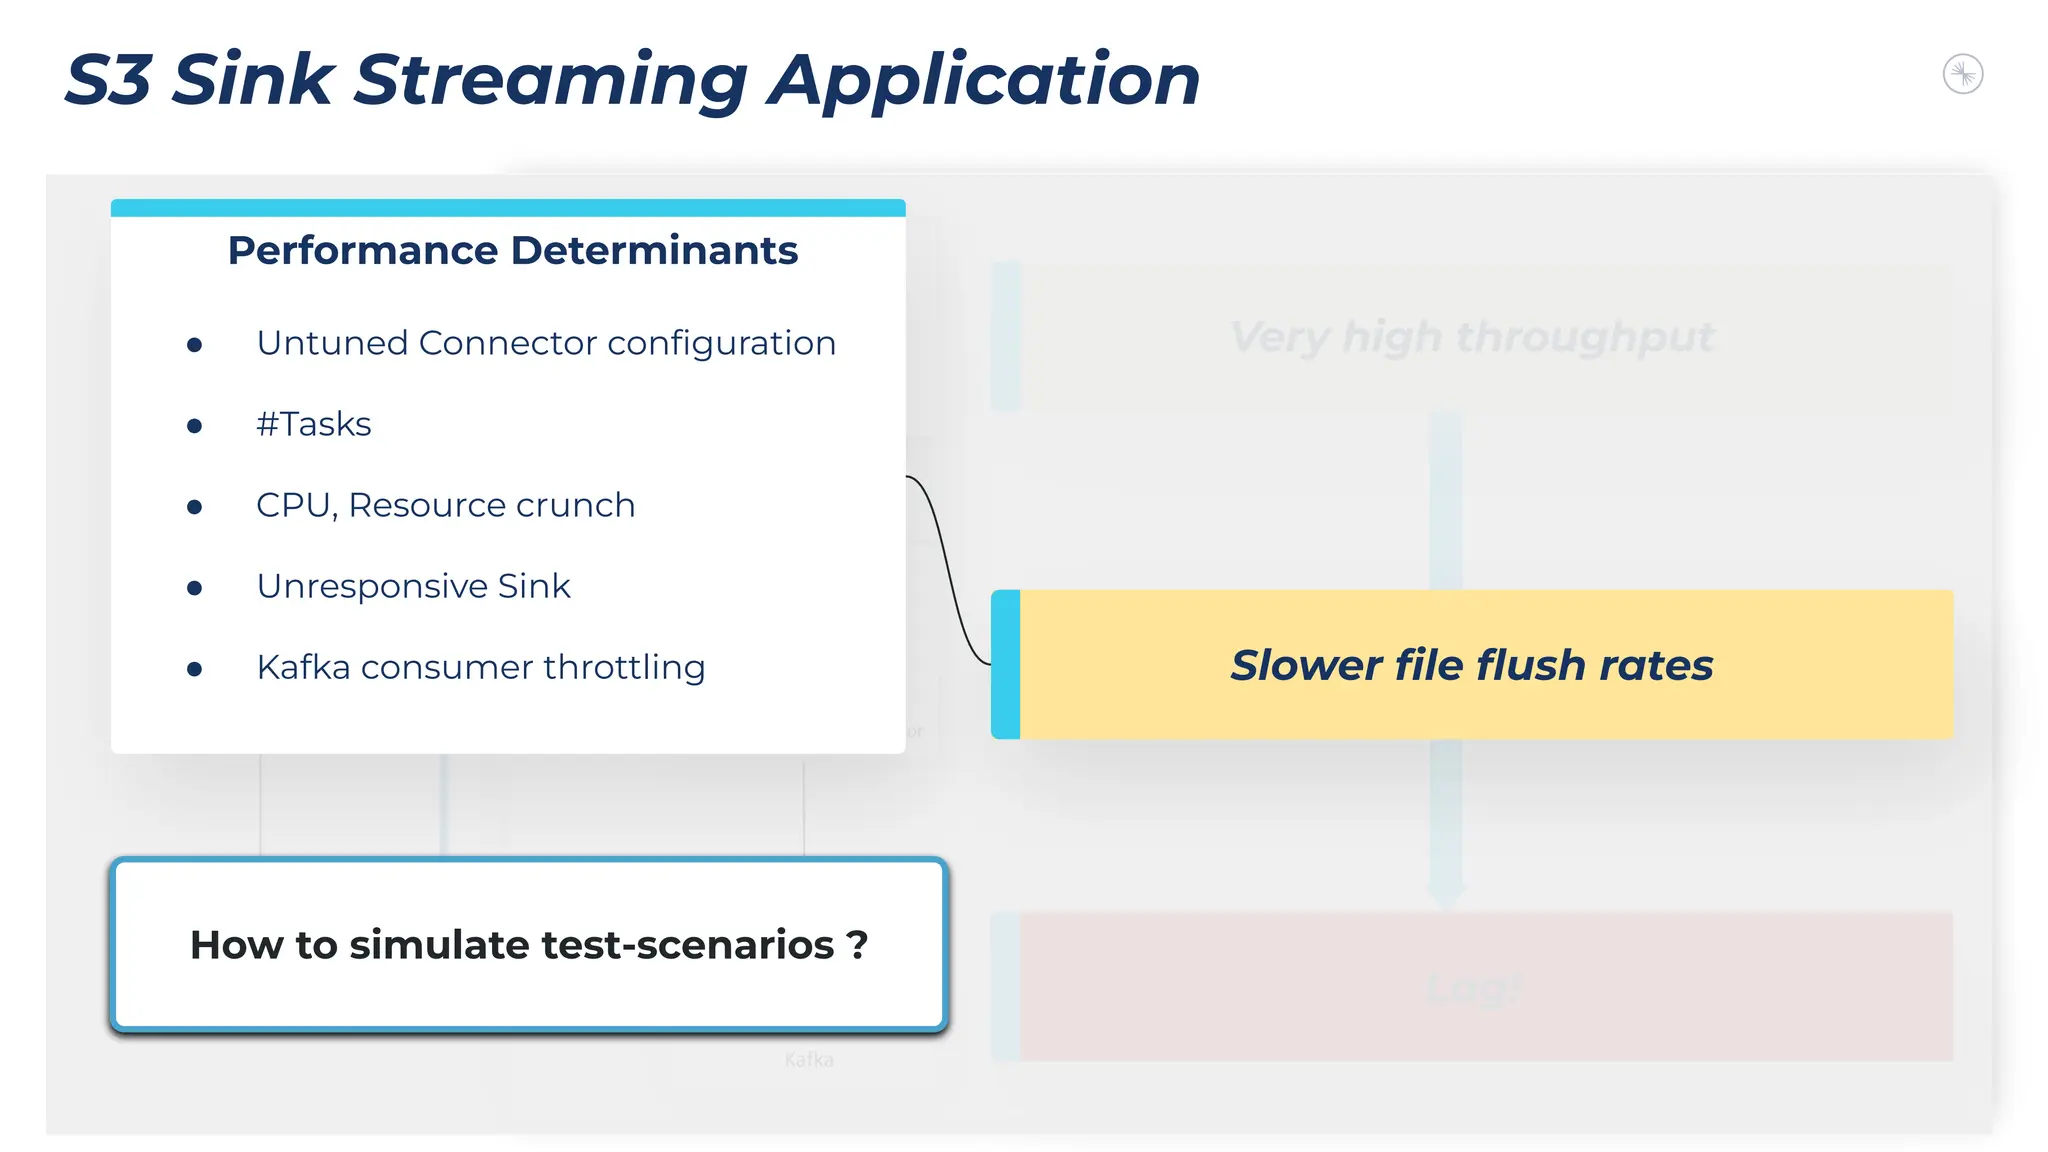
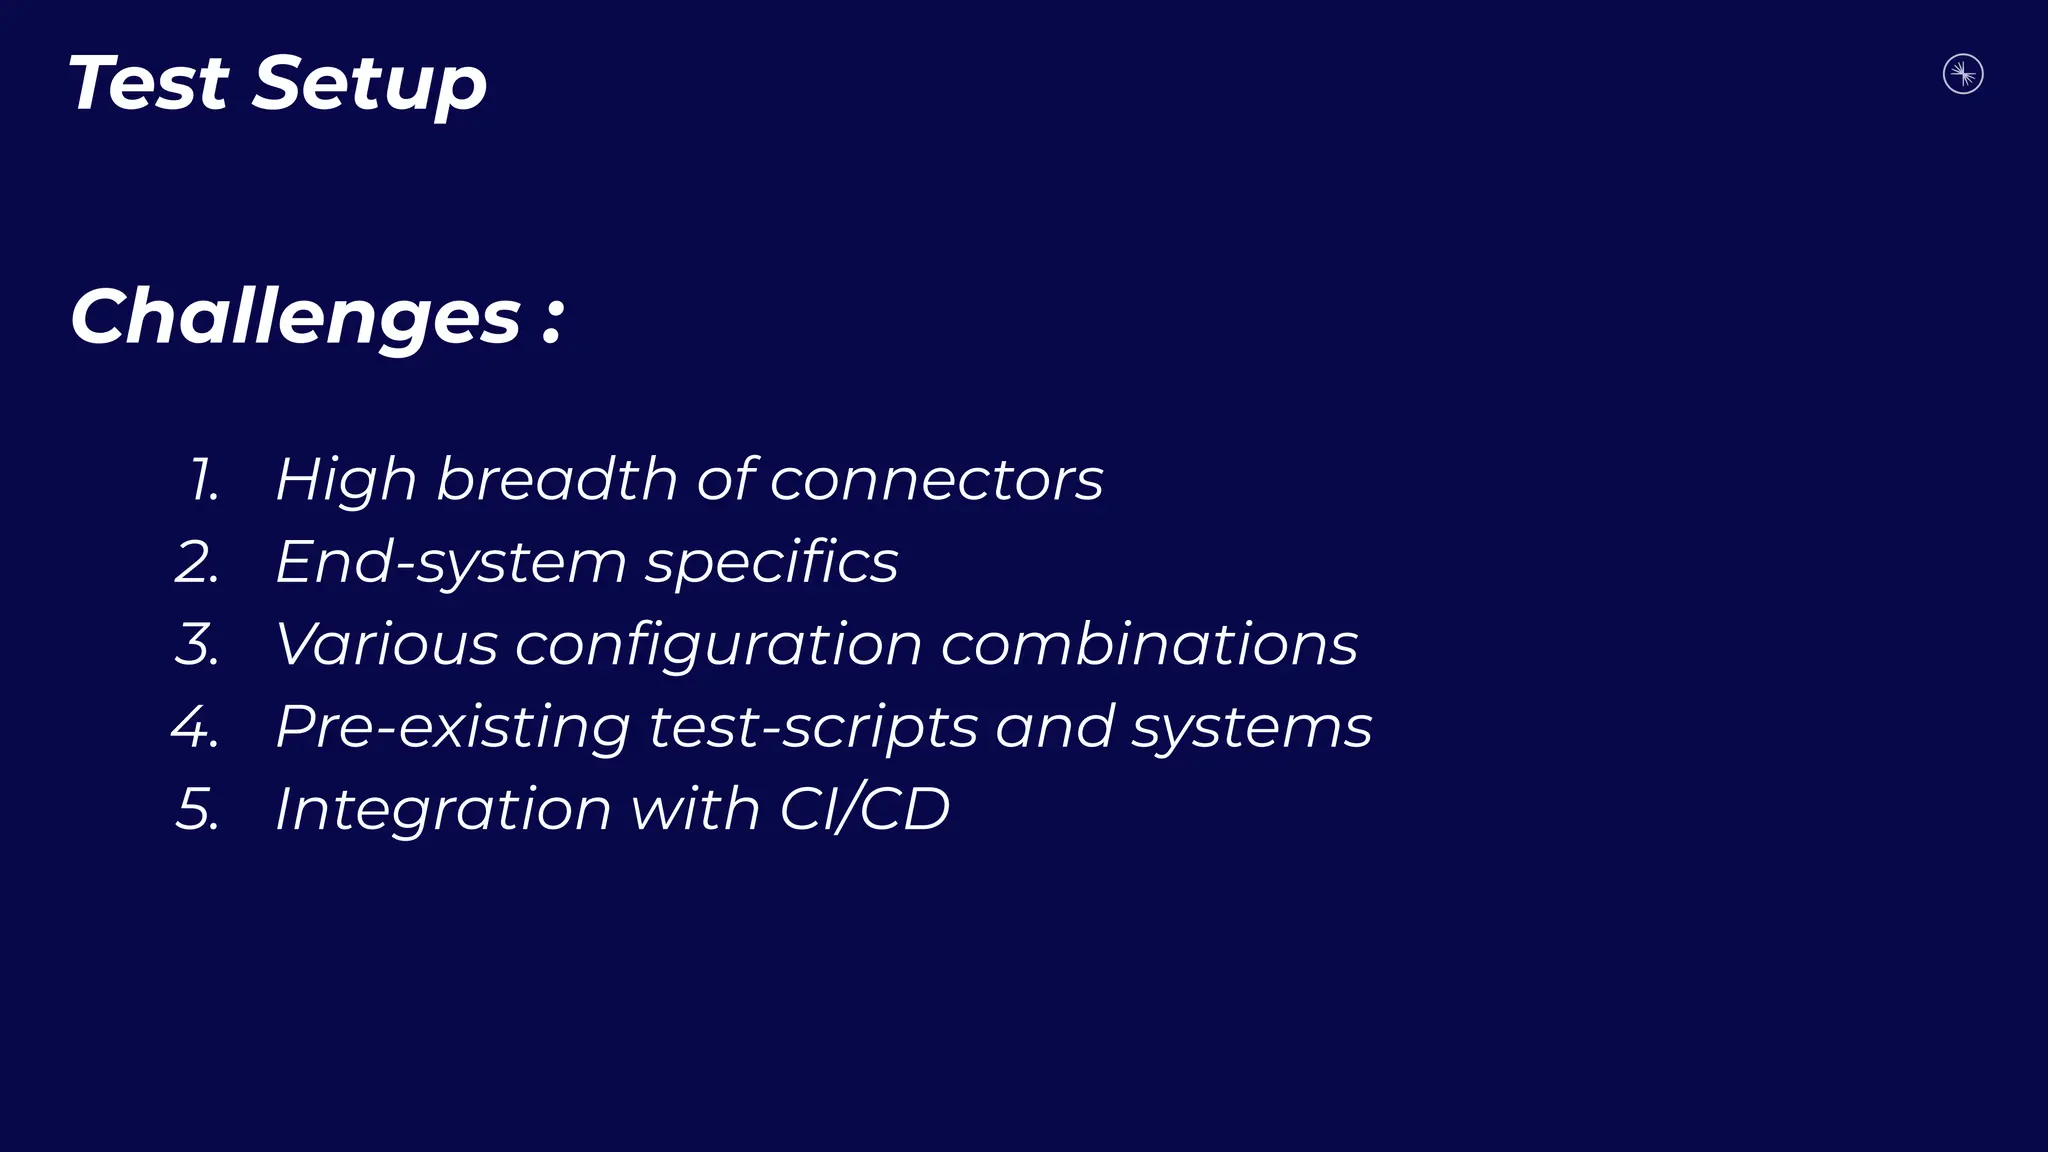
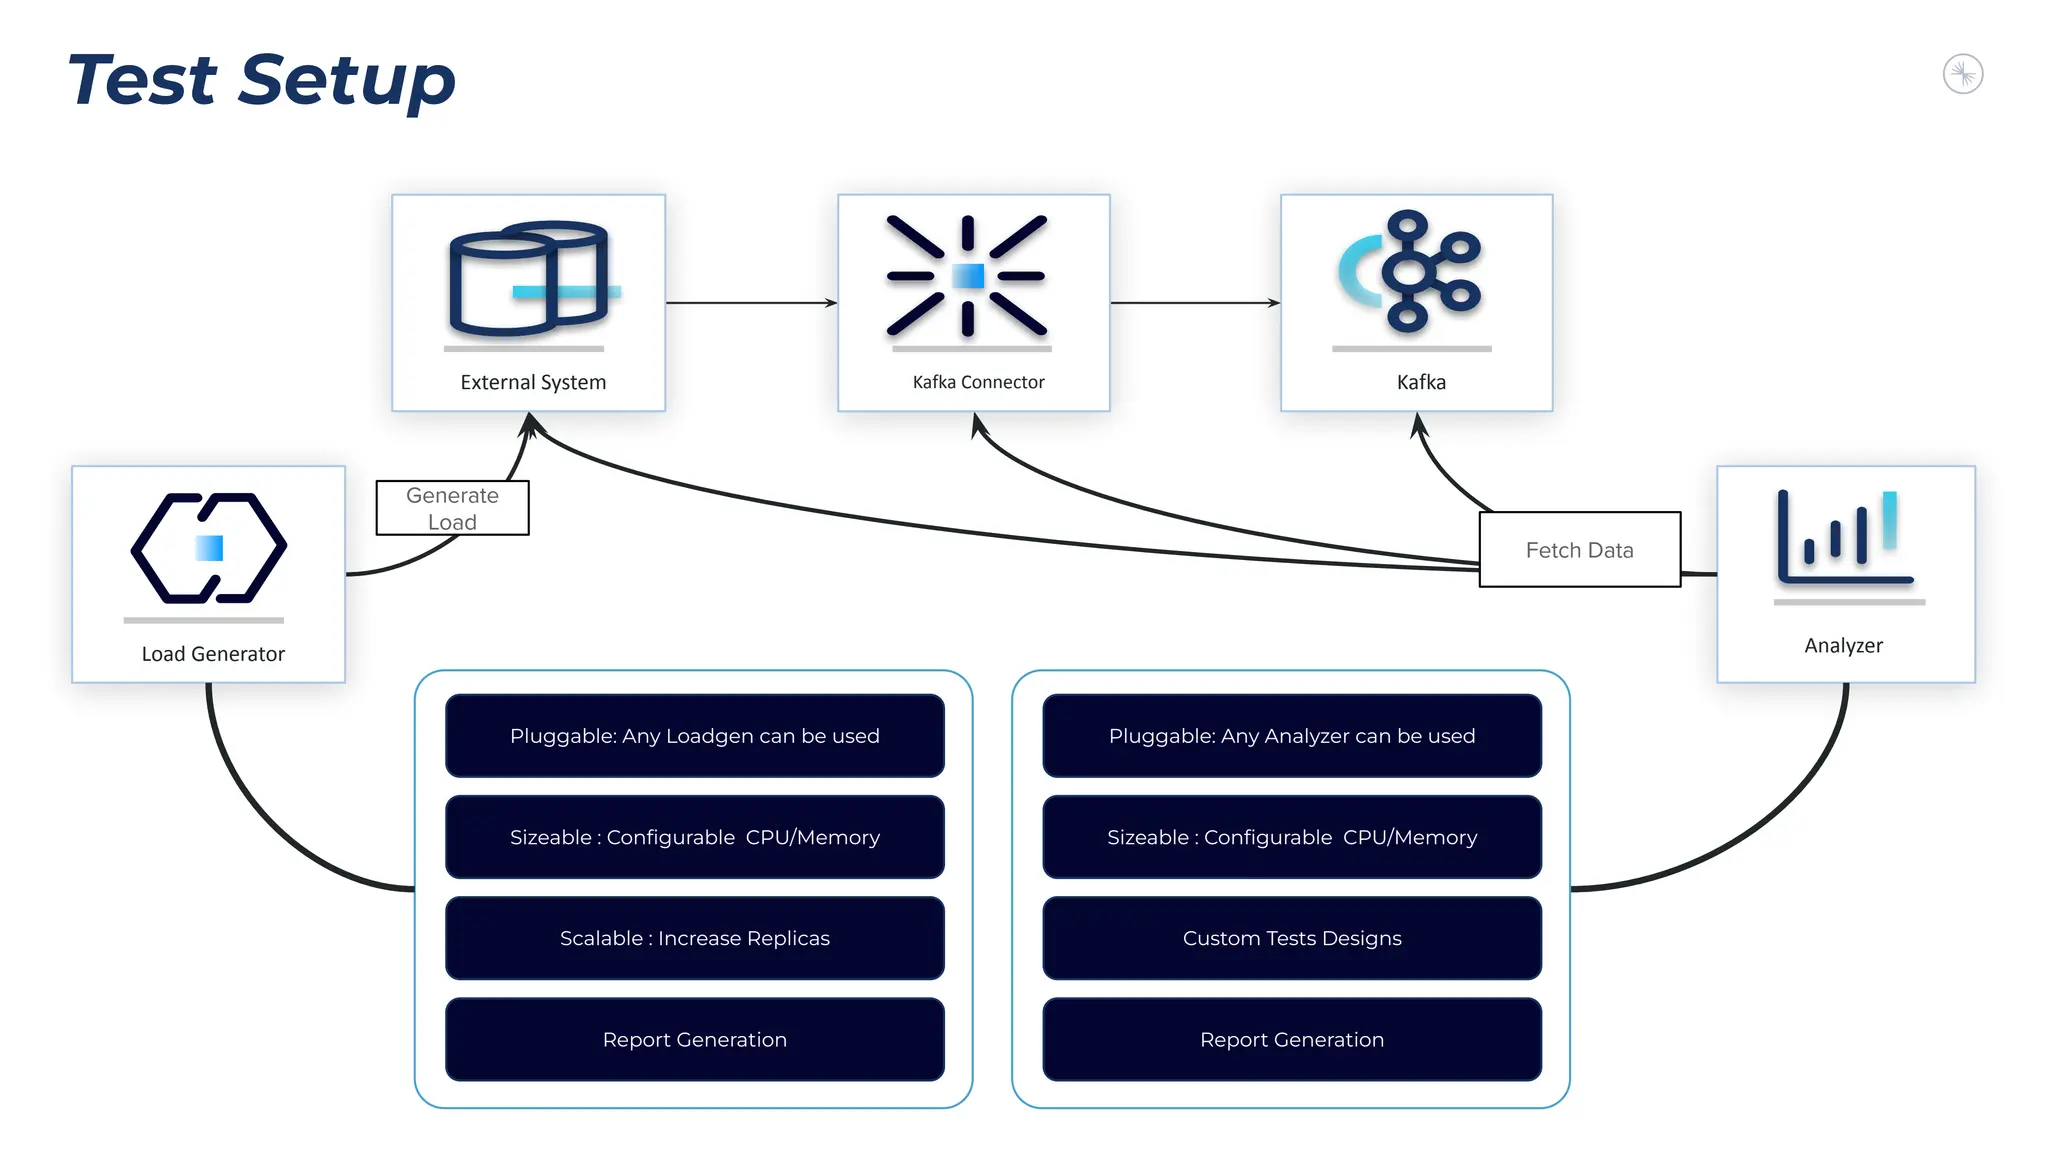
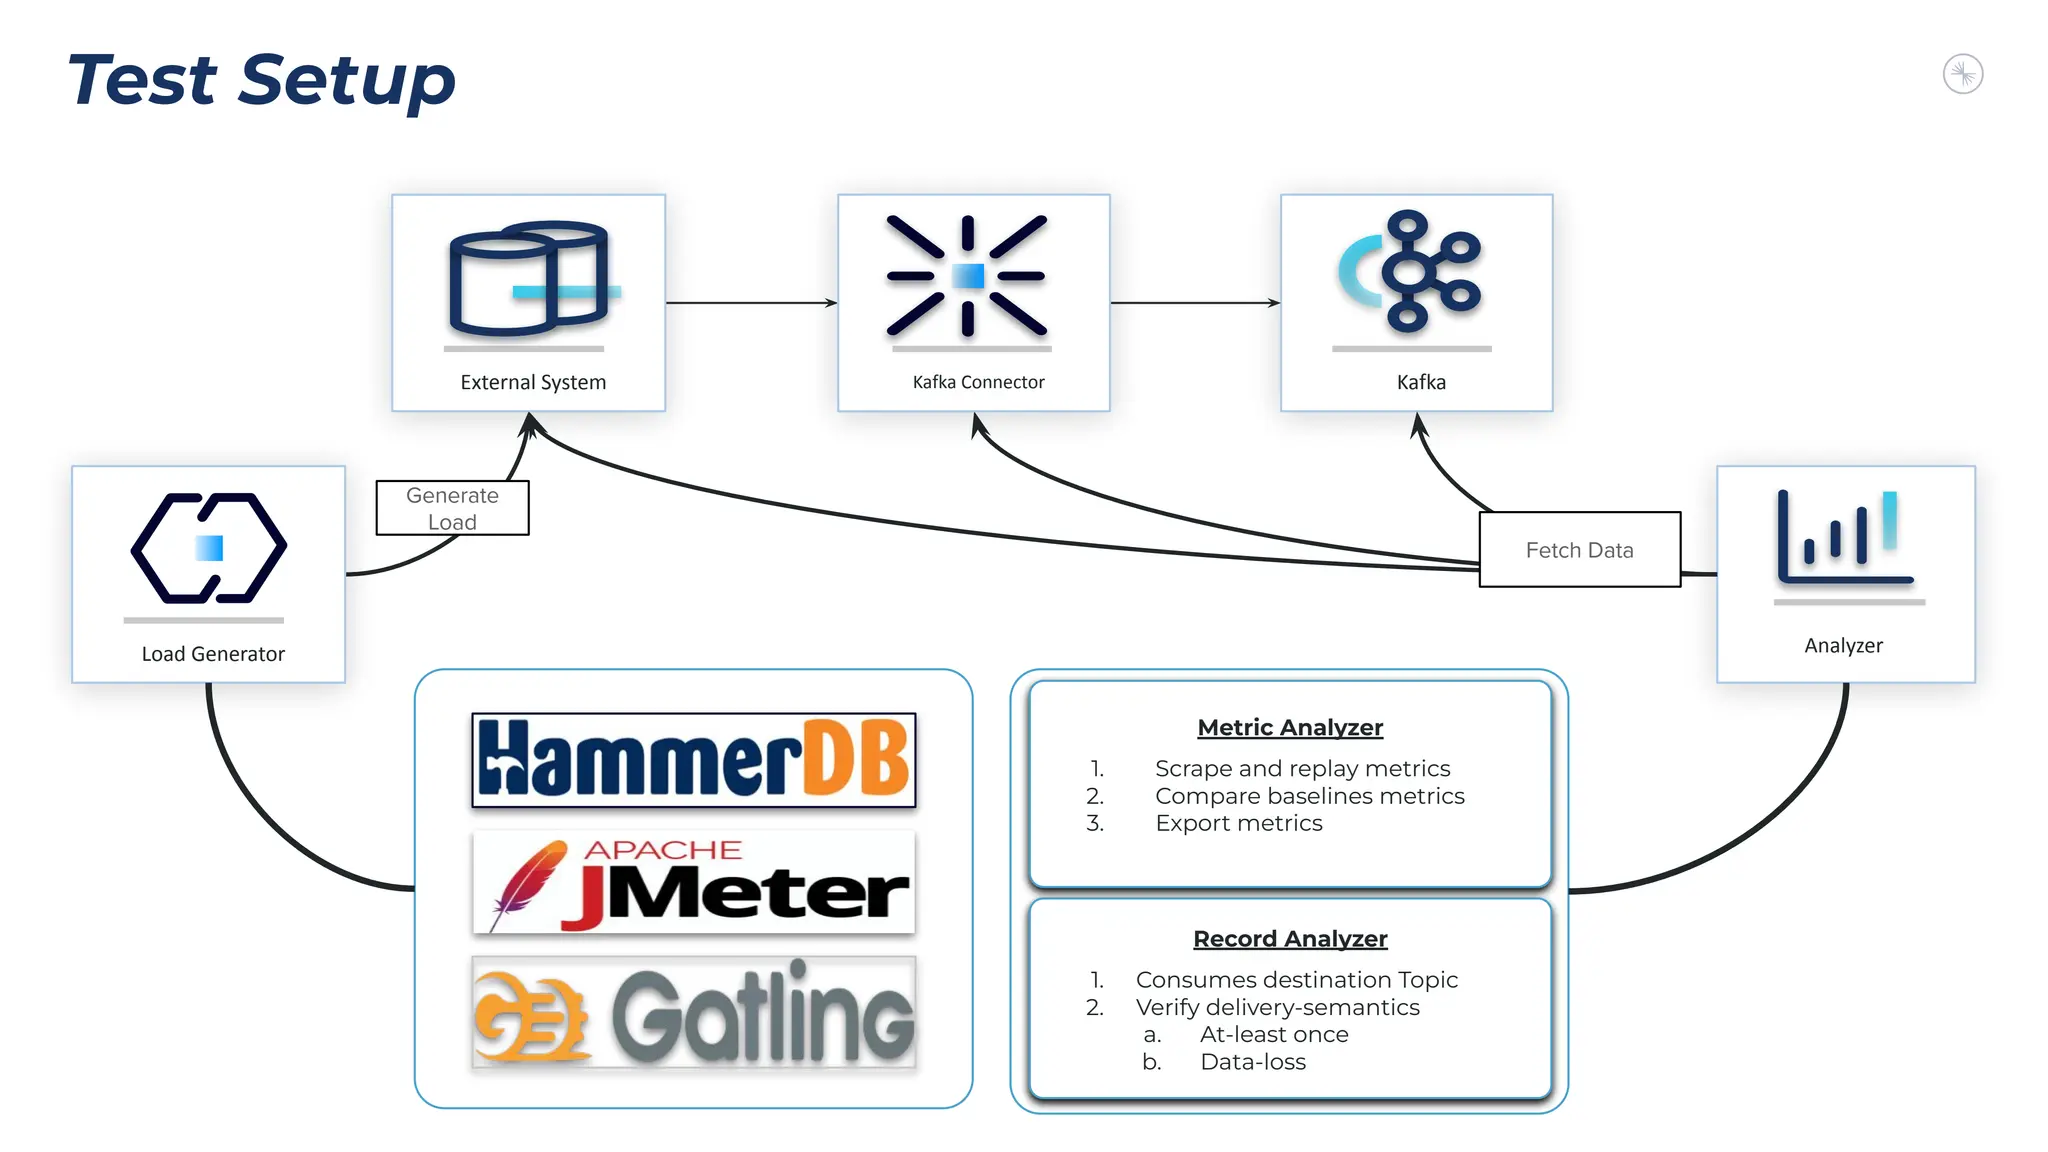
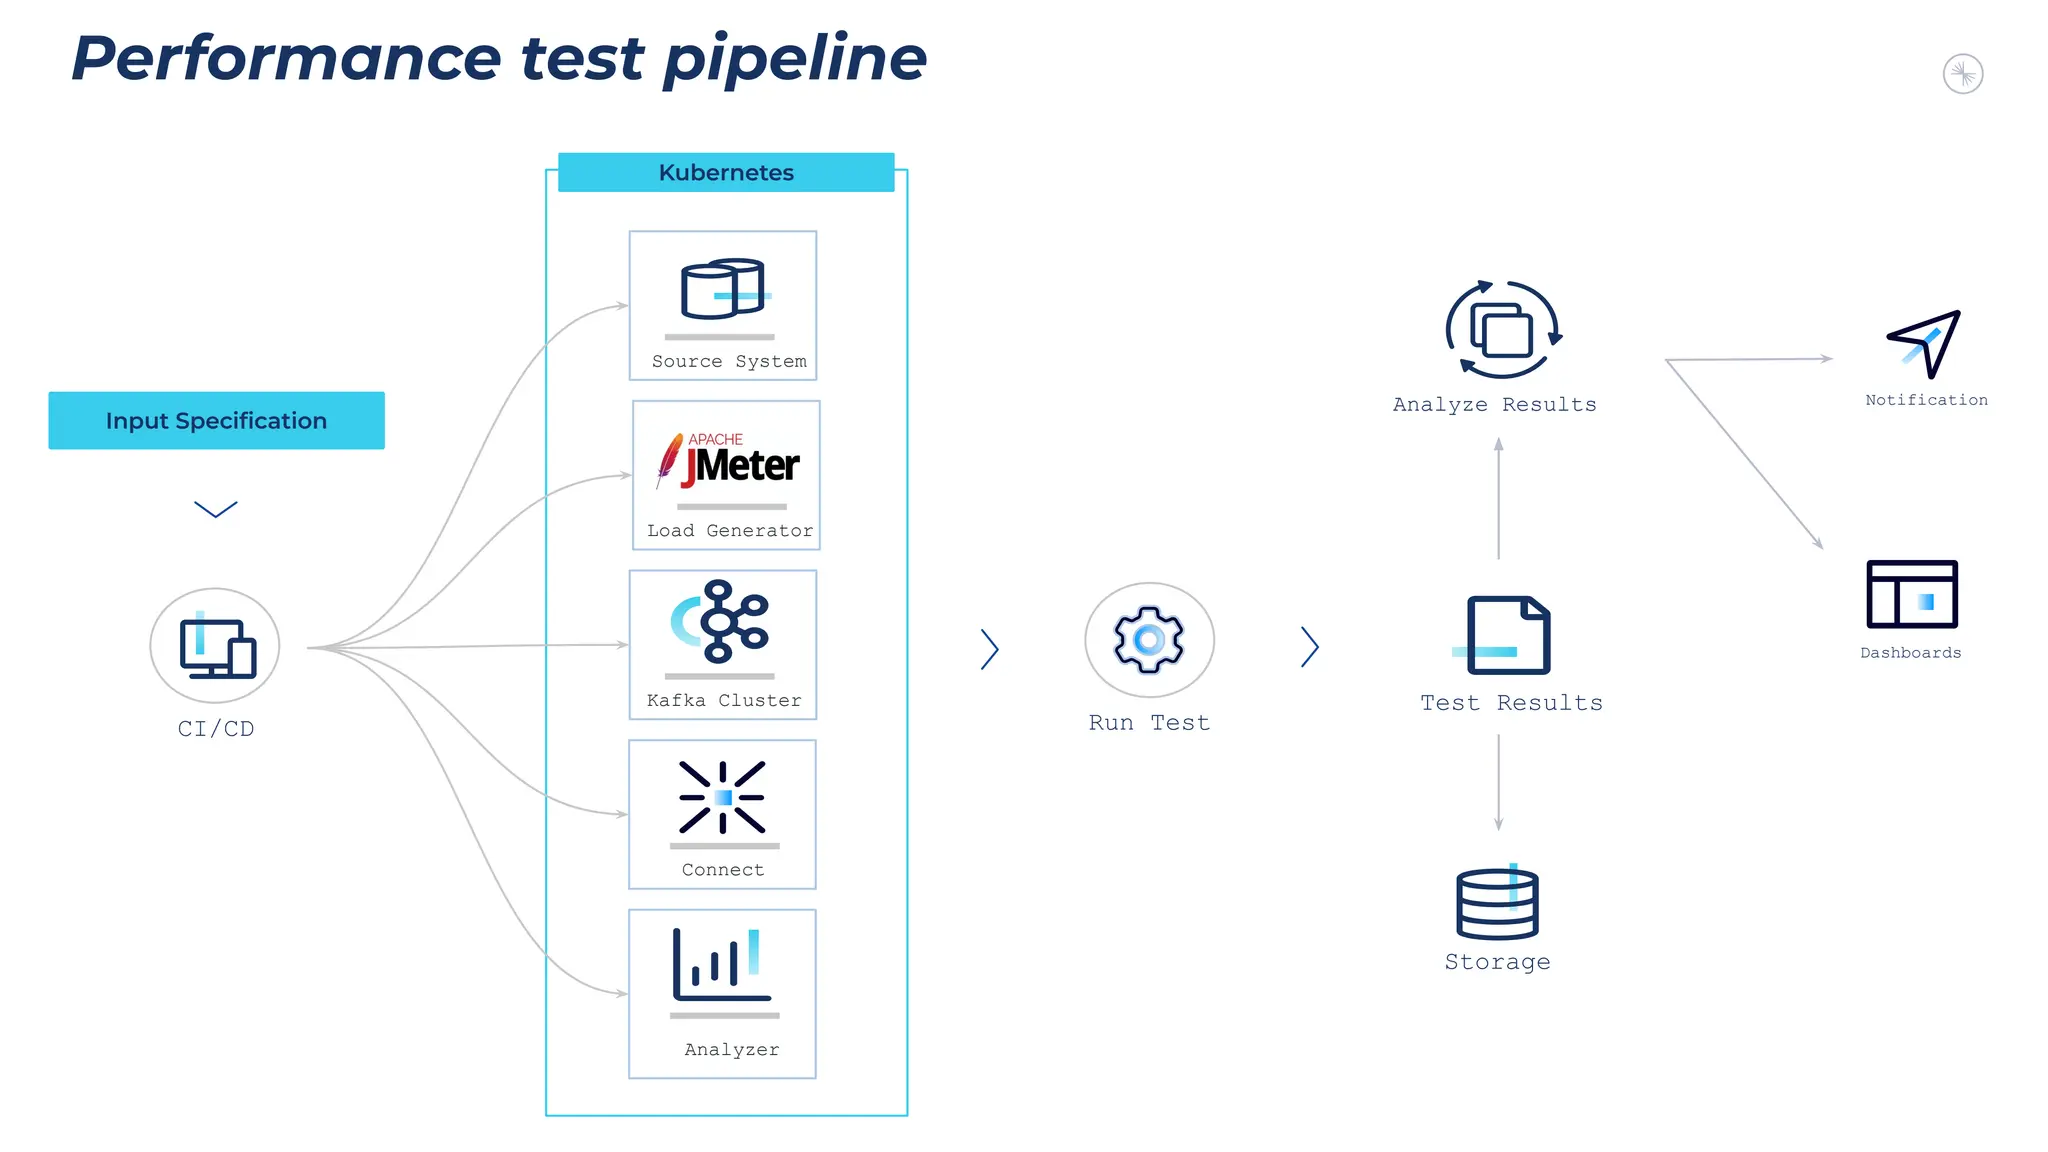
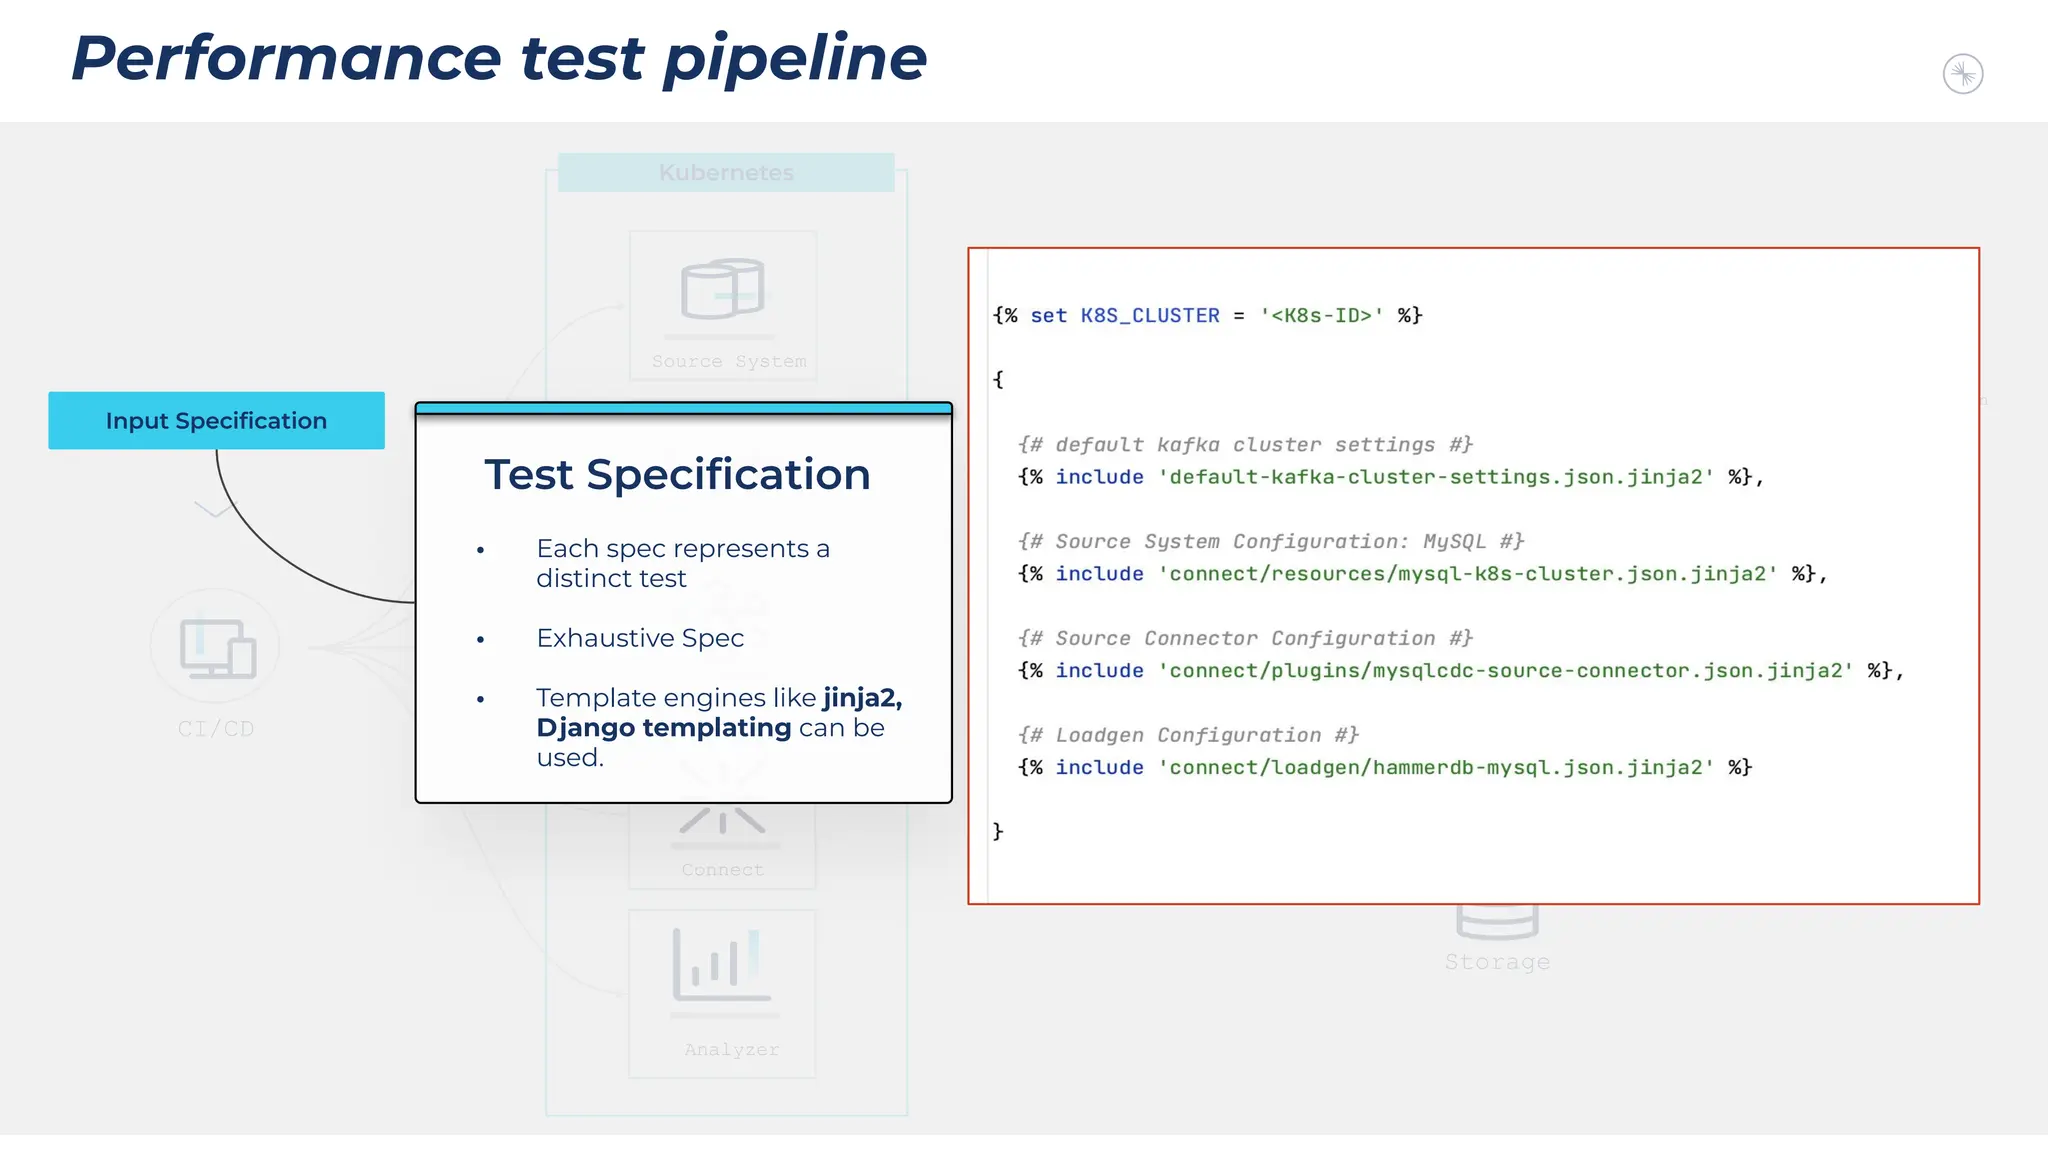
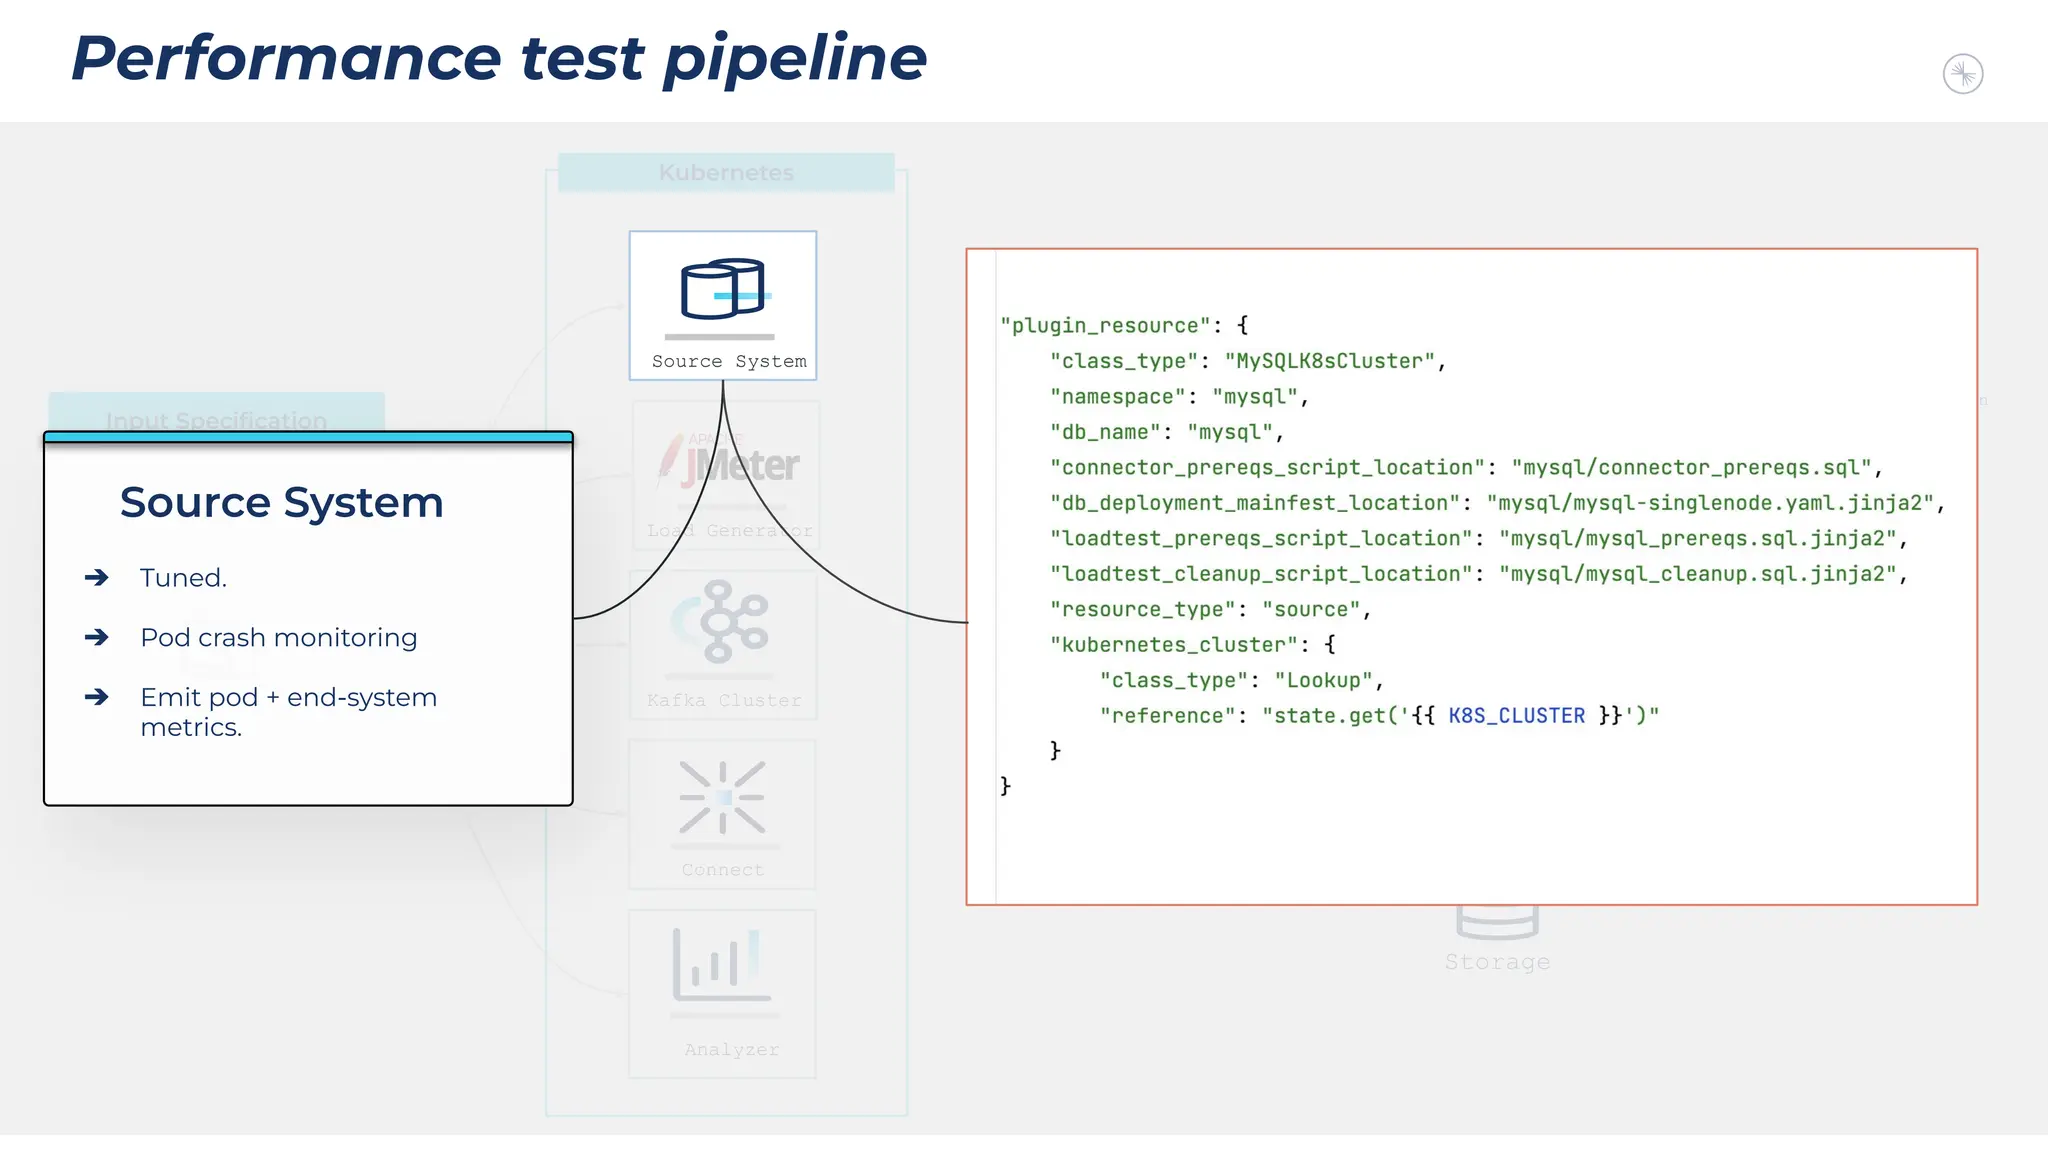
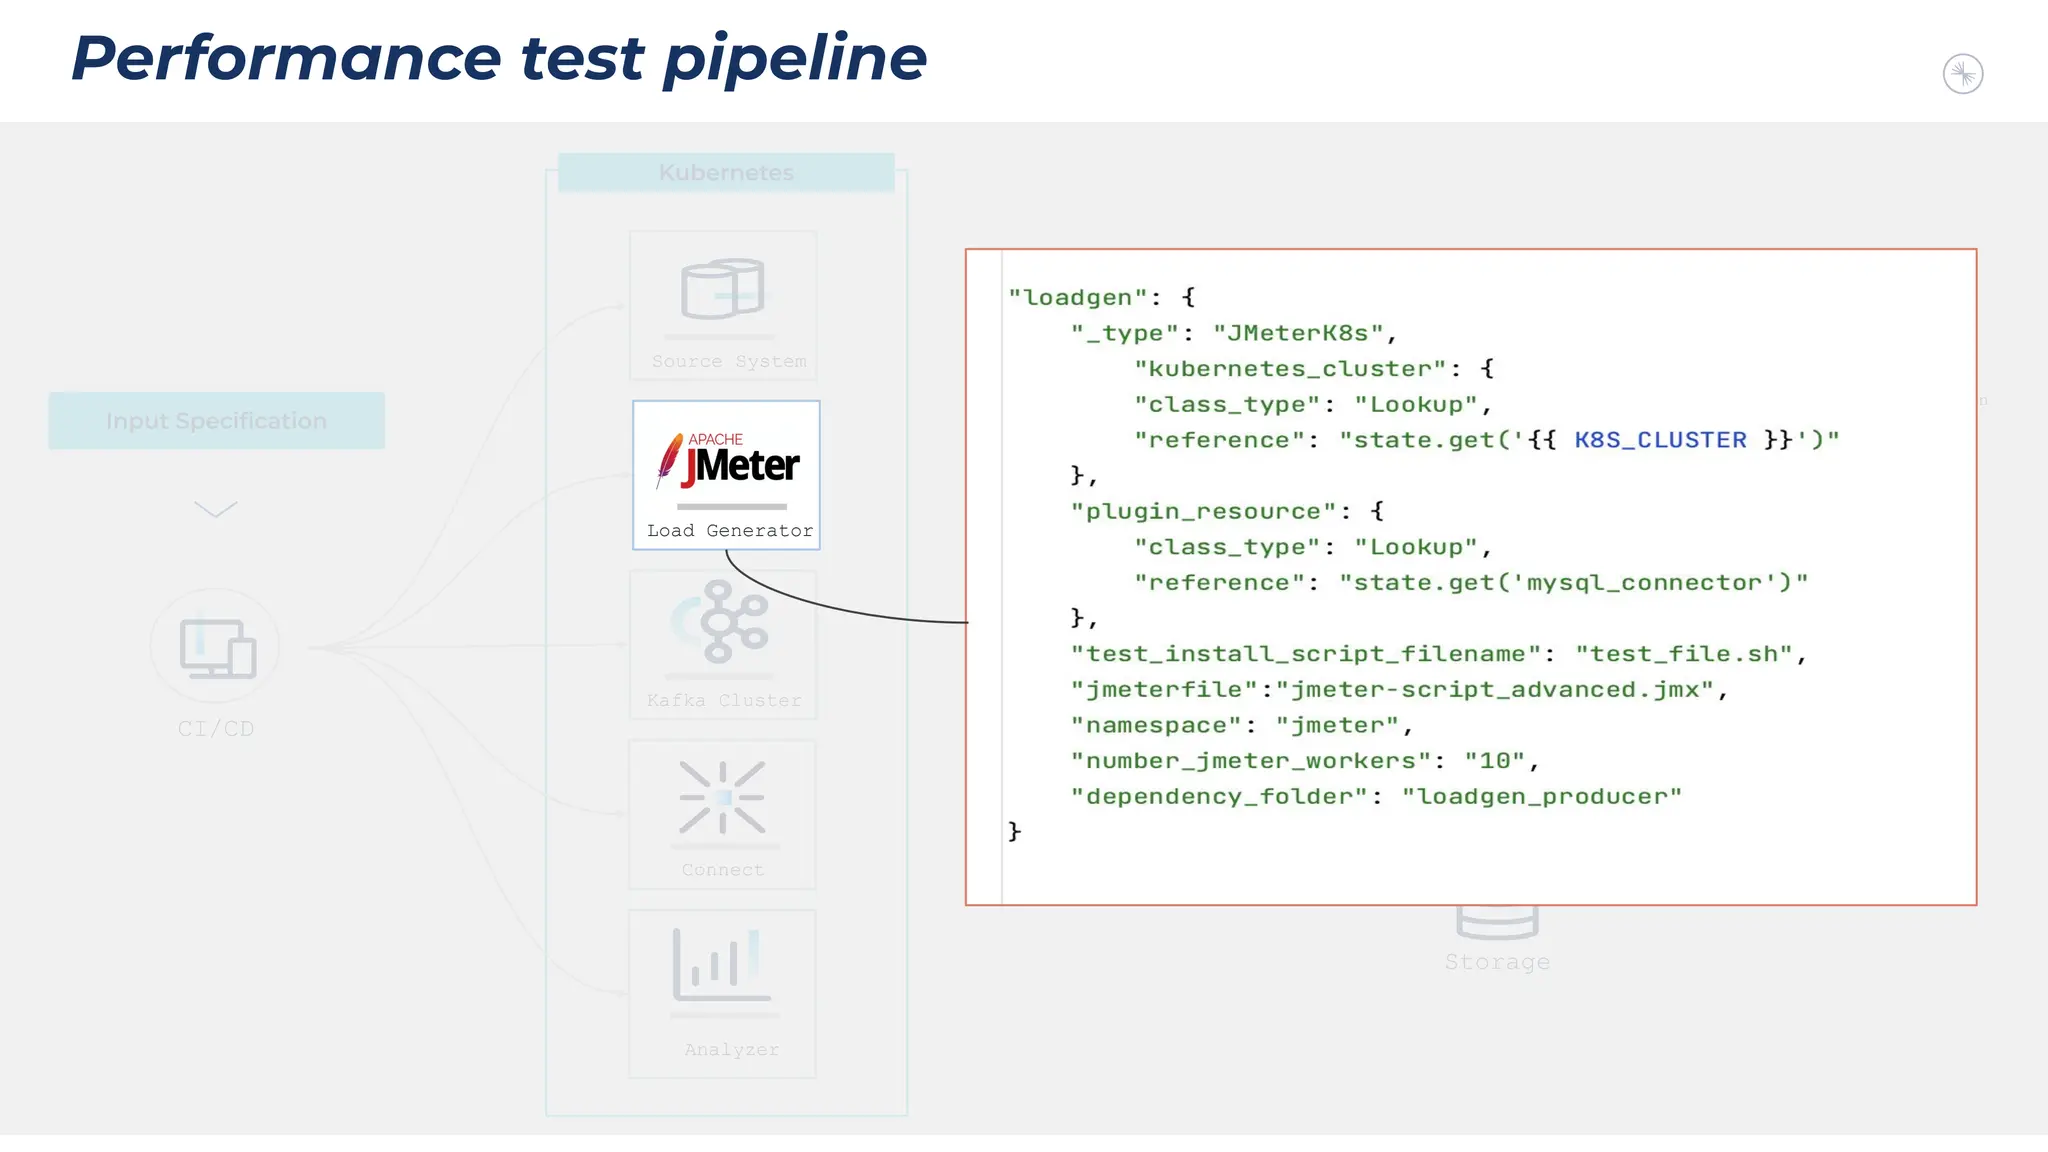
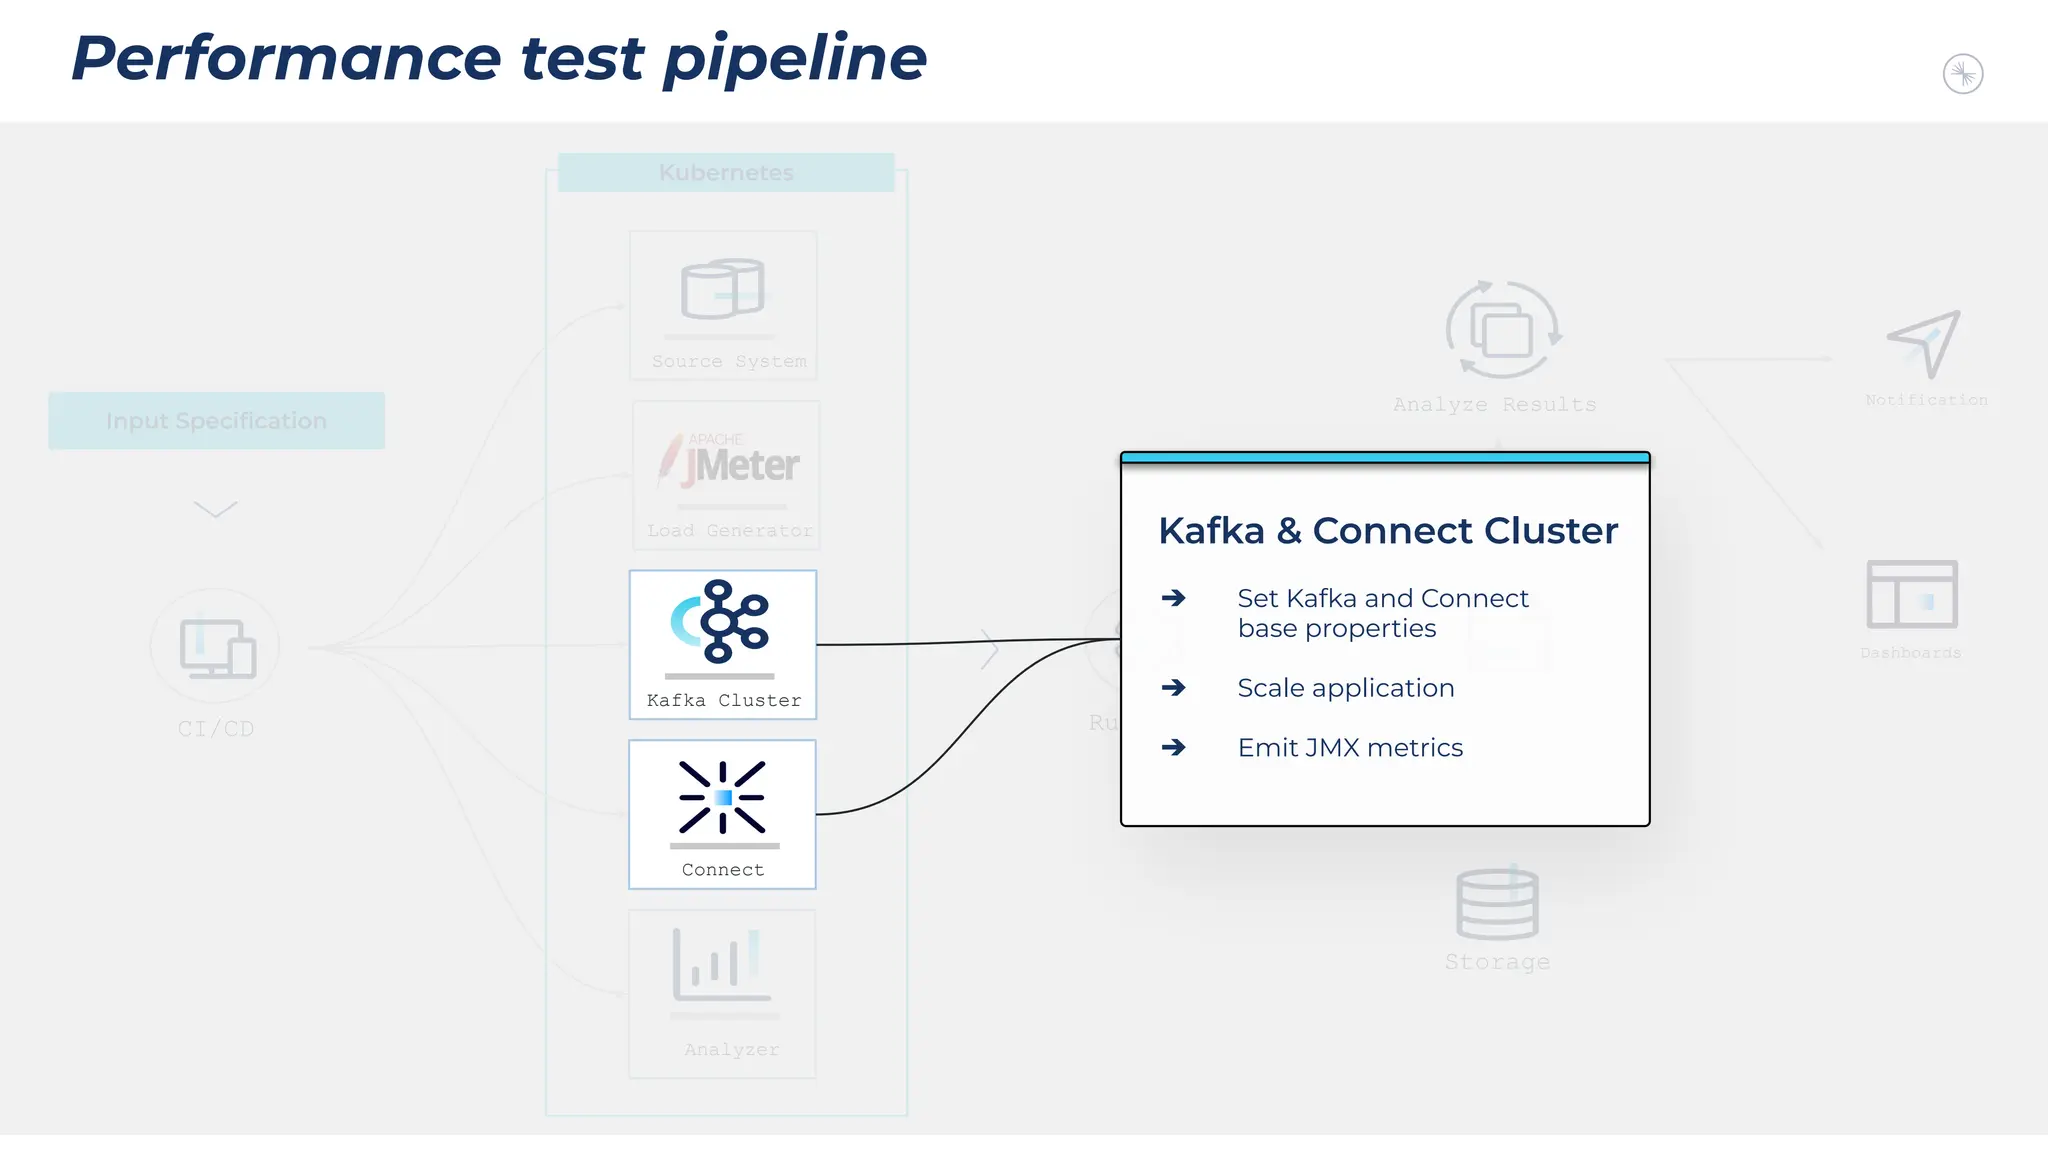
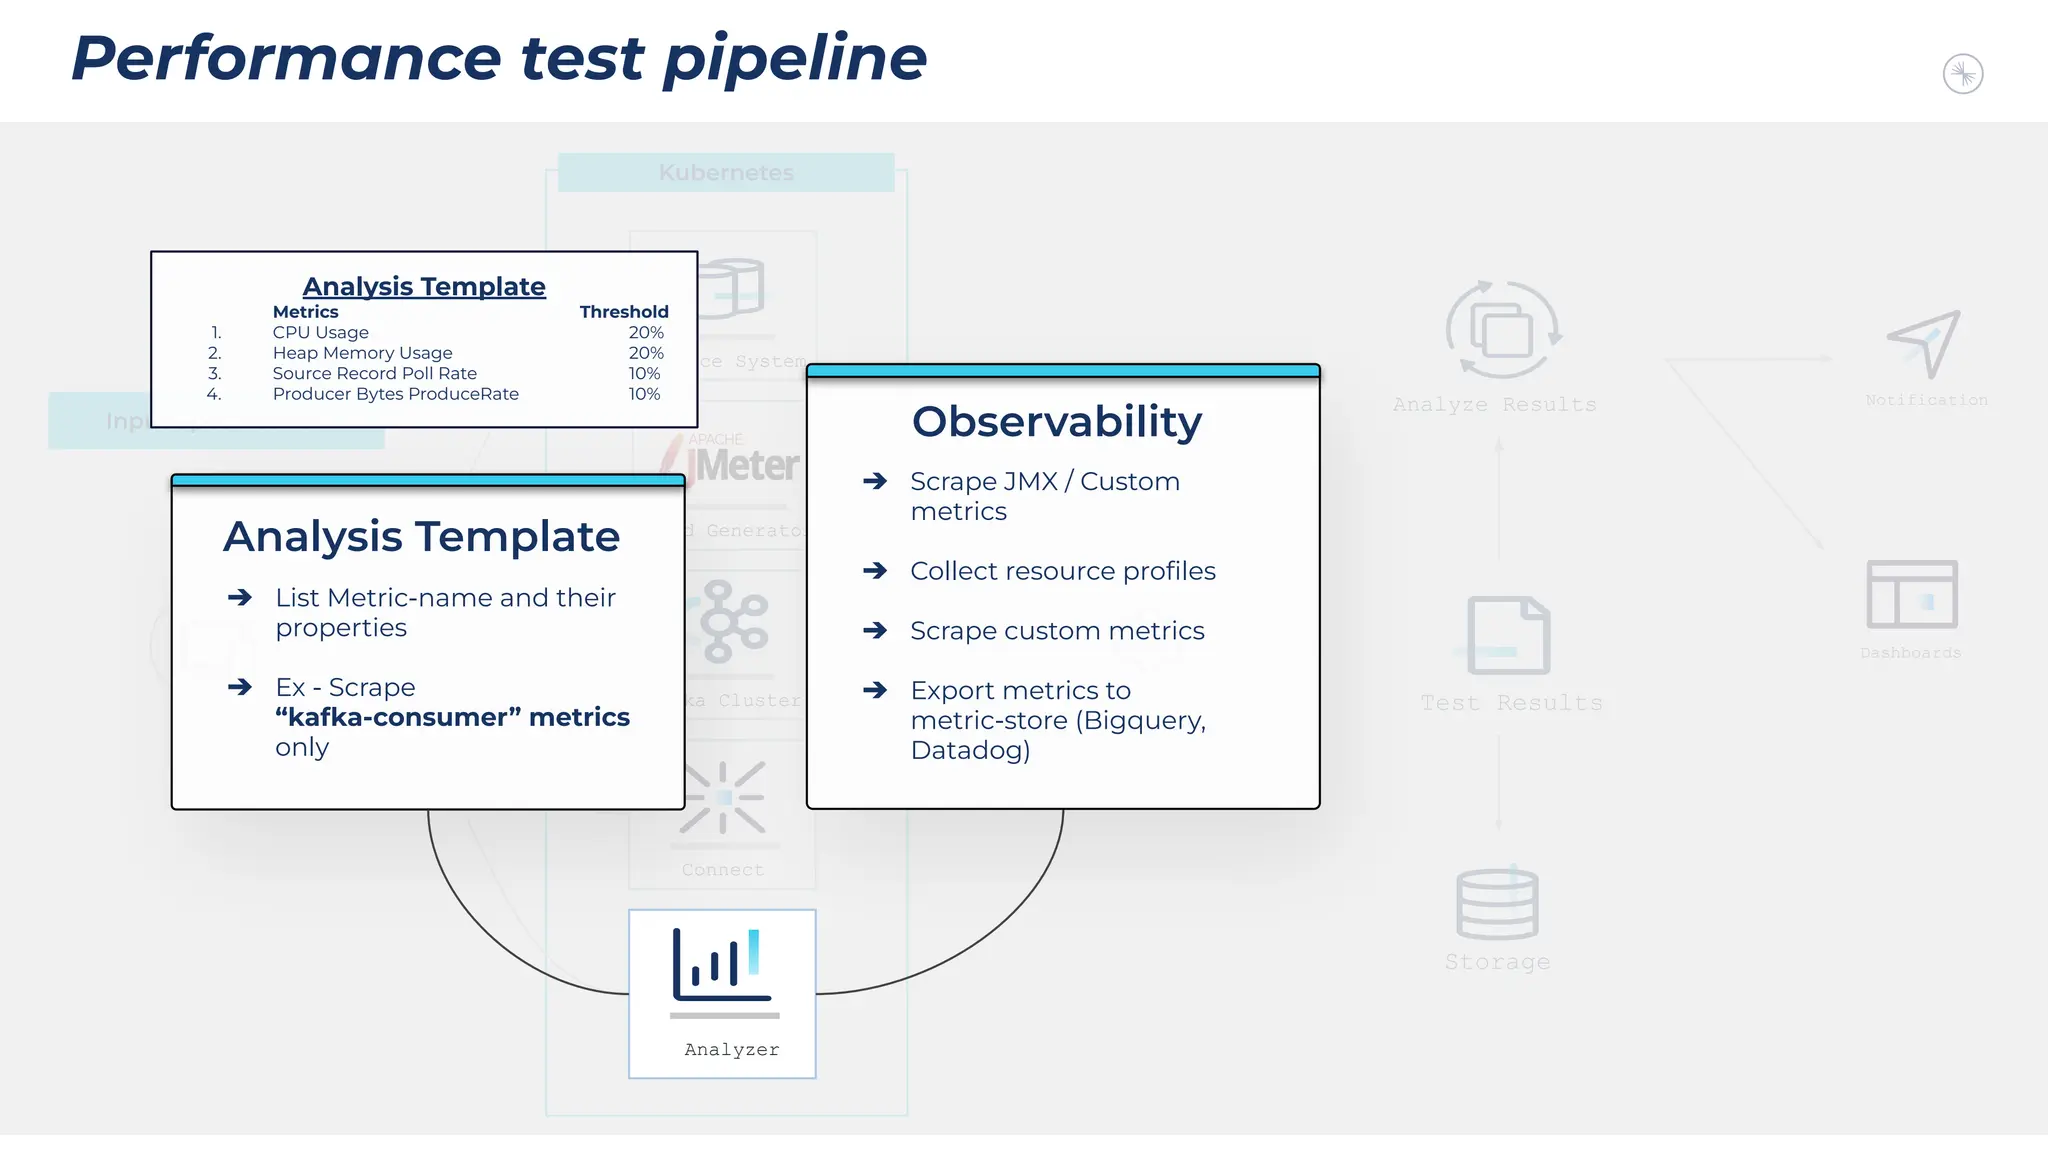
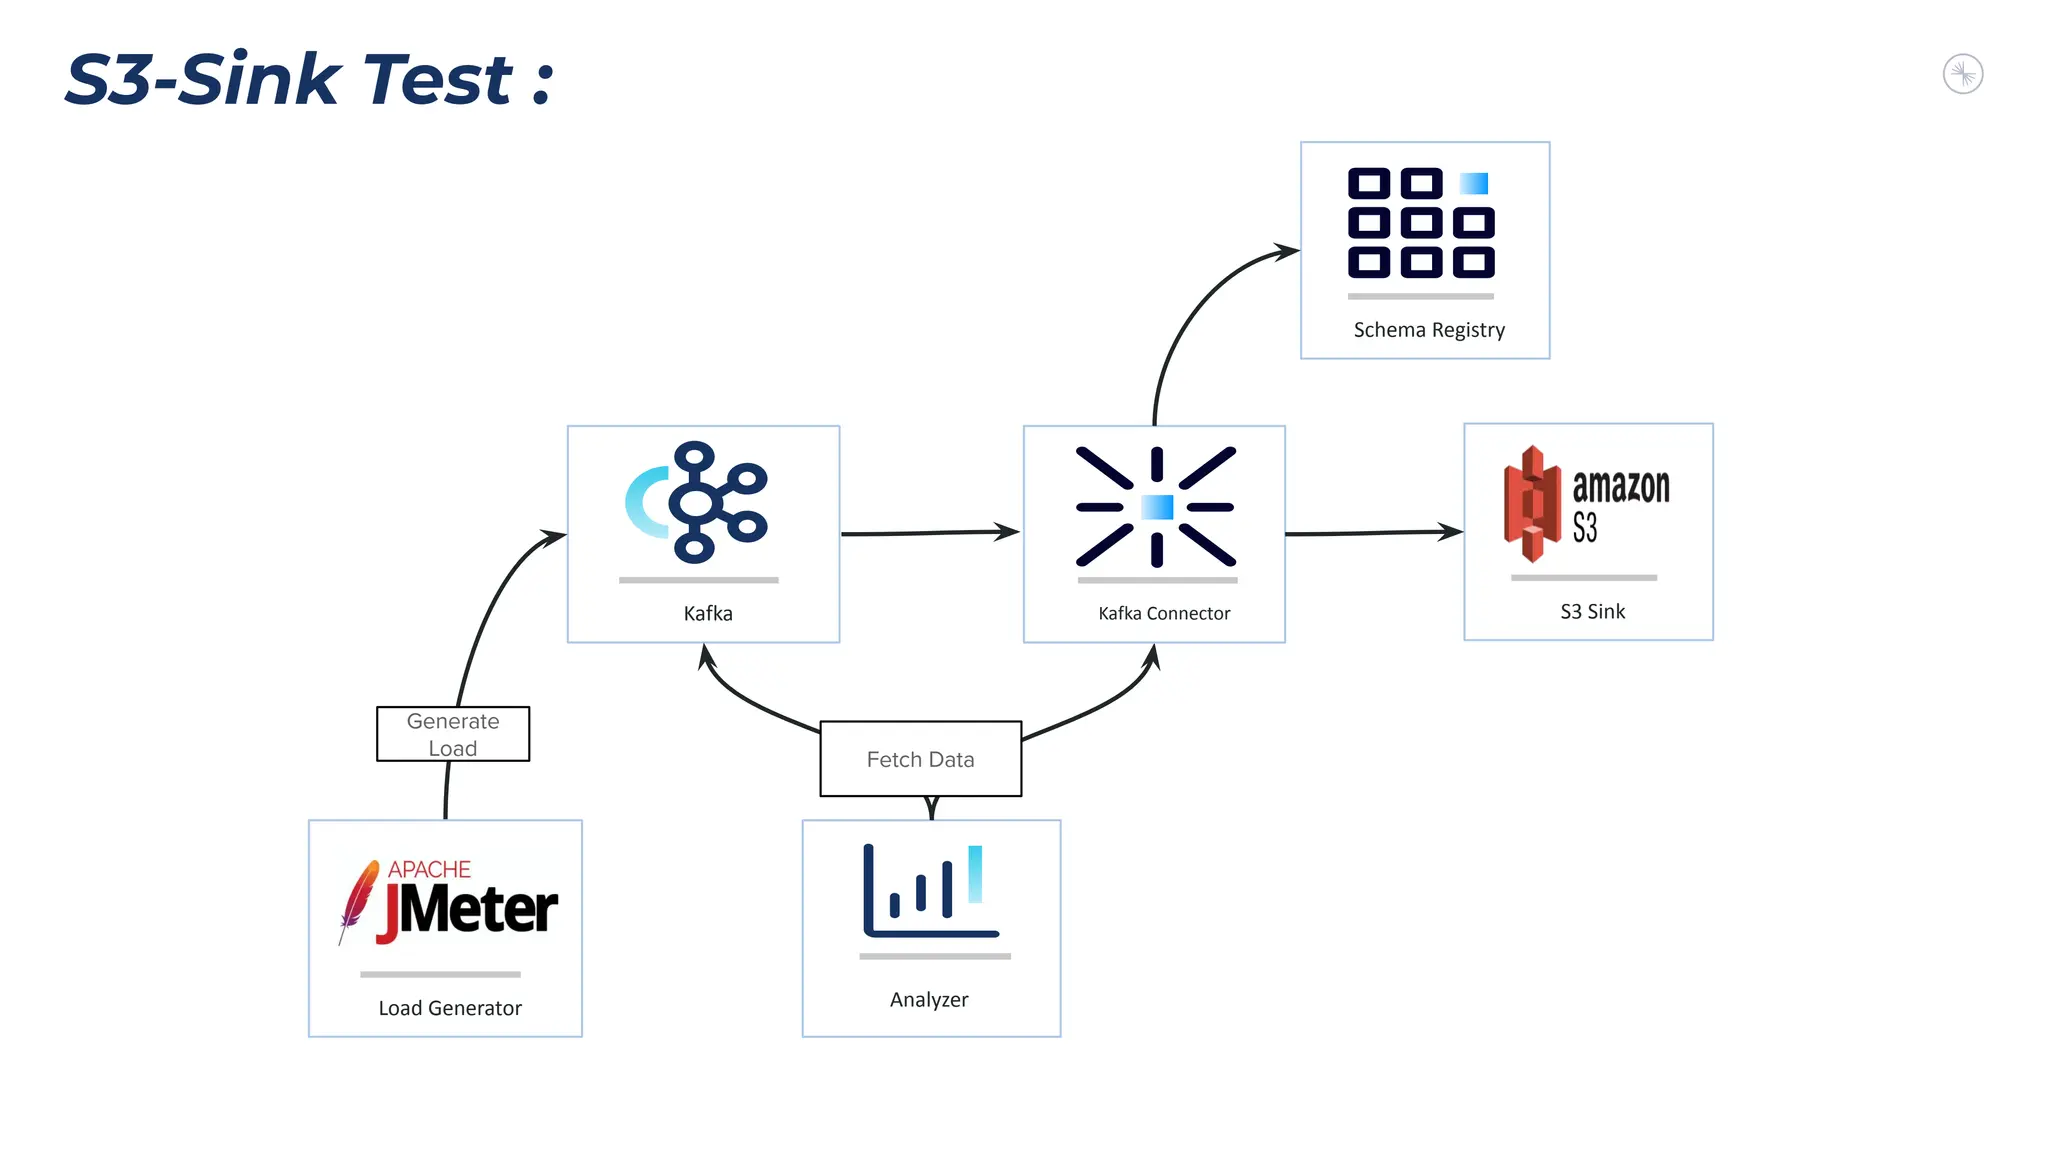
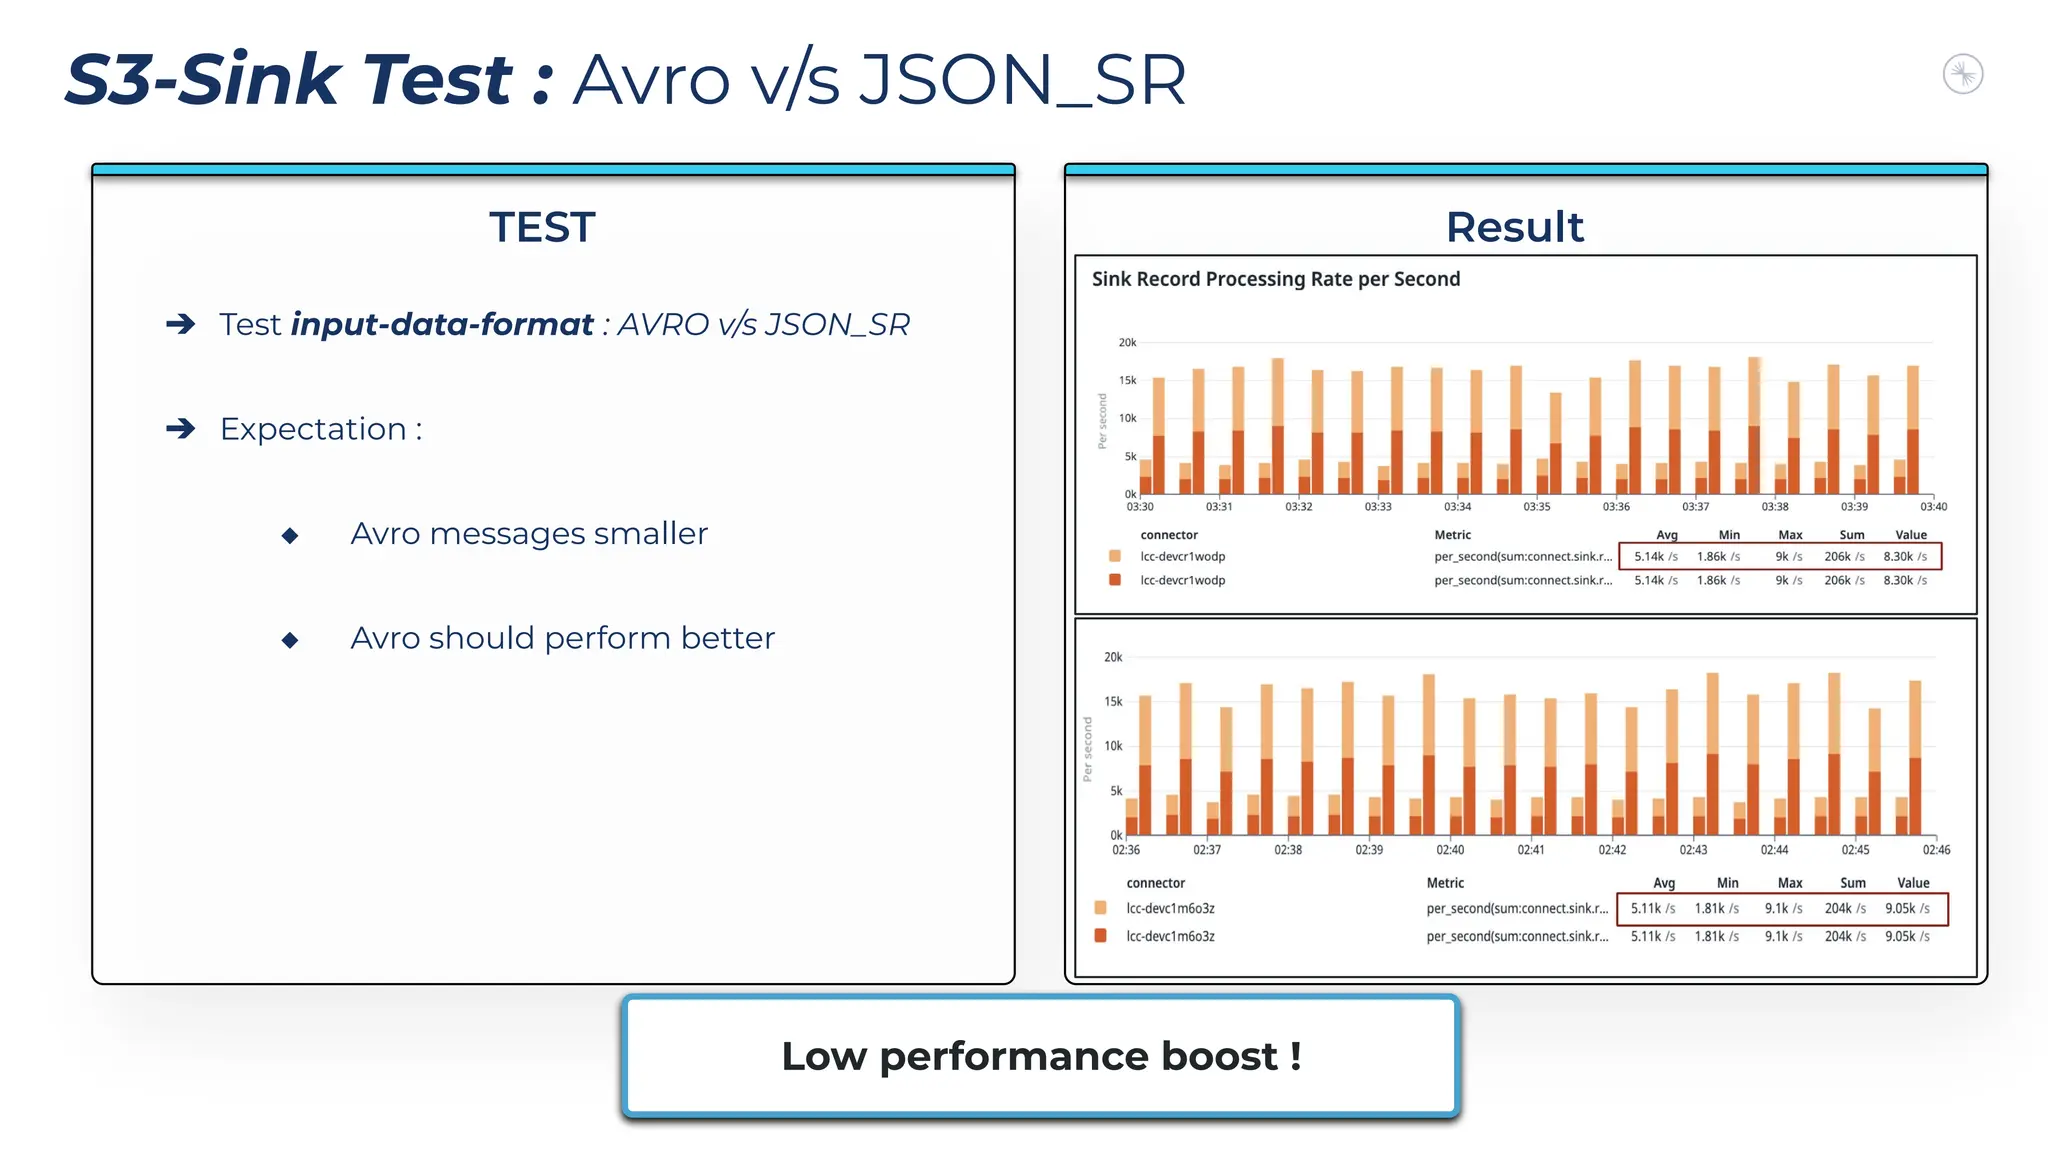
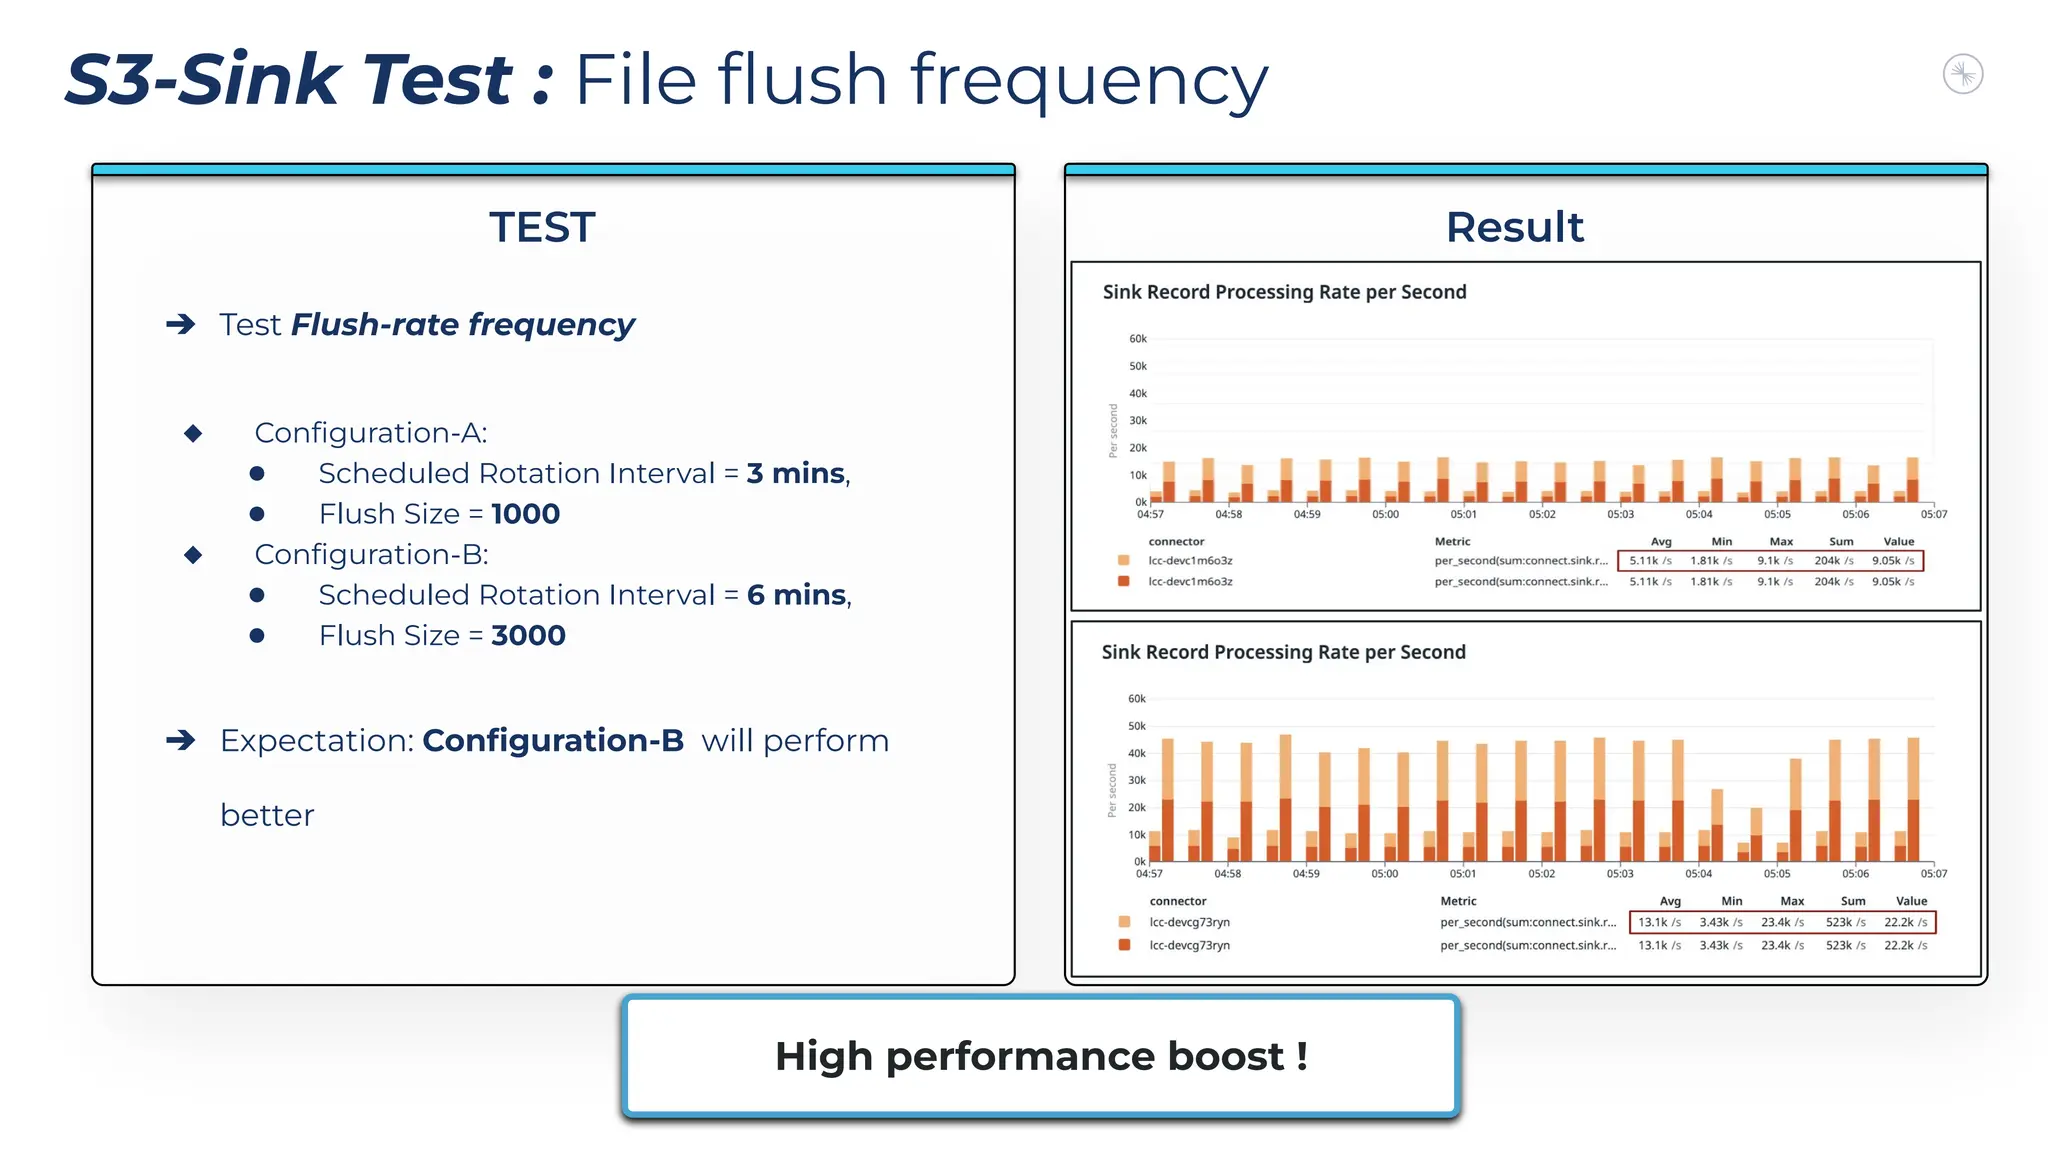
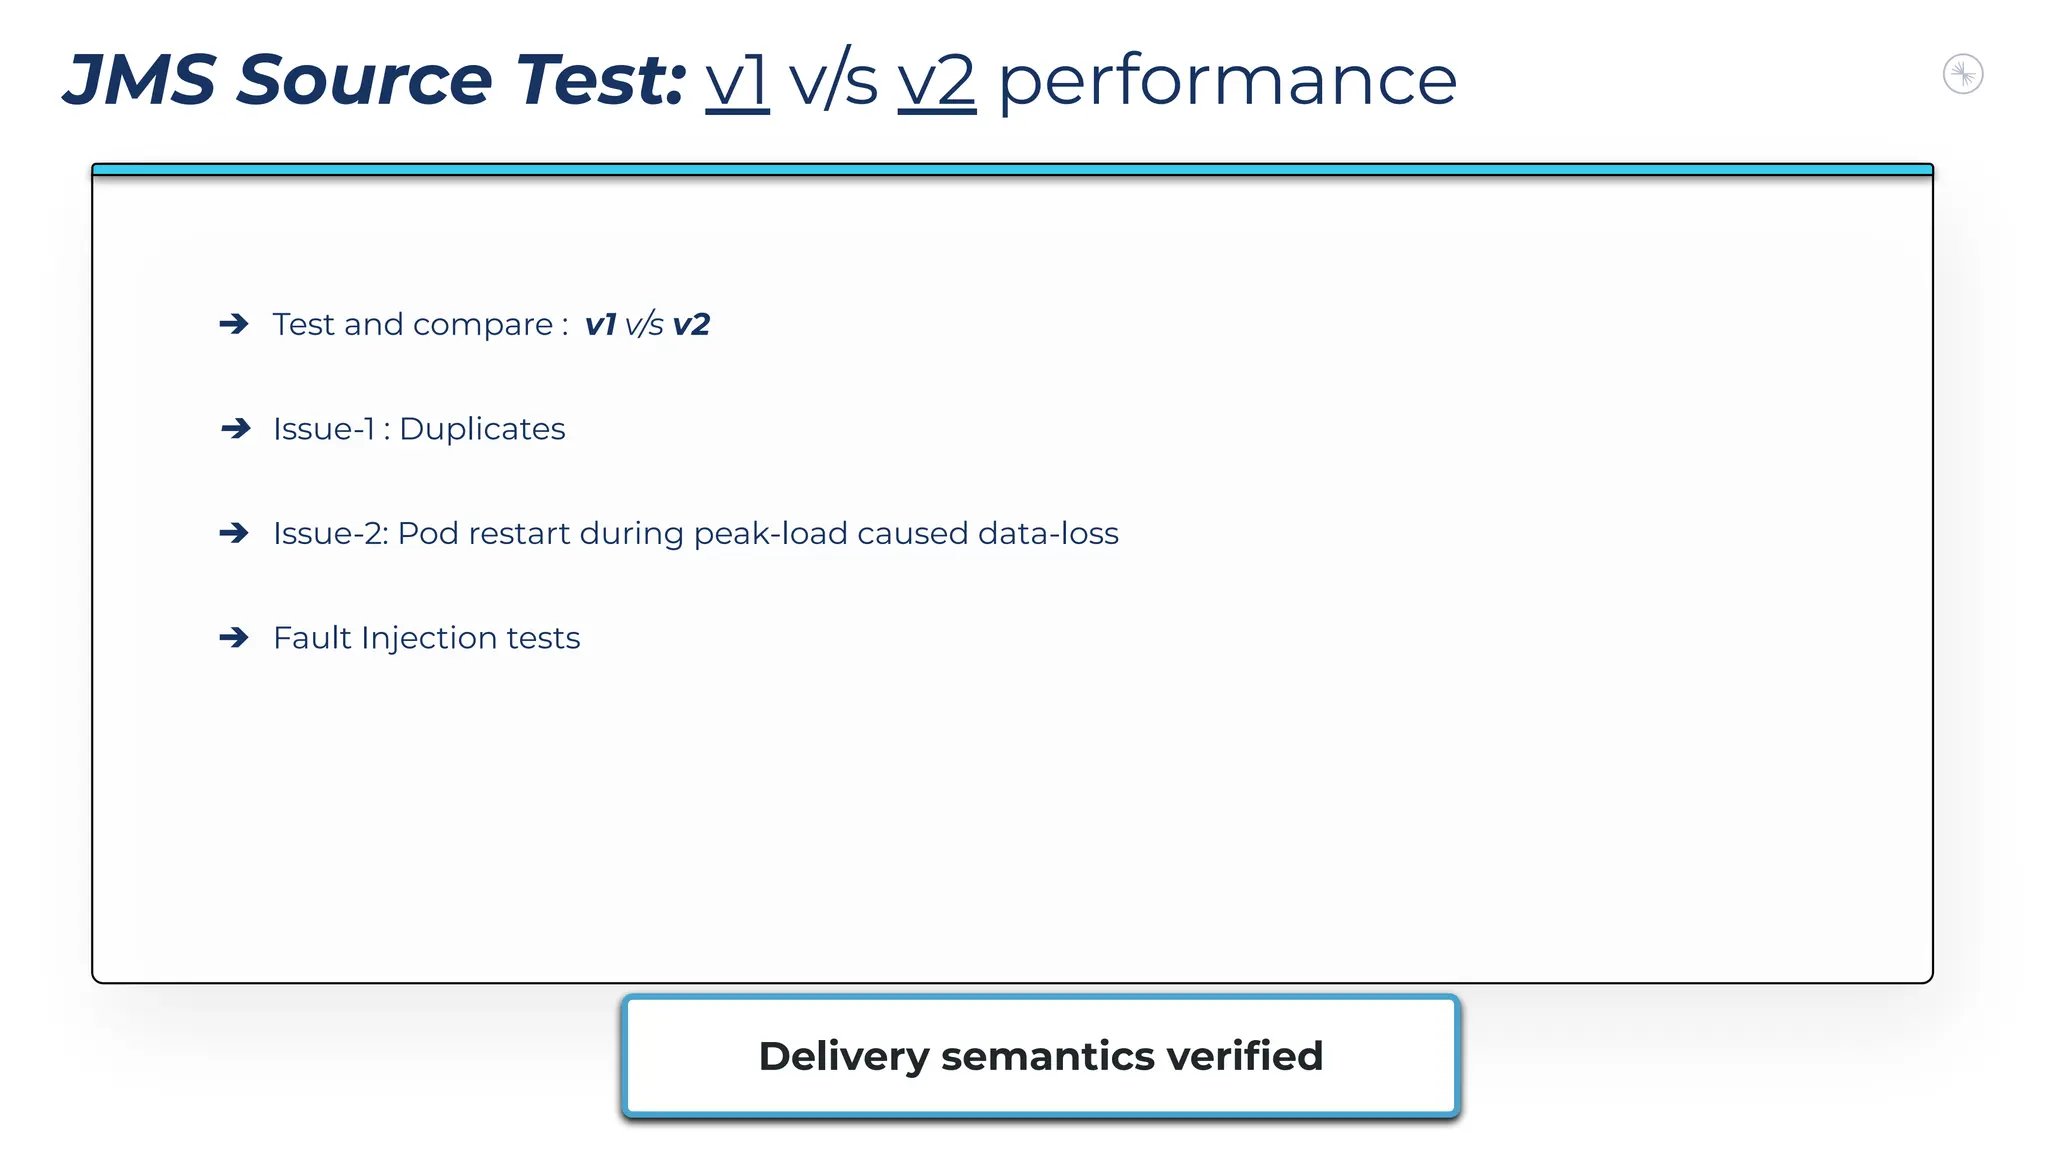
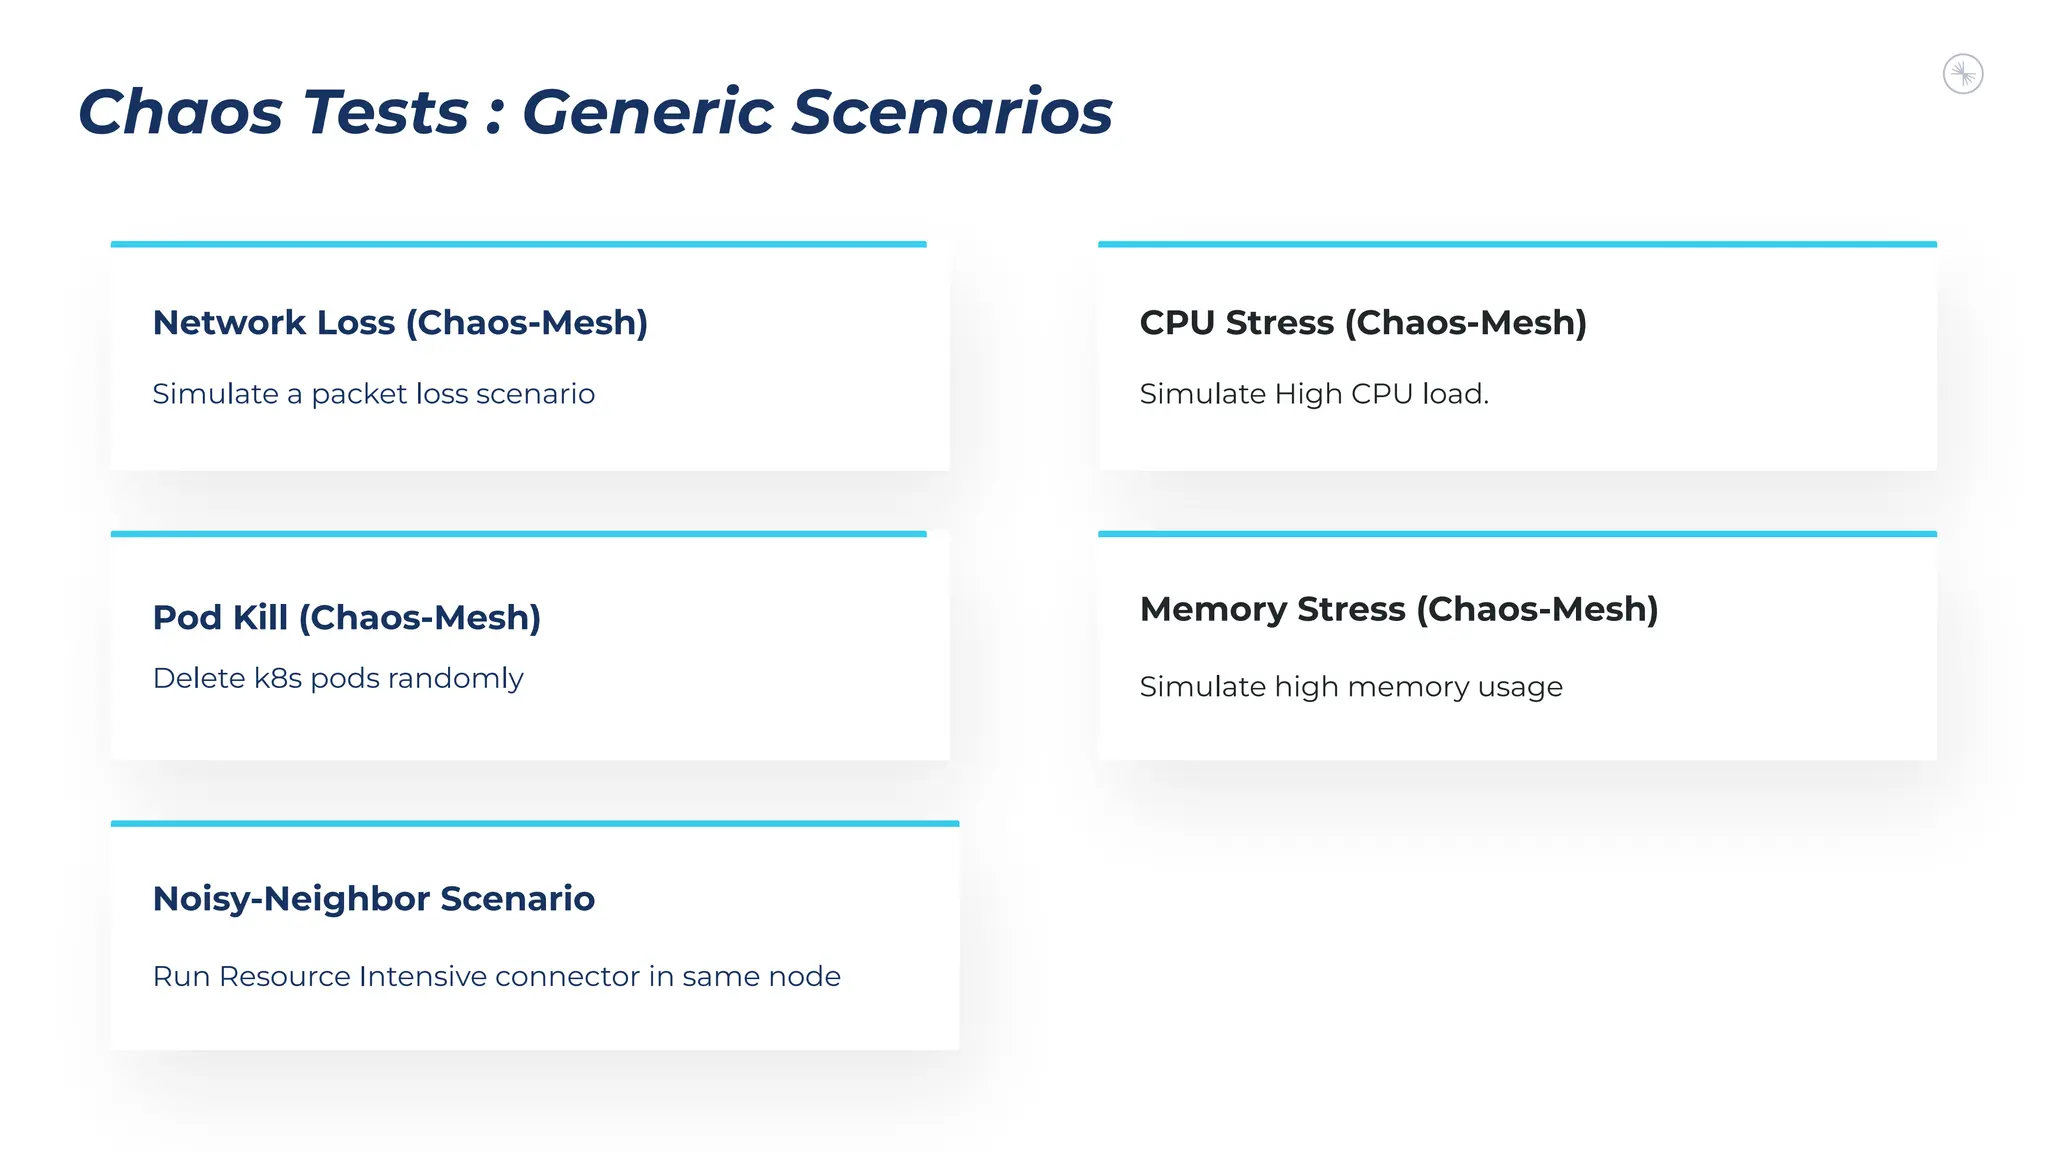


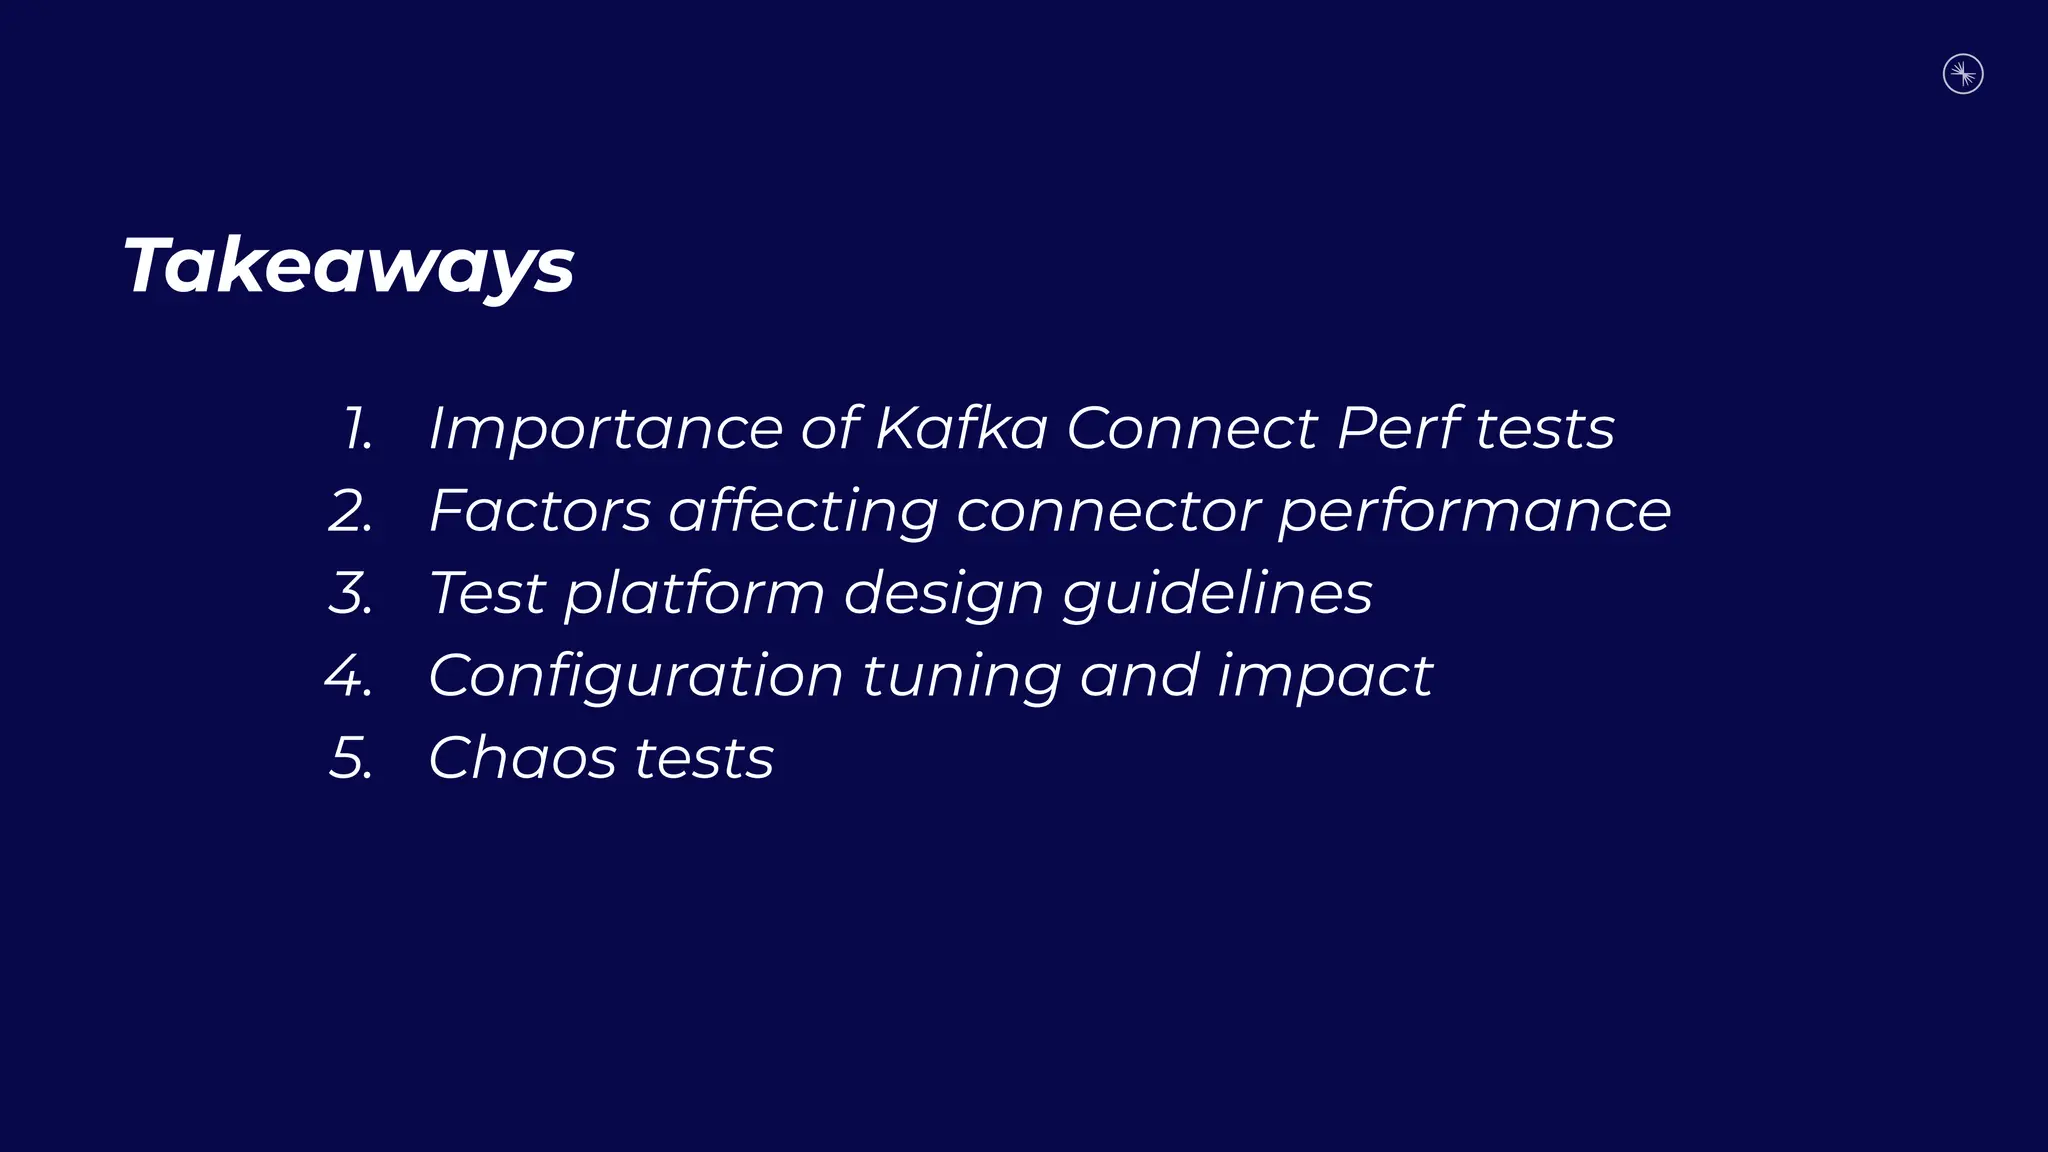


The document outlines the creation of a comprehensive benchmarking toolkit for Kafka connectors to test and optimize performance across various scenarios. It discusses different testing setups, performance determinants, and chaos scenario simulations to uncover connector bottlenecks and improve system behaviors. Additionally, it highlights the importance of performance tests, configuration tuning, and factors affecting connector efficacy.


![[BDD 2025 - Full-Stack Development] The Modern Stack: Building Web & AI Appli...](https://cdn.slidesharecdn.com/ss_thumbnails/fs-themodernstackbuildingwebaiapplicationswithserverless-251124030844-388cf04f-thumbnail.jpg?width=640&height=640&fit=bounds)

![[DevFest Strasbourg 2025] - NodeJs Can do that !!](https://cdn.slidesharecdn.com/ss_thumbnails/devfeststrasbourg2025-nodejscandothat-251127142731-da65b6fd-thumbnail.jpg?width=640&height=640&fit=bounds)
![[BDD 2025 - Mobile Development] Mobile Engineer and Software Engineer: Are we...](https://cdn.slidesharecdn.com/ss_thumbnails/md-mobileengineerandsoftwareengineerarewestillrelevantsidiqpermana-251127010650-55224ef1-thumbnail.jpg?width=640&height=640&fit=bounds)
![[BDD 2025 - Full-Stack Development] Digital Accessibility: Why Developers nee...](https://cdn.slidesharecdn.com/ss_thumbnails/fs-digitalaccessibilitywhydevelopersneedtoknowandcarein2025-251127011019-0674441d-thumbnail.jpg?width=640&height=640&fit=bounds)


![[BDD 2025 - Artificial Intelligence] Building AI Systems That Users (and Comp...](https://cdn.slidesharecdn.com/ss_thumbnails/ai-buildingaisystemsthatusersandcompanieslove-251124030845-038f7732-thumbnail.jpg?width=640&height=640&fit=bounds)


![[BDD 2025 - Full-Stack Development] PHP in AI Age: The Laravel Way. (Rizqy Hi...](https://cdn.slidesharecdn.com/ss_thumbnails/fs-phpinaiagethelaravelway-251125012602-ef9d330e-thumbnail.jpg?width=640&height=640&fit=bounds)
![Support, Monitoring, Continuous Improvement & Scaling Agentic Automation [3/3]](https://cdn.slidesharecdn.com/ss_thumbnails/agenticcommunityseries-day3-cfd-251120170304-ddef8112-thumbnail.jpg?width=640&height=640&fit=bounds)


