Introduction
This examplesimulates a temperature profile in a number of cells and cooling fins in a
liquid-cooled battery pack
The model solves in 3D and for an operational point during a load cycle
A full 1D electrochemical model for the lithium battery calculates the average heat source
The model is based on two assumptions:
The first one is that the material properties of the cooling fluid and battery material can be
calculated using an average temperature for the battery pack, and the second one is that the
variations in heat generation during the load cycle are significantly slower than the heat transport
within the battery pack
The first assumption is valid if the temperature variations in the battery pack are small
The second assumption implies that the thermal balance is quasistationary for the given battery
heat source and at a given operational point during the load cycle
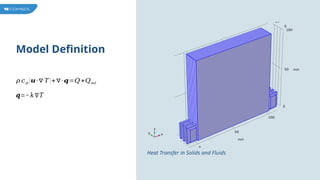
Model Definition
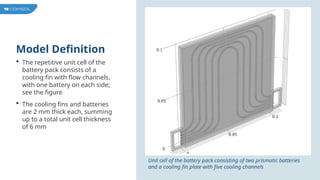
Therepetitive unit cell of the
battery pack consists of a
cooling fin with flow channels,
with one battery on each side;
see the figure
The cooling fins and batteries
are 2 mm thick each, summing
up to a total unit cell thickness
of 6 mm
Unit cell of the battery pack consisting of two prismatic batteries
and a cooling fin plate with five cooling channels
6.
Model Definition
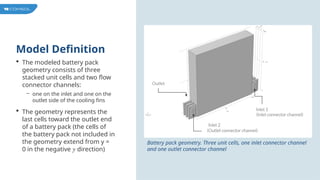
Themodeled battery pack
geometry consists of three
stacked unit cells and two flow
connector channels:
‒ one on the inlet and one on the
outlet side of the cooling fins
The geometry represents the
last cells toward the outlet end
of a battery pack (the cells of
the battery pack not included in
the geometry extend from y =
0 in the negative y direction)
Battery pack geometry. Three unit cells, one inlet connector channel
and one outlet connector channel
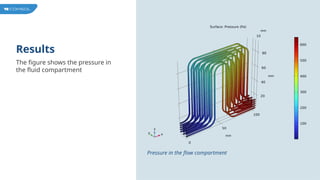
Results
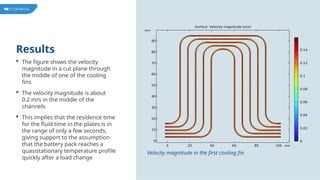
The figureshows the velocity
magnitude in a cut plane through
the middle of one of the cooling
fins
The velocity magnitude is about
0.2 m/s in the middle of the
channels
This implies that the residence time
for the fluid time in the plates is in
the range of only a few seconds,
giving support to the assumption
that the battery pack reaches a
quasistationary temperature profile
quickly after a load change
Velocity magnitude in the first cooling fin
11.
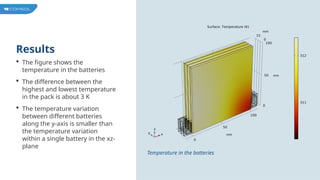
Results
The figureshows the
temperature in the batteries
The difference between the
highest and lowest temperature
in the pack is about 3 K
The temperature variation
between different batteries
along the y-axis is smaller than
the temperature variation
within a single battery in the xz-
plane
Temperature in the batteries
12.
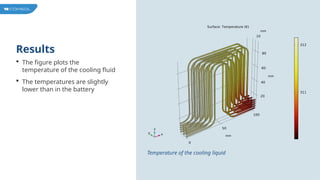
Results
The figureplots the
temperature of the cooling fluid
The temperatures are slightly
lower than in the battery
Temperature of the cooling liquid
13.
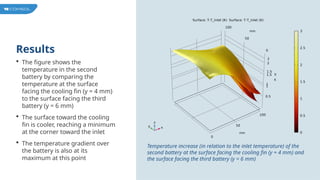
Results
The figureshows the
temperature in the second
battery by comparing the
temperature at the surface
facing the cooling fin (y = 4 mm)
to the surface facing the third
battery (y = 6 mm)
The surface toward the cooling
fin is cooler, reaching a minimum
at the corner toward the inlet
The temperature gradient over
the battery is also at its
maximum at this point
Temperature increase (in relation to the inlet temperature) of the
second battery at the surface facing the cooling fin (y = 4 mm) and
the surface facing the third battery (y = 6 mm)

![Model Definition
Laminar Flow
𝜌 (𝛻∙ 𝒖)=0
𝜌 (∇ ∙𝒖) 𝒖=∇ ∙[−𝑝 𝑰+ 𝑲 ]+ 𝑭](https://image.slidesharecdn.com/libatterypack3d-250829113144-033fb9cc/85/comsol_lithium_ion__battery_pack_3d-pptx-7-320.jpg)