Download to read offline


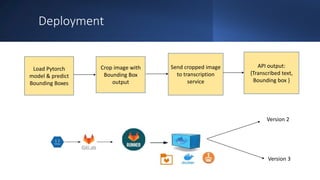


The document discusses the current state and future prospects of computer vision, detailing the development and performance of object detection models, particularly focusing on the YOLO algorithm. It highlights the limitations of existing models in reading complex images and emphasizes the importance of proper problem definition and metrics in enhancing model performance. Key takeaways include the effectiveness of YOLO for real-time applications and the need for careful integration of model outputs with transcription services.


![[IGC2018] 펄어비스 김광삼 - 대면 커뮤니케이션 주도의 게임 디자인과 게임 개발법](https://cdn.slidesharecdn.com/ss_thumbnails/2-181023014611-thumbnail.jpg?width=640&height=640&fit=bounds)


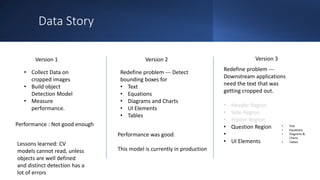
![[IGC2018] 펄어비스 강건우 - 펄어비스에서 기획자가 일하는 방법](https://cdn.slidesharecdn.com/ss_thumbnails/1-181023023810-thumbnail.jpg?width=640&height=640&fit=bounds)


![[IGC 2016] 블루사이드 황상훈 - 실전 시나리오 라이팅: PD가 원하면 나는 쓴다](https://cdn.slidesharecdn.com/ss_thumbnails/igc2016final-161008134901-thumbnail.jpg?width=640&height=640&fit=bounds)


![Lecture 5,6(Comp Vision) [Auto-saved].pptx](https://cdn.slidesharecdn.com/ss_thumbnails/lecture56compvisionauto-saved-250415183559-508e5342-thumbnail.jpg?width=640&height=640&fit=bounds)