Unit 1 – Starting somewhereStarting somewhere
newnew
 Writing task 1
COMPLETE IELTS (5-6.5)
Work in pairs. Look at the different ways of showing
information (A–E) and match them with their names (1–5).
1 pie chart B 2 diagram 3 bar chart
4 line graph 5 table
1
Line graph
Bar chart
diagram
table
1. The graph1. The graph
2. Shows the changes in the2. Shows the changes in the
number of people from abroadnumber of people from abroad
who visited Townsville,who visited Townsville,
QueenslandQueensland
3. Over a four-year period.3. Over a four-year period.
Introduction:
Title (paraphrased from the question) + Overall
Body:
Compare and contrast main factors
(The ideas are presented from general to specific details)
Conclusion: (optional)
The overall of the chart/graph
INTRODUCTION
Three steps to keep up
1. Identify the main idea behind the graph or table. This will be 
the focus of your first sentence. 
2. Consider  the  details  of  what  is  being  shown  -  the  units  of 
measurement, the time frame, and the location.
3. Consider the language to use - the introductory expressions, 
the tenses of the verbs, the correct expressions of time etc. 
The line graph illustrates the amount of fast food
consumed by teenagers (1) in Australia between
1975 and 2000, a period of 25 years (2).
Example
The graph/table shows/indicates/illustrates/reveals/represents..
(that).
 It is clear from the graph/table... ..(that).
 It can be seen from the graph/table... ..(that).
 As the graph/table shows,...(clause)
 As can be seen from the graph/table,...(clause)
 As is shown by the graph/table,.. (clause)
 As is illustrated by the graph/table,...(clause)
 From the graph/table it is clear.....(that).
Introductory Expression
WARNING !
3. Avoid using the word presents. It requires a sophisticated summarising 
noun  to  follow.  (For example: The graph presents an overview of the
population growth of Canada between 1867 and 2007.)
1. Avoid  using  the  phrase: according to the graph.  This is  because  the 
phrase according to generally  means  that  the  information  comes 
from another person or source, and not from our own knowledge. 
2. The  expressions as can be seen from the graph or as is
shown/illustrated by the table do NOT contain the dummy subject it. 
 The chart shows the number of households in Winchester, California, 
and the languages which people speak there.
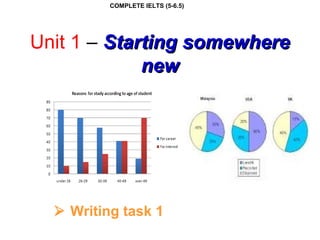
 The chart shows the difficulties people have when they integrate into a 
new country and how the problems vary according to age.
The diagram shows a machine
for producing electricity from
waves.
The  table  shows  the  number  of  students  at 
Broadlands  Language  School  and  the 
average number of weeks the students spent 
there over a three-month period..
 18-34: making friends (46%) higher than for the
middle age group (36%) and the oldest age group
(23%)
 Learning the local language – 54% compared with 29%
for the youngest
 The oldest age group has the least difficulty with finding
somewhere to live (22%), compared with 39% for the middle
age group and 40% for the youngest.
1. Question 1: paragraph 2
Question 2: paragraph 3
Question 3: paragraph 4
2. To give a general overview of all
the information.
Compare and Contrast
 Comparative forms
One syllable: adj + -er + than
cheap – cheaper
large - larger
 Long adjectives: More/ less + adj + than
common - more common
profitable - more profitable
 More/ less/ fewer + N + than
more students
less people
 Superlative forms
 One syllable: adj + -est
cheap – the cheapest
large – the largest
high – the highest
 Long adjectives: the most/least + adj
common - the most common
profitable – the most profitable
 Similarity: As + adj + as
(not) as many + …as
As popular as as many females as males
Note
Use adverbs to make your comparisons more exact
 To emphasize a difference, you can use: many,
much, far, and significantly
Many more students sat examinations in science-
related subjects.
 For small differences, you can use: slightly or
nearly as…as.
Nearly as many students sat Art and Design exam
as did the Chemistry exam.
move to
a new country
How the problems vary according to people’s ages.
percentage
no
the
no
the
percent

the
percent
Complete ielts (2)   unit 1 - writing - task 1

Complete ielts (2) unit 1 - writing - task 1

  • 1.
    Unit 1 –Starting somewhereStarting somewhere newnew  Writing task 1 COMPLETE IELTS (5-6.5)
  • 2.
    Work in pairs.Look at the different ways of showing information (A–E) and match them with their names (1–5). 1 pie chart B 2 diagram 3 bar chart 4 line graph 5 table 1
  • 3.
  • 4.
    1. The graph1.The graph 2. Shows the changes in the2. Shows the changes in the number of people from abroadnumber of people from abroad who visited Townsville,who visited Townsville, QueenslandQueensland 3. Over a four-year period.3. Over a four-year period.
  • 5.
    Introduction: Title (paraphrased fromthe question) + Overall Body: Compare and contrast main factors (The ideas are presented from general to specific details) Conclusion: (optional) The overall of the chart/graph
  • 6.
    INTRODUCTION Three steps tokeep up 1. Identify the main idea behind the graph or table. This will be  the focus of your first sentence.  2. Consider  the  details  of  what  is  being  shown  -  the  units  of  measurement, the time frame, and the location. 3. Consider the language to use - the introductory expressions,  the tenses of the verbs, the correct expressions of time etc.  The line graph illustrates the amount of fast food consumed by teenagers (1) in Australia between 1975 and 2000, a period of 25 years (2). Example
  • 7.
    The graph/table shows/indicates/illustrates/reveals/represents.. (that). It is clear from the graph/table... ..(that).  It can be seen from the graph/table... ..(that).  As the graph/table shows,...(clause)  As can be seen from the graph/table,...(clause)  As is shown by the graph/table,.. (clause)  As is illustrated by the graph/table,...(clause)  From the graph/table it is clear.....(that). Introductory Expression
  • 8.
    WARNING ! 3. Avoid using the word presents. It requires a sophisticated summarising  noun  to follow.  (For example: The graph presents an overview of the population growth of Canada between 1867 and 2007.) 1. Avoid  using  the  phrase: according to the graph.  This is  because  the  phrase according to generally  means  that  the  information  comes  from another person or source, and not from our own knowledge.  2. The  expressions as can be seen from the graph or as is shown/illustrated by the table do NOT contain the dummy subject it. 
  • 9.
  • 10.
    The diagram showsa machine for producing electricity from waves. The  table  shows  the  number  of  students  at  Broadlands  Language  School  and  the  average number of weeks the students spent  there over a three-month period..
  • 12.
     18-34: makingfriends (46%) higher than for the middle age group (36%) and the oldest age group (23%)
  • 13.
     Learning thelocal language – 54% compared with 29% for the youngest
  • 14.
     The oldestage group has the least difficulty with finding somewhere to live (22%), compared with 39% for the middle age group and 40% for the youngest.
  • 15.
    1. Question 1:paragraph 2 Question 2: paragraph 3 Question 3: paragraph 4 2. To give a general overview of all the information.
  • 16.
    Compare and Contrast Comparative forms One syllable: adj + -er + than cheap – cheaper large - larger  Long adjectives: More/ less + adj + than common - more common profitable - more profitable  More/ less/ fewer + N + than more students less people
  • 17.
     Superlative forms One syllable: adj + -est cheap – the cheapest large – the largest high – the highest  Long adjectives: the most/least + adj common - the most common profitable – the most profitable  Similarity: As + adj + as (not) as many + …as As popular as as many females as males
  • 18.
    Note Use adverbs tomake your comparisons more exact  To emphasize a difference, you can use: many, much, far, and significantly Many more students sat examinations in science- related subjects.  For small differences, you can use: slightly or nearly as…as. Nearly as many students sat Art and Design exam as did the Chemistry exam.
  • 19.
    move to a newcountry How the problems vary according to people’s ages.
  • 20.
  • 21.