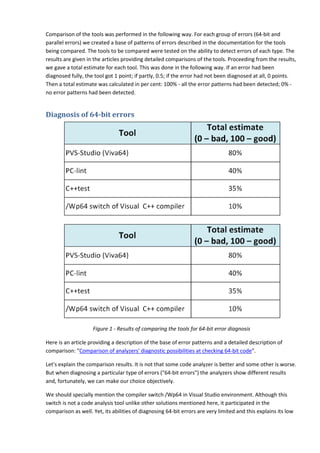
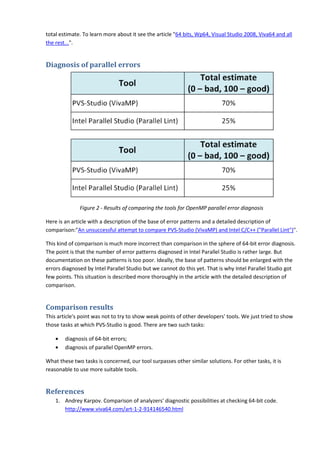
The article discusses comparison of PVS-Studio code analyzer with other solutions in this sphere. As PVS-Studio contains modules for diagnosing 64-bit and parallel errors, it is compared to various types of tools.
The article describes the testing technologies used when developing PVS-Studio static code analyzer. The developers of the tool for programmers talk about the principles of testing their own program product which can be interesting for the developers of similar packages for processing text data or source code.
I don't like it when people use artificial code examples to evaluate the diagnostic capabilities of static code analyzers. There is one particular example I'm going to discuss to explain my negative attitude to synthetic tests.
PVS-Studio advertisement - static analysis of C/C++ codePVS-Studio
This document advertises the PVS-Studio static analyzer. It describes how using PVS-Studio reduces the number of errors in code of C/C++/C++11 projects and costs on code testing, debugging and maintenance. A lot of examples of errors are cited found by the analyzer in various Open-Source projects. The document describes PVS-Studio at the time of version 4.38 on October 12-th, 2011, and therefore does not describe the capabilities of the tool in the next versions. To learn about new capabilities, visit the product's site http://www.viva64.com or search for an updated version of this article.
Regular use of static code analysis in team developmentPVS-Studio
Static code analysis technologies are used in companies with mature software development processes. However, there might be different levels of using and introducing code analysis tools into a development process: from manual launch of an analyzer "from time to time" or when searching for hard-to-find errors to everyday automatic launch or launch of a tool when adding new source code into the version control system.
The article discusses different levels of using static code analysis technologies in team development and shows how to "move" the process from one level to another. The article refers to the PVS-Studio code analyzer developed by the authors as an example.
Regular use of static code analysis in team developmentAndrey Karpov
Static code analysis technologies are used in companies with mature software development processes. However, there might be different levels of using and introducing code analysis tools into a development process: from manual launch of an analyzer "from time to time" or when searching for hard-to-find errors to everyday automatic launch or launch of a tool when adding new source code into the version control system.
The article discusses different levels of using static code analysis technologies in team development and shows how to "move" the process from one level to another. The article refers to the PVS-Studio code analyzer developed by the authors as an example.
What's the Difference Between Static Analysis and Compiler Warnings?Andrey Karpov
Visiting forums, you can often meet people who believe that compiler warnings are more than enough for controlling the basic types of errors in programs' code. I want to show you that it's a wrong belief.
Specialized static analysis tools and standard compiler warnings are both oriented towards improving the quality of the source code and minimizing potential bugs which are difficult to catch through debugging. One way or another, the compiler relies on static analysis of the source code during compilation to generate its warnings, but the quality of diagnostics and their scope of use vary greatly from one analysis method to another.
Testing parallel software is a more complicated task in comparison to testing a standard program. The programmer should be aware both of the traps he can face while testing parallel code and existing methodologies and toolkit.
Static analysis as part of the development process in Unreal EnginePVS-Studio
Unreal Engine continues to develop as new code is added and previously written code is changed. What is the inevitable consequence of ongoing development in a project? The emergence of new bugs in the code that a programmer wants to identify as early as possible. One of the ways to reduce the number of errors is the use of a static analyzer like PVS-Studio. Moreover, the analyzer is not only evolving, but also constantly learning to look for new error patterns, some of which we will discuss in this article. If you care about code quality, this article is for you.
AspectMock is a PHP library that allows mocking of any method call, including static and private methods, without requiring code refactoring. It uses aspect-oriented programming to intercept method calls and return mock values. To use it, install via Composer, create a custom autoloader for tests, and define the class and methods to mock along with their return values. AspectMock makes it easy to mock code as written without dependency injection refactoring required by other mocking tools.
Visual Programming Lectures using Visual Studio 2015 C# Windows Form Application
Lecturer: Saman M. Almufti / Kurdistan Region, Nawroz University
facebook: https://www.facebook.com/saman.malmufti
Comparing static analysis in Visual Studio 2012 (Visual C++ 2012) and PVS-StudioPVS-Studio
After Visual Studio 2012 was released with a new static analysis unit included in all of the product's editions, a natural question arises: "Is PVS-Studio still relevant as a static analysis tool or can it be replaced by the tool integrated into VS?". A detailed answer with examples is given in this article. We have performed interface and usability comparison as well as a comparison of error diagnosis strength in real software code. The comparison was carried out on the source code of three open-source projects by id Software: Doom 3, Quake 3: Arena, Wolfenstein: Enemy Territory.
This document discusses research into automatic test case generation for train control systems. It describes a tool called CompleteTest that uses model checking to generate test cases from function block diagram programs that satisfy various logic coverage criteria. The tool was evaluated in a case study with Bombardier Transportation where it generated tests for some programs, but failed to terminate within 10 minutes for larger programs. Ongoing work involves addressing state space explosions, complementing model checking with other techniques, and measuring test effectiveness at finding faults.
The document discusses various .NET debugging techniques, including:
1. The importance of debugging and the tools available for debugging .NET applications, such as Visual Studio and Debugging Tools for Windows.
2. Basic debugging tasks like setting breakpoints, stepping through code, and examining variables and call stacks.
3. Advanced techniques like debugging managed code, threads, and memory issues.
Model-based Testing using Microsoft’s Spec Explorer Tool: A Case StudyDharmalingam Ganesan
Spec Explorer is a model-based testing tool that generates test cases from models of the system under test (SUT). The document describes a case study using Spec Explorer to test NASA's GMSEC API, which provides a message bus for component communication. Key aspects of the case study include developing models of the API in Spec Explorer's modeling language, slicing models to focus testing, generating state machines and test cases from the models, and executing the tests on implementations of the API in different programming languages. The automated and parameterized testing identified specification issues and corner cases in the SUT.
Lesson 7. The issues of detecting 64-bit errorsPVS-Studio
There are various techniques of detecting errors in program code. Let us consider the most popular ones and see how efficient they are in finding 64-bit errors.
Why to choose HP UFT: Automation testing toolBugRaptors
BugRaptors has expertise in UFT, one of the most useful commercial automation tool in the market. We specifically automate using UFT, as it supports almost all popular automation frameworks like Linear, Keyword, Data Driven, Hybrid etc.
A practical approach for end-to-end test automation is discussed. The approach is based on model-based testing. The presentation discusses several industrial case studies of applying model-based testing to automatically generate innumerable number of ready-to-run, executable test cases.
As a PVS-Studio's developer, I am often asked to implement various new diagnostics in our tool. Many of these requests are based on users' experience of working with dynamic code analyzers, for example Valgrind. Unfortunately, it is usually impossible or hardly possible for us to implement such diagnostics. In this article, I'm going to explain briefly why static code analyzers cannot do what dynamic analyzers can and vice versa. Each of these analysis methodologies has its own pros and cons; and one cannot replace the other, but they do complement each other very well.
PVS-Studio analyzed the Boost library and found 7 potential bugs or issues. The issues included a misprint that caused division by zero, incorrect class member initialization, memory being released incorrectly with auto_ptr, a condition that would always be true due to unsigned socket type, another misprint where a variable wasn't assigned a value, potential for infinite loop when reading from a stream, and suspicious subtraction of identical values. Finding even a small number of issues in a heavily used and reviewed library like Boost demonstrates the tool's effectiveness at static analysis.
This document discusses program analysis methods and the Valgrind tool. It begins with an introduction to program analysis, including dynamic and static analysis. It then provides an example of bad code containing bugs and demonstrates how Valgrind can detect these bugs, such as invalid reads, writes, and memory leaks. The document also covers some limitations of Valgrind and describes additional tools in Valgrind for profiling and thread error detection. It concludes with sections on how Valgrind works using binary translation and an intermediate representation, as well as tuning Valgrind through suppression files and client requests.
The document discusses unit testing and automated testing. It defines various testing terminology like unit tests, integration tests, system tests, and regression tests. It emphasizes the importance of testing early and often to find bugs quickly, increase quality assurance, and improve code design for testability. Automating tests through continuous integration is recommended to efficiently run tests on new code commits and catch errors early. Test-driven development is introduced as a practice of writing tests before code to ensure all tests initially fail and the code is developed to pass the tests.
Analysis of PascalABC.NET using SonarQube plugins: SonarC# and PVS-StudioPVS-Studio
In November 2016, we posted an article about the development and use of the PVS-Studio plugin for SonarQube. We received great feedback from our customers and interested users who requested testing the plugin on a real project. As the interest in this subject is not decreasing, we decided to test the plugin on a C# project PascalABC.NET. Also, it should be borne in mind, that SonarQube have their own static analyzer of C# code - SonarC#. To make the report more complete, we decided to test SonarC# as well. The objective of this work was not the comparison of the analyzers, but the demonstration of the main peculiarities of their interaction with the SonarQube service. Plain comparison of the analyzers would not be fair due to the fact that PVS-Studio is a specialized tool for bug detection and potential vulnerabilities, while SonarQube is a service for the assessment of the code quality by a large number of parameters: code duplication, compliance with the code standards, unit tests coverage, potential bugs in the code, density of comments in the code, technical debt and so on.
There are three types of errors in programming: syntax errors, run-time errors, and logic errors. Syntax errors occur when code violates rules and prevent programs from running. Run-time errors are unpredictable and can be trapped using error handling. Logic errors produce unexpected results and are hardest to find, requiring debugging tools. Visual Basic provides debugging aids like breakpoints, stepping, and watch expressions to help locate logic errors.
VivaMP, system of detecting errors in the code of parallel C++ programs using...PVS-Studio
The article lists the results of investigation of mistakes made by programmers using C++ and OpenMP. Static analysis is offered for automatic detection of these errors. The description of VivaMP analyzer integrating into Visual Studio environment and implementing the set task is described.
Case Study: Porting a set of point cloud and triangle mesh processing C++ lib...PVS-Studio
The document discusses porting a C++ library for processing point clouds and triangle meshes from 32-bit to 64-bit. An Italian company called E.G.S. S.r.l. that develops 3D simulation solutions used a library called Leios Components that it wanted to port to 64-bit. They hired a company called OOO "Program Verification Systems" to help with the port using their code analyzer Viva64. Viva64 found and corrected issues allowing the large library to be successfully ported to 64-bit in a short timeframe.
Difficulties of comparing code analyzers, or don't forget about usabilityPVS-Studio
Users' desire to compare different code analyzers is natural and understandable. However, it's not so easy to fulfill this desire as it may seem at first sight. The point is that you don't know what particular factors must be compared.
Potential errors in 64-bit code may occur depending on compiler optimizations and input data sizes. Slight code changes can expose or hide errors, making them difficult to find. Optimizations may use 64-bit registers to avoid overflows, but minor code alterations could cause 32-bit registers and overflows. Therefore, code with potential errors is unstable and hard to test thoroughly.
I hope you have already rested from the 13-th lesson and now are ready to study one more important error pattern related to arithmetic expressions in which types of different capacities participate.
Viva64: working up of 64-bit applicationsPVS-Studio
Viva64 is a static code analysis tool that helps detect errors and issues when porting C/C++ applications to 64-bit platforms. It integrates directly with Visual Studio 2005, allowing developers to check for 64-bit portability issues and incorrect code constructions. Viva64 can analyze entire projects and provides detailed diagnostics and references to help developers understand and fix issues. While it cannot replace full testing, using Viva64 during development can significantly improve code quality and reduce bugs when porting to 64-bit.
Development of a static code analyzer for detecting errors of porting program...PVS-Studio
The article concerns the task of developing a program tool called static analyzer. The tool being developed is used for diagnosing potentially unsafe syntactic structures of C++ from the viewpoint of porting program code on 64-bit systems. Here we focus not on the problems of porting occurring in programs, but on the peculiarities of creating a specialized code analyzer. The analyzer is intended for working with the code of C/C++ programs.
The article is a report about testing of portability of Loki library with 64-bit systems with the help of Viva64 code analyzer performed by OOO "Program Verification Systems" Company. It contains recommendations for users of the library. The article will be also useful for the users of other libraries built on templates for it describes the peculiarities of analysis of such libraries.
Lesson 23. Pattern 15. Growth of structures' sizesPVS-Studio
A growth of structures' sizes is not an error by itself but it may lead to consumption of an unreasonably large memory amount and therefore to performance penalty. Let us consider this pattern not as an error but as a cause of 64-bit code inefficiency.
Mobile CRM Webinar: 6 Steps to Mobile ROI for Government AgenciesWaterfall Mobile
Given the importance of delivering meaningful content to a broad audience within the government sector, mobile presents a critical investment for government agencies. However, the mobile ecosystem’s complexity makes it challenging to scope a detailed roadmap. This webinar, from the Msgme Industry Insights series, details exactly how government agencies can be successful using mobile to engage their audience.
Interview with Dmitriy Vyukov - the author of Relacy Race Detector (RRD)PVS-Studio
This is an interview with Dmitriy Vyukov - the author of Relacy Race Detector (RRD) tool intended for verifying parallel applications. In this article you will learn about the history of creating RRD, its basic abilities and also about some other similar tools and the way they differ from RRD.
Traps detection during migration of C and C++ code to 64-bit WindowsPVS-Studio
Appearance of 64-bit processors on PC market made developers face the task of converting old 32-bit applications for new platforms. After the migration of the application code it is highly probable that the code will work incorrectly. This article reviews questions related to software verification and testing. It also concerns difficulties a developer of 64-bit Windows application may face and the ways of solving them.
Intel IPP Samples for Windows - error correctionPVS-Studio
This is one of my posts on how PVS-Studio makes programs safer. That is where and what types of errors it detects. This time it is samples demonstrating handling of the IPP 7.0 library (Intel Performance Primitives Library) we are going to examine.
Debugging and optimization of multi-thread OpenMP-programsPVS-Studio
The task of familiarizing programmers with the sphere of developing parallel applications is getting more and more urgent. This article is a brief introduction into creation of multi-thread applications based on OpenMP technology. The approaches to debugging and optimization of parallel applications are described.
Optimization in the world of 64-bit errorsPVS-Studio
1. The document discusses the difficulty of demonstrating 64-bit errors through simple examples due to compiler optimizations.
2. An example code is provided that contains two errors by using 32-bit integers to index into a large 64-bit array, but it works correctly due to compiler optimizations.
3. A small change is made to the code to prevent the optimizations and cause it to crash as expected when run with the errors.
4. The author notes that 64-bit errors can be hidden by optimizations and evade detection in debugging and testing, but still cause failures when changes are made or on new compiler versions. Close inspection is needed to find these subtle errors.
While porting 32-bit software to 64-bit systems there may appear some errors in the code of applications which were written in C++ language. The cause for these hides in the alteration of the base data types (to be more exact, in the relations between them) with the new hardware platform.
PVS-Studio, a solution for developers of modern resource-intensive applicationsPVS-Studio
The PVS-Studio tool
the Viva64 rule set for 64-bit software analysis;
the VivaMP rule set for parallel software analysis;
the general-purpose analysis rule set.
Licensing and pricing policy forPVS-Studio
About the OOO “Program Verification Systems” company
PVS-Studio advertisement - static analysis of C/C++ codeAndrey Karpov
This document advertises the PVS-Studio static analyzer. It describes how using PVS-Studio reduces the number of errors in code of C/C++/C++11 projects and costs on code testing, debugging and maintenance. A lot of examples of errors are cited found by the analyzer in various Open-Source projects. The document describes PVS-Studio at the time of version 4.38 on October 12-th, 2011, and therefore does not describe the capabilities of the tool in the next versions. To learn about new capabilities, visit the product's site <a>http://www.viva64.com</a> or search for an updated version of this article.
Difficulties of comparing code analyzers, or don't forget about usabilityPVS-Studio
Users' desire to compare different code analyzers is natural and understandable. However, it's not so easy to fulfill this desire as it may seem at first sight. The point is that you don't know what particular factors must be compared.
Difficulties of comparing code analyzers, or don't forget about usabilityAndrey Karpov
This document discusses the difficulties in comparing code analyzers based on usability. Simply comparing metrics like number of diagnostics or speed is unreasonable because they don't reflect how usable a tool is for a particular project or user. The document analyzes six usability issues with an analyzer integrated into Visual Studio compared to PVS-Studio when analyzing the eMule project, such as inability to save analysis results or filter duplicate messages. While the Visual Studio analyzer was faster, it took much longer to complete analysis due to usability issues. The document concludes that usability is very important for comparing analyzers and there is no single best tool, only what is better for a specific project and user.
This document provides an overview of using the PVS-Studio static code analysis tool for Visual C++ projects in Visual Studio. It describes how to install and configure PVS-Studio, analyze a project, work with diagnostic messages, use the incremental analysis feature to check for errors as code is written, and suppress false positives. The tool integrates directly into Visual Studio and can detect many types of errors like typos, logic errors, and security issues.
Static analysis is most efficient when being used regularly. We'll tell you w...Andrey Karpov
Some of our users run static analysis only occasionally. They find new errors in their code and, feeling glad about this, willingly renew PVS-Studio licenses. I should feel glad too, shouldn't I? But I feel sad - because you get only 10-20% of the tool's efficiency when using it in such a way, while you could obtain at least 80-90% if you used it otherwise. In this post I will tell you about the most common mistake among users of static code analysis tools.
What do static analysis and search engines have in common? A good "top"!PVS-Studio
Static code analysis tools and search engines aim to provide relevant results to users. Both rely on ranking results to prioritize those most likely to interest users. PVS-Studio, a static code analysis tool, uses statistical analysis of its output on sample code to identify frequent and prevalent error types. Graphs of error frequency help PVS-Studio developers optimize the tool by identifying and removing false positives while keeping errors likely to interest users.
64 bits, Wp64, Visual Studio 2008, Viva64 and all the rest...Andrey Karpov
The purpose of this article is to answer some questions related to safe port of C/C++ code on 64-bit systems. The article is written as an answer to the topic often discussed on forums and related to the use of /Wp64 key and Viva64 tool.
Comparison of static code analyzers: CppCat, Cppcheck, PVS-Studio and Visual ...Andrey Karpov
We have carried out a thorough comparison of four analyzers for C/C++ code: CppCat, Cppcheck, PVS-Studio and Visual Studio's built-in analyzer. It is a serious, large investigation that we had spent about 170 man-hours on and which, in our opinion, gives a good idea of the general state of things in static analysis nowadays.
The document discusses Visual Studio's live static code analysis feature. It explains that this feature analyzes code in real-time as it is written, without requiring compilation, to detect errors and potential issues based on installed code analyzers. The document demonstrates how to install and use code analyzers through examples, showing how analyzers detect issues and provide suggestions to fix problems directly in the code editor through light bulb notifications. It provides a case study walking through fixing various issues detected in sample code using suggestions from an analyzer to iteratively improve the code quality.
Static analysis is most efficient when being used regularly. We'll tell you w...PVS-Studio
The document discusses best practices for using static code analysis tools to maximize their effectiveness. It recommends: 1) Marking false positives to reduce future messages, 2) Using incremental analysis to check modified files, 3) Checking files modified in the last few days, and 4) Running analysis nightly on a build server. Following all recommendations provides the highest return on investment in static analysis by catching errors earlier in development.
How PVS-Studio does the bug search: methods and technologiesPVS-Studio
PVS-Studio is a static code analyzer, that searches for errors and vulnerabilities in programs written in C, C++ and C#. In this article, I am going to uncover the technologies that we use in PVS-Studio analyzer. In addition to the general theoretical information, I will show practical examples of how certain technology allows the detection of bugs.
Comparing Functionalities of PVS-Studio and CppCat Static Code AnalyzersAndrey Karpov
Our company develops two code analyzers to check C/C++ projects: PVS-Studio and CppCat. In this article, we are going to tell you about the functional differences between these two tools.
PVS-Studio and CppCat: An Interview with Andrey Karpov, the Project CTO and D...Andrey Karpov
The developers of PVS-Studio analyzer regularly publish new articles about their tool (and sometimes about other analyzers as well) where they share the analysis results of various software projects produced by the analyzer and demonstrate code samples in which defects were found. Quite recently, a new product, CppCat, was released, which is a lightweight version of PVS-Studio at a low cost - compared to that of its heavier counterpart. You can find a brief description of the PVS-Studio project for Visual C++ here and here, and for a description of the new product see the article "An Alternative to PVS-Studio at $250".
Static Analysis: From Getting Started to IntegrationAndrey Karpov
Sometimes, tired of endless code review and debugging, you start wondering if there are ways to make your life easier. After some googling or merely by accident, you stumble upon the phrase, "static analysis". Let's find out what it is and how it can be used in your project.
A Long-Awaited Check of Unreal Engine 4Andrey Karpov
On March 19, 2014, Unreal Engine 4 was made public available. Subscription costs only $19 per month. The source codes have also been published at the github repository. Since that moment, we have received quite a number of e-mails, twitter messages, etc., people asking to check this game engine. So we are fulfilling our readers' request in this article; let's see what interesting bugs the PVS-Studio static code analyzer has found in the project's source code.
Searching for bugs in Mono: there are hundreds of them!PVS-Studio
It's very interesting to check large projects. As a rule, we do manage to find unusual and peculiar errors, and tell people about them. Also, it's a great way to test our analyzer and improve all its different aspects. I've long been waiting to check 'Mono'; and finally, I got the opportunity. I should say that this check really proved its worth as I was able to find a lot of entertaining things. This article is about the bugs we found, and several nuances which arose during the check.
How the PVS-Studio analyzer began to find even more errors in Unity projectsAndrey Karpov
When developing the PVS-Studio static analyzer, we try to develop it in various directions. Thus, our team is working on plugins for the IDE (Visual Studio, Rider), improving integration with CI, and so on. Increasing the efficiency of project analysis under Unity is also one of our priority goals. We believe that static analysis will allow programmers using this game engine to improve the quality of their source code and simplify work on any projects. Therefore, we would like to increase the popularity of PVS-Studio among companies that develop under Unity. One of the first steps in implementing this idea was to write annotations for the methods defined in the engine. This allows a developer to control the correctness of the code related to calls of annotated methods.
How to Improve Visual C++ 2017 Libraries Using PVS-StudioPVS-Studio
The title of this article is a hint for the Visual Studio developers that they could benefit from the use of PVS-Studio static code analyzer. The article discusses the analysis results of the libraries in the recent Visual C++ 2017 release and gives advice on how to improve them and eliminate the bugs found. Read on to find out how the developers of Visual C++ Libraries shoot themselves in the foot: it's going to be interesting and informative.
The tool for programmers VivaMP is intended for helping OpenMP-based parallel software developers. The article gives a brief description of the program product.
Similar to Comparing PVS-Studio with other code analyzers (20)
How to Interpret Trends in the Kalyan Rajdhani Mix Chart.pdfChart Kalyan
A Mix Chart displays historical data of numbers in a graphical or tabular form. The Kalyan Rajdhani Mix Chart specifically shows the results of a sequence of numbers over different periods.
Monitoring and Managing Anomaly Detection on OpenShift.pdfTosin Akinosho
Monitoring and Managing Anomaly Detection on OpenShift
Overview
Dive into the world of anomaly detection on edge devices with our comprehensive hands-on tutorial. This SlideShare presentation will guide you through the entire process, from data collection and model training to edge deployment and real-time monitoring. Perfect for those looking to implement robust anomaly detection systems on resource-constrained IoT/edge devices.
Key Topics Covered
1. Introduction to Anomaly Detection
- Understand the fundamentals of anomaly detection and its importance in identifying unusual behavior or failures in systems.
2. Understanding Edge (IoT)
- Learn about edge computing and IoT, and how they enable real-time data processing and decision-making at the source.
3. What is ArgoCD?
- Discover ArgoCD, a declarative, GitOps continuous delivery tool for Kubernetes, and its role in deploying applications on edge devices.
4. Deployment Using ArgoCD for Edge Devices
- Step-by-step guide on deploying anomaly detection models on edge devices using ArgoCD.
5. Introduction to Apache Kafka and S3
- Explore Apache Kafka for real-time data streaming and Amazon S3 for scalable storage solutions.
6. Viewing Kafka Messages in the Data Lake
- Learn how to view and analyze Kafka messages stored in a data lake for better insights.
7. What is Prometheus?
- Get to know Prometheus, an open-source monitoring and alerting toolkit, and its application in monitoring edge devices.
8. Monitoring Application Metrics with Prometheus
- Detailed instructions on setting up Prometheus to monitor the performance and health of your anomaly detection system.
9. What is Camel K?
- Introduction to Camel K, a lightweight integration framework built on Apache Camel, designed for Kubernetes.
10. Configuring Camel K Integrations for Data Pipelines
- Learn how to configure Camel K for seamless data pipeline integrations in your anomaly detection workflow.
11. What is a Jupyter Notebook?
- Overview of Jupyter Notebooks, an open-source web application for creating and sharing documents with live code, equations, visualizations, and narrative text.
12. Jupyter Notebooks with Code Examples
- Hands-on examples and code snippets in Jupyter Notebooks to help you implement and test anomaly detection models.
Best 20 SEO Techniques To Improve Website Visibility In SERPPixlogix Infotech
Boost your website's visibility with proven SEO techniques! Our latest blog dives into essential strategies to enhance your online presence, increase traffic, and rank higher on search engines. From keyword optimization to quality content creation, learn how to make your site stand out in the crowded digital landscape. Discover actionable tips and expert insights to elevate your SEO game.
AI 101: An Introduction to the Basics and Impact of Artificial IntelligenceIndexBug
Imagine a world where machines not only perform tasks but also learn, adapt, and make decisions. This is the promise of Artificial Intelligence (AI), a technology that's not just enhancing our lives but revolutionizing entire industries.
Your One-Stop Shop for Python Success: Top 10 US Python Development Providersakankshawande
Simplify your search for a reliable Python development partner! This list presents the top 10 trusted US providers offering comprehensive Python development services, ensuring your project's success from conception to completion.
Generating privacy-protected synthetic data using Secludy and MilvusZilliz
During this demo, the founders of Secludy will demonstrate how their system utilizes Milvus to store and manipulate embeddings for generating privacy-protected synthetic data. Their approach not only maintains the confidentiality of the original data but also enhances the utility and scalability of LLMs under privacy constraints. Attendees, including machine learning engineers, data scientists, and data managers, will witness first-hand how Secludy's integration with Milvus empowers organizations to harness the power of LLMs securely and efficiently.
How to Get CNIC Information System with Paksim Ga.pptxdanishmna97
Pakdata Cf is a groundbreaking system designed to streamline and facilitate access to CNIC information. This innovative platform leverages advanced technology to provide users with efficient and secure access to their CNIC details.
Salesforce Integration for Bonterra Impact Management (fka Social Solutions A...Jeffrey Haguewood
Sidekick Solutions uses Bonterra Impact Management (fka Social Solutions Apricot) and automation solutions to integrate data for business workflows.
We believe integration and automation are essential to user experience and the promise of efficient work through technology. Automation is the critical ingredient to realizing that full vision. We develop integration products and services for Bonterra Case Management software to support the deployment of automations for a variety of use cases.
This video focuses on integration of Salesforce with Bonterra Impact Management.
Interested in deploying an integration with Salesforce for Bonterra Impact Management? Contact us at sales@sidekicksolutionsllc.com to discuss next steps.
TrustArc Webinar - 2024 Global Privacy SurveyTrustArc
How does your privacy program stack up against your peers? What challenges are privacy teams tackling and prioritizing in 2024?
In the fifth annual Global Privacy Benchmarks Survey, we asked over 1,800 global privacy professionals and business executives to share their perspectives on the current state of privacy inside and outside of their organizations. This year’s report focused on emerging areas of importance for privacy and compliance professionals, including considerations and implications of Artificial Intelligence (AI) technologies, building brand trust, and different approaches for achieving higher privacy competence scores.
See how organizational priorities and strategic approaches to data security and privacy are evolving around the globe.
This webinar will review:
- The top 10 privacy insights from the fifth annual Global Privacy Benchmarks Survey
- The top challenges for privacy leaders, practitioners, and organizations in 2024
- Key themes to consider in developing and maintaining your privacy program
Unlock the Future of Search with MongoDB Atlas_ Vector Search Unleashed.pdfMalak Abu Hammad
Discover how MongoDB Atlas and vector search technology can revolutionize your application's search capabilities. This comprehensive presentation covers:
* What is Vector Search?
* Importance and benefits of vector search
* Practical use cases across various industries
* Step-by-step implementation guide
* Live demos with code snippets
* Enhancing LLM capabilities with vector search
* Best practices and optimization strategies
Perfect for developers, AI enthusiasts, and tech leaders. Learn how to leverage MongoDB Atlas to deliver highly relevant, context-aware search results, transforming your data retrieval process. Stay ahead in tech innovation and maximize the potential of your applications.
#MongoDB #VectorSearch #AI #SemanticSearch #TechInnovation #DataScience #LLM #MachineLearning #SearchTechnology
Have you ever been confused by the myriad of choices offered by AWS for hosting a website or an API?
Lambda, Elastic Beanstalk, Lightsail, Amplify, S3 (and more!) can each host websites + APIs. But which one should we choose?
Which one is cheapest? Which one is fastest? Which one will scale to meet our needs?
Join me in this session as we dive into each AWS hosting service to determine which one is best for your scenario and explain why!
Project Management Semester Long Project - Acuityjpupo2018
Acuity is an innovative learning app designed to transform the way you engage with knowledge. Powered by AI technology, Acuity takes complex topics and distills them into concise, interactive summaries that are easy to read & understand. Whether you're exploring the depths of quantum mechanics or seeking insight into historical events, Acuity provides the key information you need without the burden of lengthy texts.
Ivanti’s Patch Tuesday breakdown goes beyond patching your applications and brings you the intelligence and guidance needed to prioritize where to focus your attention first. Catch early analysis on our Ivanti blog, then join industry expert Chris Goettl for the Patch Tuesday Webinar Event. There we’ll do a deep dive into each of the bulletins and give guidance on the risks associated with the newly-identified vulnerabilities.
1. Comparing PVS-Studio with other code
analyzers
Author: Evgeniy Ryzhkov
Date: 14.10.2009
Abstract
The article discusses comparison of PVS-Studio code analyzer with other solutions in this sphere. As PVS-
Studio contains modules for diagnosing 64-bit and parallel errors, it is compared to various types of
tools.
The approach to comparison
Programmers-users and developers of static code analyzers know how difficult it is to compare tools of
this type. For besides different classes of diagnosed errors, it is often very difficult to formalize diagnosis
of errors of even one type to "yes/no" estimate. However, such a comparison may be needed to make it
possible to select from several tools a solution fit for some particular task best.
In this article, we compare PVS-Studio code analyzer developed by OOO "Program Verification Systems"
with similar solutions. The article is intended for those users of the tool who want to have a basis for
choosing a code analyzer for their tasks.
What is compared to what?
The comparison is based on other articles by our authors where it is described more thoroughly what
had been compared and in what way. The readers who would like to make out the comparison methods
and principles may see additional materials.
We will single out two types of errors:
• "64-bit errors" - errors occurring when migrating from 32-bit systems to 64-bit ones or when
developing new 64-bit applications;
• "parallel errors" - parallel programming errors occurring when using OpenMP technology
incorrectly.
In the category "64-bit errors", the following four solutions participate: PVS-Studio (Viva64), PC-Lint,
C++-test, /Wp64 switch of Visual C++ or diagnostics emitted by Visual C++ x64 compiler. The choice is
explained by the fact that only these solutions have special support of diagnosing 64-bit errors described
in the documentation.
In the category "parallel errors", two solutions are compared: PVS-Studio (VivaMP) and Intel Parallel
Studio (Parallel Lint). These two tools allow diagnosing parallel errors when using OpenMP technology
on Windows-systems.
All the tools listed perform diagnosis of errors in C/C++ code.
2. Comparison of the tools was performed in the following way. For each group of errors (64-bit and
parallel errors) we created a base of patterns of errors described in the documentation for the tools
being compared. The tools to be compared were tested on the ability to detect errors of each type. The
results are given in the articles providing detailed comparisons of the tools. Proceeding from the results,
we gave a total estimate for each tool. This was done in the following way. If an error had been
diagnosed fully, the tool got 1 point; if partly, 0.5; if the error had not been diagnosed at all, 0 points.
Then a total estimate was calculated in per cent: 100% - all the error patterns had been detected; 0% -
no error patterns had been detected.
Diagnosis of 64-bit errors
Figure 1 - Results of comparing the tools for 64-bit error diagnosis
Here is an article providing a description of the base of error patterns and a detailed description of
comparison: "Comparison of analyzers' diagnostic possibilities at checking 64-bit code".
Let's explain the comparison results. It is not that some code analyzer is better and some other is worse.
But when diagnosing a particular type of errors ("64-bit errors") the analyzers show different results
and, fortunately, we can make our choice objectively.
We should specially mention the compiler switch /Wp64 in Visual Studio environment. Although this
switch is not a code analysis tool unlike other solutions mentioned here, it participated in the
comparison as well. Yet, its abilities of diagnosing 64-bit errors are very limited and this explains its low
3. total estimate. To learn more about it see the article "64 bits, Wp64, Visual Studio 2008, Viva64 and all
the rest...".
Diagnosis of parallel errors
Figure 2 - Results of comparing the tools for OpenMP parallel error diagnosis
Here is an article with a description of the base of error patterns and a detailed description of
comparison:"An unsuccessful attempt to compare PVS-Studio (VivaMP) and Intel C/C++ ("Parallel Lint")".
This kind of comparison is much more incorrect than comparison in the sphere of 64-bit error diagnosis.
The point is that the number of error patterns diagnosed in Intel Parallel Studio is rather large. But
documentation on these patterns is too poor. Ideally, the base of patterns should be enlarged with the
errors diagnosed by Intel Parallel Studio but we cannot do this yet. That is why Intel Parallel Studio got
few points. This situation is described more thoroughly in the article with the detailed description of
comparison.
Comparison results
This article's point was not to try to show weak points of other developers' tools. We just tried to show
those tasks at which PVS-Studio is good. There are two such tasks:
• diagnosis of 64-bit errors;
• diagnosis of parallel OpenMP errors.
What these two tasks is concerned, our tool surpasses other similar solutions. For other tasks, it is
reasonable to use more suitable tools.
References
1. Andrey Karpov. Comparison of analyzers' diagnostic possibilities at checking 64-bit code.
http://www.viva64.com/art-1-2-914146540.html
4. 2. Andrey Karpov. 64 bits, Wp64, Visual Studio 2008, Viva64 and all the rest...
http://www.viva64.com/art-1-2-621693540.html
3. Andrey Karpov. An unsuccessful attempt to compare PVS-Studio (VivaMP) and Intel C/C++
("Parallel Lint"). http://www.viva64.com/art-3-2-1186541094.html