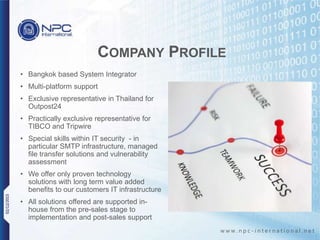
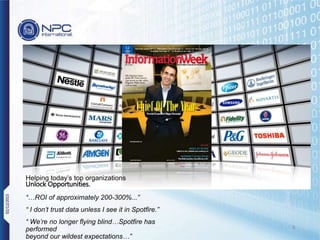
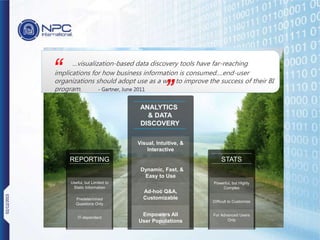
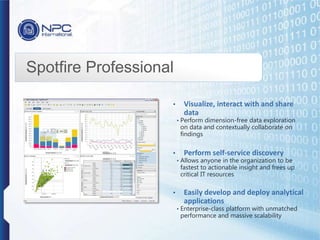
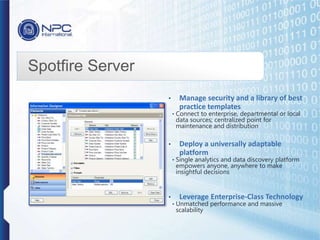
Discover the concept of 'on-the-fly' analysis with TIBCO Spotfire based on effortless of coding program for combining different types of file, cut cost of increasing in DB warehouse while DB growing, and real time analysis for digital era.
TIBCO Spotfire: Data Science in the EnterpriseTIBCO Spotfire
From Data to Insights in Internet Time
Eric Novik, Internal Analytics Group, TIBCO Spotfire
ANALYTICS AND VISUALIZATION FOR THE FINANCIAL ENTERPRISE CONFERENCE
June 25, 2013 The Langham Hotel Boston, MA
Presented by: Hector Martinez, Staff Solution Consultant, TIBCO Spotfire
TIBCO Spotfire and Teradata: First to Insight, First to Action; Warehousing, Analytics and Visualizations for the High Tech Industry Conference
July 22, 2013 The Four Seasons Hotel Palo Alto, CA
BIG DATA ANALYTICS MEANS “IN-DATABASE” ANALYTICSTIBCO Spotfire
Presented by: Dr. Bruce Aldridge, Sr. Industry Consultant Hi-Tech Manufacturing, Teradata
TIBCO Spotfire and Teradata: First to Insight, First to Action; Warehousing, Analytics and Visualizations for the High Tech Industry Conference
July 22, 2013 The Four Seasons Hotel Palo Alto, CA
Adapting to the exponential development of technologyDataWorks Summit
Digitalization is impacting every industry in every economy, disrupting markets and upending competitive hierarchies. Across every business discipline, from operations and manufacturing to marketing and sales, companies are struggling to integrate new data, new analytics, and new technologies into their existing processes and practices. Companies that successfully adapt to these new and accelerating changes will outperform their competitors
The new challenges require new ways of organizing, new social and technical architectures. In this session, we identify the key challenges businesses face in the era of massive digitalization, and the organizational and architectural steps that will enable savvy competitors to find business value in this time of tumultuous technical change.
The gap between first steps and effective digitalization is large. For instance, businesses can run scrum teams without being agile; can have a data science lab without supporting autonomous model deployment to consumer-facing processes and applications; and can stand up a Hadoop ecosystem without understanding how the components fit together or what to do with it.
Based on our deep experience with dozens of clients, we describe key differences in levels of technology maturity, and practical tactics leading companies are using to turn digital innovation into competitive advantage.
Speaker
Santiago Cabrera-Naranjo, Consulting Director, Teradata
Hear how Manulife Asia has built an environment that enables the company to solve business-critical problems across many countries. What began in 2017 as an update to their enterprise architecture now spans everything from infrastructure to applications, powering their entire digital backbone. It includes fraud identification, real-time investment dashboards, advanced analytics and machine learning, and digital connection apps that talk to customers for claims, support, and more. Learn the importance hard work, coordination, discipline, and an agile methodology play in deciding which use cases they will focus on to deliver new services in an environment where everything is time sensitive and business requirements shift regularly.
Speaker: Ellen Wu, Head of Asia Data Office, Global Data Enablement and Governance, Manulife
Data Beats Emotions – How DATEV Generates Business Value with Data-driven Dec...DataWorks Summit
Four years ago we started with a data analytics platform to learn more about how our customers use our on-premise software and how it behaves out in the fields regarding function usage, exception rates and overall performance.
The talk is about the journey we had to take, coming from an existing web apps statistics tracking system to our current and still evolving Hadoop based ETL system. This includes the current technologies we use and the approcache on how we support reporting and dashboards.
This new Hadoop platform is used to collect, transform, enrich with data warehouse data, and analyze millions of log files every day. The generated insights help us to make data driven decisions for portfolio management, UX-Design, and overall software quality improvements with real business value.
You will hear about the Dos and Donts we learned, what we think are best practices, and the new challenges we have to deal with while data volume and management awareness is still emerging.
With the explosive growth of IoT, the edge is predicted to grow to 25 billion connected devices by 2020. But, enterprises are still struggling to manage hundreds of devices that they have deployed. Not from a device management standpoint but more from a data management standpoint. Enterprises are unable to capture and process data directly from the edge devices for immediate analysis and gaining real-time actionable intelligence. So, if that is not possible, IoT initiatives are failing to become successful. How can an enterprise gather real-time data from edge devices? How can it change the behavior of such data collection processes? How can it ensure that data will be analyzed immediately? How can it understand the lineage of the data from edge to enterprise? How can it manage edge agents? What is an edge management hub? Attend this session to get a detailed understanding of key edge management challenges and how to address them with the correct solutions.
(Bjørn Kvernstuen + Tommy Jocumsen, Norwegian Directorate for Work and Welfare) Kafka Summit SF 2018
NAV (Norwegian Work and Welfare Department) currently distributes more than one third of the national budget to citizens in Norway or abroad. We’re there to assist people through all phases of life within the domains of work, family, health, retirement and social security. Events happening throughout a person’s life determines which services we provide to them, how we provide them and when we provide them.
Today, each person has to apply for these services resulting in many tasks that are largely handled manually by various case workers in the organization. Their access to insight and useful information is limited and often hard to find, causing frustration to both our case workers and our users. By streaming a person’s life events through our Kafka pipelines, we can revolutionize the way our users experience our services and the way we work.
NAV and the government as a whole have access to vast amounts of data about our citizens, reported by health institutions, employers, various government agencies or the users themselves. Some data is distributed by large batches, while others are available on-demand through APIs. We’re changing these patterns into streams using Kafka, Streams API and Java microservices. We aim to distribute and act on events about birth, death, relationships, employment, income and business processes to vastly improve the user experience, provide real-time insight and reduce the need to apply for services we already know are needed.
This talk will touch on the following topics:
-How we move from data-on-demand to streams
-How streams of life events will free our case workers from mundane tasks
-How life and business events make valuable insight
-How we protect our users and comply with GDPR
-Why we chose Confluent Platform
This presentation was delivered at the BI SIG in Palo Alto. It provides an overview of the market shift away from on-premise solutions to on-demand in the business intelligence industry.
Who changed my data? Need for data governance and provenance in a streaming w...DataWorks Summit
Enterprises have dealt with data governance over the years, but it has been mostly around master data. With the advent of IoT/web/app streams everywhere in the ecosystem surrounding an enterprise, data-in-motion has become a strong force to reckon. Data-in-motion passes through several levels of transformations and augmentation before it becomes data-at-rest. Through this, it is pertinent to preserve the sanctity of such data or at least track the provenance through the various changes. This is very important for a lot of verticals where there are strong regulatory and compliance laws that exist around "who changed what."
This session will go into detail around some specific use cases of how data gets changed, how it can be tracked seamlessly and why this is important for certain verticals. This will be presented in two parts. The first part will cover the industry angle to this and its importance weighed in by several regulatory bodies. The second part will address the technology aspect of it and discuss how companies can leverage Apache Atlas and Ranger in conjunction with NiFi and Kafka to embrace data governance and provenance of their data streams.
Speakers
Dinesh Chandrasekhar, Director, Hortonworks
Paige Bartley, Senior Analyst - Data and Enterprise Intelligence, Ovum
As one of the largest processors and controllers of global information, IBM has embarked on a global program towards GDPR compliance readiness. Using the same methodology, services, and solutions as it does with clients, this session will demonstrate how this process can serve as a model for GDPR for any large enterprise. How this model can then be a basis to help comply with all other regulatory needs and be a framework for future business transformation and opportunity. Specifics will include:
• A summary to the needs and opportunities of the GDPR regulation
• With the time left, where are you, what can still be done
• A prescriptive phased methodology of execution
• Core solution technical measures and capabilities
• Key GDPR actionable outcomes by stakeholder
The focus is on discovering, mapping, and managing personal data for GDPR, along with data protection and compliance, on Hadoop in a sustainable way.
Speaker
Richard Hogg, Global GDPR Evangelist, IBM
Driven by data - Why we need a Modern Enterprise Data Analytics PlatformArne Roßmann
In order to turn data into opportunities, you need to build a modern data analytics platform. But because literally everything changes so fast, built-in flexibility is paramount.
This presentation covers:
- how to leverage all your data to generate insights
- the capabilities needed to build a flexible platform
- how to incorporate sustainability requirement
How a Media Data Platform Drives Real-time Insights & Analytics using Apache ...Databricks
Roularta is a leading publishing company in Belgium. As digital news and channels move at a rapid pace and contain massive volumes of data, Roularta decided in 2019 to invest in a Spark-based data platform to drive true real-time website analytics and unlock insights on previously untouched (big) data sources. In this talk we’ll first explain why and how Roularta embarked from a classical data warehouse to a Spark-based Lakehouse using Delta. We’ll outline the series of publishing & marketing use-cases done in the last 12 months and highlight for each use-case the advantages of Spark and how the team further tuned performance to truly deliver insights with high velocity.
So why hasn’t everyone already moved to the Cloud? Why hasn’t everyone already transformed into a data-driven organization? What obstacles are standing the way? How should organizations get started on their journey? Financial institutions are quickly embracing the speed and agility that a cloud-based digital transformation can provide. This session will provide an overview for how retail banking, investment banking, and insurance can remove obstacles and launch a successful analytics journey to the cloud.
Deep Learning Image Processing Applications in the EnterpriseGanesan Narayanasamy
The presentation has many use cases covering the following Image classification: "The process of identifying and detecting an object or a feature in a digital image or video," the report states. In retail, deep learning models "quickly scan and analyze in-store imagery to intuitively determine inventory movement."
Voice recognition: "The ability to receive and interpret dictation or to understand and carry out spoken commands. Models are able to convert captured voice commands to text and then use natural language processing to understand what is being said and in what context." In transportation, deep learning "uses voice commands to enable drivers to make phone calls and adjust internal controls - all without taking their hands off the steering wheel."
Anomaly detection: "Deep learning technique strives to recognize abnormal patterns which don't match the behaviors expected for a particular system, out of millions of different transactions. These applications can lead to the discovery of an attack on financial networks, fraud detection in insurance filings or credit card purchases, even isolating sensor data in industrial facilities signifying a safety issue."
Recommendation engines: "Analyze user actions in order to provide recommendations based on user behavior."
Sentiment analysis: "Leverages deep learning-heavy techniques such as natural language processing, text analysis, and computational linguistics to gain clear insight into customer opinion, understanding of consumer sentiment, and measuring the impact of marketing strategies."
Video analysis: "Process and evaluate vast streams of video footage for a range of tasks including threat detection, which can be used in airport security, banks, and sporting events."
Making Enterprise Big Data Small with EaseHortonworks
Every division in an organization builds its own database to keep track of its business. When the organization becomes big, those individual databases grow as well. The data from each database may become silo-ed and have no idea about the data in the other database.
https://hortonworks.com/webinar/making-enterprise-big-data-small-ease/
Building Identity Graph at Scale for Programmatic Media Buying Using Apache S...Databricks
The proliferation of digital channels has made it mandatory for marketers to understand an individual across multiple touchpoints. In order to develop market effectiveness, marketers need have a pretty good sense of its consumer’s identity so that it can reach him via mobile device, desktop or a big TV screen on living room. Examples of such identity tokens include cookies, app IDs etc.A consumer can use multiple devices at the same time and so the same consumer should not be treated as different people in the advertising space. The idea of identity resolution comes with this mission and goal to have an omnichannel view of a consumer.
Streamline Data Governance with Egeria: The Industry's First Open Metadata St...DataWorks Summit
Learn about the industry's new open metadata standard Egeria, introduced in September by ODPi, The Linux Foundation’s Open Data Platform initiative. Egeria supports the free flow of standardized metadata between different technologies and vendor platforms, enabling organizations to locate, manage and use their data resources more effectively. Explore how Egeria's set of open APIs, types and interchange protocols to allow all metadata repositories to share and exchange metadata. From this common base, it adds governance, discovery and access frameworks for automating the collection, management and use of metadata across an enterprise. The result is an enterprise catalog of data resources that are transparently assessed, governed and used in order to deliver maximum value to the enterprise.
This presentation by ODPi Director John Mertic provides an introduction to Egeria, and explores how the standard provides a vendor-neutral approach to data governance. Learn how a group of companies led by ING, IBM and Hortonworks came together through the open source community to re-imagining data governance and delivered Egeria -- to automate the collection, management and use of metadata across organizations of any size and complexity. Learn how Egeria was built on open standards and delivered via Apache 2.0 open source license.
Digital Shift in Insurance: How is the Industry Responding with the Influx of...DataWorks Summit
The digital connected world is having an impact on the technology environments that insurers must create to thrive in the new era of computing. The nature of customer interactions, business processes from product, risk and claims management are continuously changing. During this session we will review recent research and insights from insurance companies in the life, general and reinsurance markets and discuss the implications for insurers as the industry considers implications from core systems, predictive and preventive analytics and improvements to customer experiences.
Millions of dollars are being spent annually by the insurance industry in InsurTech investments from risk listening, customer interactions (chatbots, SMS messaging, smart interactive conversations), to methods of evaluating claims (digital capture at notice of incident, dashcams, connected homes/vehicles).
These are all new types of data which the industry hasn't previously had to manage and govern.
Additionally, at the heart of this is how to create new business opportunities from data. We will also have an interactive conversation on discussing and exploring insurance implications of the new computing environment from AI, Big Data and IoT (Edge computing).
My Slidedeck about Common Data Service and Model. This technology is under development so content is subject to change and based on current service on 4/13/2018
Watch this webinar in full here: https://buff.ly/2MVTKqL
Self-Service BI promises to remove the bottleneck that exists between IT and business users. The truth is, if data is handed over to a wide range of data consumers without proper guardrails in place, it can result in data anarchy.
Attend this session to learn why data virtualization:
• Is a must for implementing the right self-service BI
• Makes self-service BI useful for every business user
• Accelerates any self-service BI initiative
The Agile Analyst: Solving the Data Problem with VirtualizationInside Analysis
The Briefing Room with Radiant Advisors and Cisco
Live Webcast Jan. 21, 2014
Watch the archive: https://bloorgroup.webex.com/bloorgroup/lsr.php?RCID=05e9d4ccbd2505ce15bc8de699f9c961
Today’s business analyst needs data from all kinds of places: the data warehouse, data marts, web services as well as local and departmental files and spreadsheets. The fact is, even seasoned analysts typically spend more than half their time hunting and gathering data, which impedes analytical insights and limits time to value. Increasingly, innovative organizations are turning to data virtualization as a faster path to analytics, thus expediting business impact.
Register for this episode of The Briefing Room to hear Analysts Lindy Ryan and John O'Brien of Radiant Advisors explain how analytical sandboxes and data virtualization can enable true analytic agility. They will be briefed by Marc Breissinger of Cisco Data Virtualization Business Unit, who will tout his company’s upcoming analytic platform Data Collage, a desktop tool for designed for analysts who need agile access to enterprise data. He will discuss how Data Collage allows users to easily combine data and accelerate the development of new analytics.
Visit InsideAnalysis.com for more information.
Accelerate Self-Service Analytics with Data Virtualization and VisualizationDenodo
Watch full webinar here: https://bit.ly/3fpitC3
Enterprise organizations are shifting to self-service analytics as business users need real-time access to holistic and consistent views of data regardless of its location, source or type for arriving at critical decisions.
Data Virtualization and Data Visualization work together through a universal semantic layer. Learn how they enable self-service data discovery and improve performance of your reports and dashboards.
In this session, you will learn:
- Challenges faced by business users
- How data virtualization enables self-service analytics
- Use case and lessons from customer success
- Overview of the highlight features in Tableau
Building the Artificially Intelligent EnterpriseDatabricks
This session looks at where we are today with data and analytics and what is needed to transition to the Artificially Intelligent Enterprise.
How do you mobilise developers to exploit what data scientists and business analysts have built? How do you align it all with business strategy to maximise business outcomes? How do you combine BI, predictive and prescriptive analytics, automation and reinforcement learning to get maximum value across the enterprise? What is the blueprint for building the artificially intelligent enterprise?
•Data and analytics – Where are we?
•Why is the journey only half-way done?
•2021 and beyond – The new era of AI usage and not just build
•The requirement – event-driven, on-demand and automated analytics
•Operationalising what you build – DataOps, MLOps and RPA
•Mobilising the masses to integrate AI into processes – what needs to be done?
•Business strategy alignment – the guiding light to AI utilisation for high reward
•Agility step change – the shift to no-code integration of AI by citizen developers
•Recording decisions, and analysing business impact
•Reinforcement-learning – transitioning to continuous reward
When and How Data Lakes Fit into a Modern Data ArchitectureDATAVERSITY
Whether to take data ingestion cycles off the ETL tool and the data warehouse or to facilitate competitive Data Science and building algorithms in the organization, the data lake – a place for unmodeled and vast data – will be provisioned widely in 2020.
Though it doesn’t have to be complicated, the data lake has a few key design points that are critical, and it does need to follow some principles for success. Avoid building the data swamp, but not the data lake! The tool ecosystem is building up around the data lake and soon many will have a robust lake and data warehouse. We will discuss policy to keep them straight, send data to its best platform, and keep users’ confidence up in their data platforms.
Data lakes will be built in cloud object storage. We’ll discuss the options there as well.
Get this data point for your data lake journey.
Accelerate Self-Service Analytics with Data Virtualization and VisualizationDenodo
Watch full webinar here: https://bit.ly/39AhUB7
Enterprise organizations are shifting to self-service analytics as business users need real-time access to holistic and consistent views of data regardless of its location, source or type for arriving at critical decisions.
Data Virtualization and Data Visualization work together through a universal semantic layer. Learn how they enable self-service data discovery and improve performance of your reports and dashboards.
In this session, you will learn:
- Challenges faced by business users
- How data virtualization enables self-service analytics
- Use case and lessons from customer success
- Overview of the highlight features in Tableau
Introducing Trillium DQ for Big Data: Powerful Profiling and Data Quality for...Precisely
The advanced analytics and AI that run today’s businesses rely on a larger volume, and greater variety, of data. This data needs to be of the highest quality to ensure the best possible outcomes, but traditional data quality tools weren’t designed for today’s modern data environments.
That’s why we’ve developed Trillium DQ for Big Data -- an integrated product that delivers industry-leading data profiling and data quality at scale, in the cloud or on premises.
In this on-demand webcast, you will learn how Trillium DQ:
• Empowers data analysts to easily profile large, diverse data sources to discover new insights, uncover issues, and report on their findings – all without involving IT.
• Delivers best-in-class entity resolution to support mission-critical applications such as Customer 360, fraud detection, AML, and predictive analytics.
• Supports Cloud and hybrid architectures by providing consistent high-performance processing within critical time windows on all platforms.
• Keeps enterprise data lakes validated, clean, and trusted with the highest quality data – without technical expertise in big data or distributed architectures.
• Enables data quality monitoring based on targeted business rules for data governance and business insight
The Connected Consumer – Real-time Customer 360Capgemini
With Business Data Lake technologies based on EMC’s Big Data portfolio it becomes possible to move away from channel specific analytics towards a 360 customer view.
This presentation will show how technologies like Spark, Hadoop, and Kafka help companies gain a real-time view of everything their customers do and make changes to customer touch points whether mobile, web, in-store, direct marketing or existing transactional systems.
Presented by Steve Jones, Vice President, Insights & Data, Capgemini at EMC World 2016
http://www.capgemini.com/emc
Data Integration for Both Self-Service Analytics and IT Users Senturus
See a cloud solution that enables data integration for applications such as Salesforce, NetSuite, Workday, Amazon Redshift and Microsoft Azure. View the webinar video recording and download this deck: http://www.senturus.com/resources/data-integration-tool-for-both-business-and-it-users/.
The rapid growth in self-service business analytics has created tremendous value for organizations, but in many cases has created tension between technical and business users. Technical teams have built solid data warehouses filled with trusted data from source systems such as sales, finance, and operations. Business teams are gaining tremendous insights by analyzing data warehouse information with traditional and new data discovery tools such as Cognos, Business Objects, Tableau, and Power BI.
The Informatica Cloud is a best-of-both-worlds solution that combines data integration for both business and IT users. It allows the following: 1) IT incorporates the business analyst’s data integration routines into the core, trusted data warehouse, 2) Business analysts can do data integration from both cloud-based and on-premise data sources, 3) Business analyst can use the industrial-strength data integration engine that IT teams have loved for years and 4) Integration for apps such as Salesforce, NetSuite, Workday, Amazon Redshift, Microsoft Azure, Marketo, SAP, Oracle and SQL Server.
Senturus, a business analytics consulting firm, has a resource library with hundreds of free recorded webinars, trainings, demos and unbiased product reviews. Take a look and share them with your colleagues and friends: http://www.senturus.com/resources/.
How Celtra Optimizes its Advertising Platformwith DatabricksGrega Kespret
Leading brands such as Pepsi and Macy’s use Celtra’s technology platform for brand advertising. To inform better product design and resolve issues faster, Celtra relies on Databricks to gather insights from large-scale, diverse, and complex raw event data. Learn how Celtra uses Databricks to simplify their Spark deployment, achieve faster project turnaround time, and empower people to make data-driven decisions.
In this webinar, you will learn how Databricks helps Celtra to:
- Utilize Apache Spark to power their production analytics pipeline.
- Build a “Just-in-Time” data warehouse to analyze diverse data sources such as Elastic Load Balancer access logs, raw tracking events, operational data, and reportable metrics.
- Go beyond simple counting and group events into sequences (i.e., sessionization) and perform more complex analysis such as funnel analytics.
This presentation gives an overview of StreamCentral technology targeted for IT professionals. StreamCentral is software to model and build Big Data Solutions. StreamCentral consists of a Big Data Solutions Modeler that not only makes it easy to model traditional BI/DW and Big Data solutions but also auto deploys the model on the latest innovations in Big Data Management solutions (like HP Vertica and SQL Server Parallel Data Warehouse). StreamCentral Big Data Server executes the model definition in real-time. StreamCentral drastically reduces the time to market, risk and cost associated with building traditional BI/DW and Big Data solutions!
How a Logical Data Fabric Enhances the Customer 360 ViewDenodo
Watch full webinar here: https://bit.ly/3GI802M
Organisations have struggled for years in understanding their customers, this has mainly been due to not having the right data available at the right point in time. In this session we will discuss the role of Data Virtualization in providing customer 360 degree view and look at some of the success stories our customers have told us about.
Join Cloudian, Hortonworks and 451 Research for a panel-style Q&A discussion about the latest trends and technology innovations in Big Data and Analytics. Matt Aslett, Data Platforms and Analytics Research Director at 451 Research, John Kreisa, Vice President of Strategic Marketing at Hortonworks, and Paul Turner, Chief Marketing Officer at Cloudian, will answer your toughest questions about data storage, data analytics, log data, sensor data and the Internet of Things. Bring your questions or just come and listen!
Explore our comprehensive data analysis project presentation on predicting product ad campaign performance. Learn how data-driven insights can optimize your marketing strategies and enhance campaign effectiveness. Perfect for professionals and students looking to understand the power of data analysis in advertising. for more details visit: https://bostoninstituteofanalytics.org/data-science-and-artificial-intelligence/
Show drafts
volume_up
Empowering the Data Analytics Ecosystem: A Laser Focus on Value
The data analytics ecosystem thrives when every component functions at its peak, unlocking the true potential of data. Here's a laser focus on key areas for an empowered ecosystem:
1. Democratize Access, Not Data:
Granular Access Controls: Provide users with self-service tools tailored to their specific needs, preventing data overload and misuse.
Data Catalogs: Implement robust data catalogs for easy discovery and understanding of available data sources.
2. Foster Collaboration with Clear Roles:
Data Mesh Architecture: Break down data silos by creating a distributed data ownership model with clear ownership and responsibilities.
Collaborative Workspaces: Utilize interactive platforms where data scientists, analysts, and domain experts can work seamlessly together.
3. Leverage Advanced Analytics Strategically:
AI-powered Automation: Automate repetitive tasks like data cleaning and feature engineering, freeing up data talent for higher-level analysis.
Right-Tool Selection: Strategically choose the most effective advanced analytics techniques (e.g., AI, ML) based on specific business problems.
4. Prioritize Data Quality with Automation:
Automated Data Validation: Implement automated data quality checks to identify and rectify errors at the source, minimizing downstream issues.
Data Lineage Tracking: Track the flow of data throughout the ecosystem, ensuring transparency and facilitating root cause analysis for errors.
5. Cultivate a Data-Driven Mindset:
Metrics-Driven Performance Management: Align KPIs and performance metrics with data-driven insights to ensure actionable decision making.
Data Storytelling Workshops: Equip stakeholders with the skills to translate complex data findings into compelling narratives that drive action.
Benefits of a Precise Ecosystem:
Sharpened Focus: Precise access and clear roles ensure everyone works with the most relevant data, maximizing efficiency.
Actionable Insights: Strategic analytics and automated quality checks lead to more reliable and actionable data insights.
Continuous Improvement: Data-driven performance management fosters a culture of learning and continuous improvement.
Sustainable Growth: Empowered by data, organizations can make informed decisions to drive sustainable growth and innovation.
By focusing on these precise actions, organizations can create an empowered data analytics ecosystem that delivers real value by driving data-driven decisions and maximizing the return on their data investment.
Techniques to optimize the pagerank algorithm usually fall in two categories. One is to try reducing the work per iteration, and the other is to try reducing the number of iterations. These goals are often at odds with one another. Skipping computation on vertices which have already converged has the potential to save iteration time. Skipping in-identical vertices, with the same in-links, helps reduce duplicate computations and thus could help reduce iteration time. Road networks often have chains which can be short-circuited before pagerank computation to improve performance. Final ranks of chain nodes can be easily calculated. This could reduce both the iteration time, and the number of iterations. If a graph has no dangling nodes, pagerank of each strongly connected component can be computed in topological order. This could help reduce the iteration time, no. of iterations, and also enable multi-iteration concurrency in pagerank computation. The combination of all of the above methods is the STICD algorithm. [sticd] For dynamic graphs, unchanged components whose ranks are unaffected can be skipped altogether.
2. Your System Integration Partner
TIBCO Spotfire Solution
Turn Your BigData into Business Value
For
3. MISSION STATEMENT
• IT must be business oriented to help support and optimize
business transactions as well as to secure proprietary data and
operations
• Modern businesses require that IT Solutions must in most cases
be provided with a high availability option to support operations
• No two businesses are the same – operating environments and
focuses differs: Service providers must be able to provide tailor
made advice and solutions
• Service providers who wish to grow their business should look to
enter into long term partnerships with their customers
w w w . n p c - i n t e r n a t i o n a l . n e t
02/12/2015
4. • Bangkok based System Integrator
• Multi-platform support
• Exclusive representative in Thailand for
Outpost24
• Practically exclusive representative for
TIBCO and Tripwire
• Special skills within IT security - in
particular SMTP infrastructure, managed
file transfer solutions and vulnerability
assessment
• We offer only proven technology
solutions with long term value added
benefits to our customers IT infrastructure
• All solutions offered are supported in-
house from the pre-sales stage to
implementation and post-sales support
COMPANY PROFILE
w w w . n p c - i n t e r n a t i o n a l . n e t
02/12/2015
5. • Network Solution
• Select Network Equipment and Servers
• E-mail infrastructure products and services
• Automation, Analytics & Messaging
• Business work, legacy application
integration
• Business Intelligent & Analytics solution
• Managed File Transfer Services
• Security Solution
• SMTP Security
• Web Gateway Security and Proxy Services
• Internal & External vulnerability scanning
and management with PCI compliance
• Application Firewall
• Log Analysis and Management
• Audit Control and Compliance
OUR SOLUTIONS
w w w . n p c - i n t e r n a t i o n a l . n e t
02/12/2015
7. ENTERPRISE CUSTOMERS IN THAILAND
w w w . n p c - i n t e r n a t i o n a l . n e t
02/12/2015
8. 8
Helping today’s top organizations
Unlock Opportunities.
“…ROI of approximately 200-300%...”
“ I don’t trust data unless I see it in Spotfire.”
“ We’re no longer flying blind…Spotfire has
performed
beyond our wildest expectations…”
02/12/2015
11. …visualization-based data discovery tools have far-reaching
implications for how business information is consumed….end-user
organizations should adopt use as a way to improve the success of their BI
program. - Gartner, June 2011
“ “
ANALYTICS
& DATA
DISCOVERY
REPORTING
Useful, but Limited to
Static Information
Predetermined
Questions Only
IT-dependent
STATS
Powerful, but Highly
Complex
Difficult to Customize
For Advanced Users
Only
Visual, Intuitive, &
Interactive
Dynamic, Fast, &
Easy to Use
Ad-hoc Q&A,
Customizable
Empowers All
User Populations
02/12/2015
12. Spotfire Value Drivers
Fastest to Actionable
Insight
Instantly turn insight into action by enabling anyone to
rapidly discover hidden insights and quickly collaborate
in context
Universal Adaptability
Leverage a single analytics and data discovery
platform to empower anyone, anywhere to make
insightful decisions
Self-Service Discovery
Freely explore data to any level of detail, radically
accelerating decision making, while dramatically reducing
dependence on IT
Visibility Into the
Unknown
Discover unexpected insights hidden in Big Data and
Real-Time Events to immediately identify strategic
business opportunities or threats.
02/12/2015
16. Stats
Crystal Reports
IBI Focus
Brio
Impromptu
SAS
SPSS
R
Dashboards
EPM
Excel
The Shift to Spotfire Analytics
Metaphor
Essbase
Cognos PowerPlay
Microsoft AS
MOLAP
Business Objects
MicroStrategy
Seibel
ROLAPQ&R HOLAP
Cognos ReportNet
Business Objects
MicroStrategy
Qliktech
Reporting Analytics / Statistics
Data
MiningPredictive
Spotfire Analytics
Interactive
Analysis
02/12/2015
19. Spotfire is not Traditional BI
Traditional BI:
• Static production reporting
• Navigation of known
questions
• Predefined data models
• Scorecards & dashboards
• Single data source
• IT centric
Spotfire Analytics
• Dimension-Free Data
Exploration
• Data Mashup
• Enterprise Class
• Predictive & Event-driven
• Contextual Collaboration
• Business User Centric
02/12/2015
20. • Effectively unlimited data
volumes
• Harness built-in power &
intelligence of analytical &
relational db’s
• Teradata, Oracle, and
MS SQL Server
• Execute calculations in-db,
visually explore via Spotfire
• Visualize data stored in
Microsoft SQL Server Analysis
Services cubes
Execute
Query
Conduct
Calculation
Visualize
& Explore
CUSTOMER
CUSTOMER NUMBER
CUSTOMER NAME
CUSTOMER CITY
CUSTOMER POST
CUSTOMER ST
CUSTOMER ADDR
CUSTOMER PHONE
CUSTOMER FAX
ORDER
ORDER NUMBER
ORDER DATE
STATUS
ORDER ITEM BACKORDERED
QUANTITY
ITEM
ITEM NUMBER
QUANTITY
DESCRIPTION
ORDER ITEM SHIPPED
QUANTITY
SHIP DATE
Go Beyond In-Memory
02/12/2015
21. Place screenshot here
Dimensions: Width 4.75” or 1425 px
PowerPoint effect:
format picture > “drop shadow rectangle”
Predictive Analytics Across the Enterprise
• Leverage Existing Skills and Models
• Embed SAS®, MATLAB®, R or S+ scripts
into your Spotfire apps through Spotfire
Statistics Services and access and run
them directly from the Spotfire core
platform
• Fastest to Actionable Insight
• Application authors can configure
applications to use statistical models with
no coding. With one click, the centrally
managed application can be deployed
over the Web to users.
• Predictive and Event Driven
• Immediately add deeper insights by
looking at data at rest and data in motion
to obtain the “two second advantage”
02/12/2015
22. Google-like end user experience
• User enters query in search box
• Data & content results are intuitively
displayed
• User interacts with results as needed
Quickly gain key actionable insight from structured
data as well as:
• Email
• Documents
• Social Media
• CMS & SharePoint content
• Contracts
• Etc…
Spotfire with Attivio Integration
Actionable Insights from a Structured Data & Unstructured Content
Unified View of Extreme Information
02/12/2015
26. Spotfire Professional
• Visualize, interact with and share
data
• Perform dimension-free data exploration
on data and contextually collaborate on
findings
• Perform self-service discovery
• Allows anyone in the organization to be
fastest to actionable insight and frees up
critical IT resources
• Easily develop and deploy analytical
applications
• Enterprise-class platform with unmatched
performance and massive scalability
27. Spotfire Server
• Manage security and a library of best
practice templates
• Connect to enterprise, departmental or local
data sources; centralized point for
maintenance and distribution
• Deploy a universally adaptable
platform
• Single analytics and data discovery platform
empowers anyone, anywhere to make
insightful decisions
• Leverage Enterprise-Class Technology
• Unmatched performance and massive
scalability
28. Spotfire Web Player
• Extend the reach of analytics
• With one click, analysis files can be made
available over the Web to internal users,
customers, suppliers and partners
• Be the fastest to actionable insight
• By leveraging Spotfire analytics inside
portals, applications or websites, visibility into
the unknown can be quickly obtained
• Explore and share everywhere
• Perform dimension free data exploration over
the Web and contextually share insights via
bookmarks, guided applications and social
media platforms
29. Spotfire Developer
• Automate, integrate and extend
• Complete SDK to meet the needs of custom
applications and business process integration
needs
• Universally adaptable
• Develop compiled extensions in Visual Studio
.NET with C#. A complete API reference and
overview is available:
http://spotfire.tibco.com/stn
• Enterprise Class
• Build upon the best visualization-based data
discovery platform with unmatched
performance and massive scalability
30. Application Data Services
• Pre-defined data abstraction of:
• SAP B/W and R3
• Oracle EBS
• Siebel CRM
• Salesforce.com
• Universally Adaptability
• Integrate Spotfire with existing enterprise
CRM, ERP and MFG systems, obtain high
level summaries of the most common
application objects and detailed access to
underlying application resources
• Enterprise Class
• Leverage enterprise data in the best
visualization-based data discovery platform
with unmatched performance and massive
scalability
31. TIBCO Enterprise Runtime for R
• Enterprise-class scalability and
stability for the agile R language
• Adapt and seamlessly implement
enterprise-grade predictive models in
hours, not days
• Self-service predictive analytics
• Explore and predict at will to discover
unknown patterns or emerging trends
• Predictive and Event Driven
• A powerful framework for business
analysts
Core TERR Engine:
Embed in
Applications
TERR under TSSS:
Distributed Analytics
TERR in Spotfire:
Analytic Applications
IntegratingTERR
32. TIBCO Silver® Fabric
• Elastic architecture and management
for enterprise data centers
• Scale up and down Spotfire Web
Player utilization in response to
changing business conditions
• Minimize operational costs by
optimizing data and server resources
33. Hardware:
• Processor For Windows: x86-64
(x64) processor. Minimum: Intel
Core 2 Duo or equivalent, 2 GHz or
higher
• RAM Recommended: 4 GB or
greater, Minimum: 2 GB
• Hard disk space 1 GB of free space
to complete installation; 500 MB
for base server software to execute
• Recommended 10 GB or greater
when TIBCO Spotfire Server 7.0.x is
configured with database on the
same machine.
TIBCO Spotfire Server 7.0.x System Requirement
Software:
• Operating System Microsoft
Windows Server 2012 R2
• Microsoft Windows Server 2012
• Microsoft Windows Server 2008 R2
• NOTE: Only 64-bit versions of the
Operating Systems are supported.
• Spotfire Server Database:
• Oracle or Microsoft SQL Server
(existing or ‘stand-alone’)
Web Browser (for Server
Administration/Configuration pages):
• Microsoft Internet Explorer 10, 11
• Mozilla Firefox 27 or higher
• Google Chrome 33 or higher
02/12/2015
38. • Spotfire Customer Quotes……. (choose the
quote content based on the target audiences)
02/12/2015
39. Spotfire Demo URL Links
• Insurance Cross-Sell and Up-Sell Analysis:
http://spotfire.tibco.com/demos/insurance-
crosssell-upsell?type=Featured
• Forecasting Employee Expenses with Event
Analytics:
http://spotfire.tibco.com/demos/event-
analytics-bundle?type=Demo+Videos
• Provide permission level to each type of
analysis viewer as following video link,
http://spotfire.tibco.com/qrt/3ZAWL/3ZAWL.ht
ml, at the mins of 4.44th
Note: This demo link should be adjusted according to the target
prospects/audience…
02/12/2015
40. Training Needs
Assessment
•Gather Requirements
•Understand User Roles
Training Plan
•Create training plan specific
to customer requirements
Develop and Deliver
Training
•Develop training materials (if
required)
•Deliver training per
recommended schedule
Continuous & Informal
Learning
•Web-based Training Task-
based references
•Community & Blogs
•Quickstart Guides
Context Formal Training Coaching Mentoring
& Support
Ongoing Learning
Jumpstarts
Awareness Sessions
Onsite
Blended
Regional
Custom Training
Consulting
Awareness Sessions
Community
Web-based Training
Tip of Week
Delta Training
Custom Training
Spotfire Educational Services
41.
42.
43. 43
Our Services
• Detailed Design And
Engineering
• Project Management
• System Integration and UAT
• Training
• Support, Operation &
Maintenance
• Spotfire Professional services
02/12/2015
44. Churn rate analysis
Customer behavior analysis
Investment portfolio analysis
Supply chain optimization
KPI of employee & supplier analysis
Production Optimization & machine management
Customer growth rate analysis
Marketing campaign performance & effectiveness monitoring
Attrition rate and life time value analysis
Banking
&
Finance
and
Telco
Manufacturi
ng Group
SME
group
02/12/2015
45. w w w . n p c - i n t e r n a t i o n a l . n e t
02/12/2015
Spotfire 5 will change the dynamics of the data discovery market.
We are tackling big data head-on, through our traditional & differentiating strengths of:
Dimension-free data exploration
Data mashup
Predictive & Event-driven
Contextual Collaboration
Enterprise-class
With Spotfire 5, customers now have the ability to do in-database analytics. In Spotfire 5 we are providing the unique ability to combine the power of in-db and in-memory in the same analysis scenario. For example, if there’s a need to visualize & interact with data residing in an analytic database or cube, we can do that. We can also allow the user to drill down to look at all the details they want using data on demand at the same time. This is something no one else can do right now.
In this release, we’re talking about harnessing the power of Teradata, Oracle, or Microsoft SQL Server databases. Having the ability to connect and visualize the data where it resides – directly in the database – means less data over the network and having Spotfire visualize only what’s needed.
Going forward, we will continue to improve our in-database capabilities and broaden the ecosystem of databases that we connect to.
NOTE TO PRESENTER: The quote shown on this slide is taken from Gartner report # G00213778: Emerging Technology Analysis: Visualization-Based Data Discovery Tools June 17, 2011. Encourage your customer to read that report.
--------------------------------------
As we’ve discussed, traditional Business Intelligence tools have focused on reporting. And while those legacy systems certainly have their place, they were originally architected to deliver data in static reports in an attempt to answer pre-determined questions. Frequently, though, users of those traditional systems must rely on already overburdened IT staffs to create new reports and to add new data sources to help users ask & answer follow-up questions. This is typically a very time-consuming exercise that doesn’t satisfy the immediate needs of the business. In a word, the IT-dependent nature of those traditional reporting-focused systems just does not lead to real time insights or to organizational agility. This is why so many users of those traditional systems try to speed up the process by dumping data from those static reports into spreadsheets, where they can have more direct control of the data. In fact, “Export to Excel” was the #1 requested feature of BI products not that long ago.
At the other end of this spectrum we find Statistical programming packages. These systems are very valuable for mining deep into vast data stores and applying predictive analytics and forecasting. But much like traditional BI systems, these stats packages require lots of IT involvement. Typically, IT professionals with programming backgrounds and with PhD-level experience in statistics are required to define and manage reports from these systems. Suffice it to say that a typical business user can find it very time consuming to truly leverage the full power of these highly sophisticated systems.
All this is not to say that traditional reporting and statistics don’t have an important role. What I am saying, though, is that these traditional methods are just not sufficient. Those traditional tools were build to solve different problems for users who had longer lead times. The prevalence of Microsoft Excel is testament to the inadequacy of these systems in today’s business environment.
The emergence of Data Discovery & Analytics is filling this precise need for business users who have been forced by the shortcomings of traditional approaches to turn to spreadsheets as their only option. Data Discovery & Analytics is aimed squarely at enabling users themselves to drill up, down, and across data -- free of the dimensional constraints and IT dependence that traditional approaches require. Data Discovery & Analytics platforms allow users to instantly ask new questions as they arise – in real time. To ask the unasked question. To see the unseen. To apply those “Deep Analytics” without being a PHD. To find the unknown unknowns.
NOTE TO SPEAKER: Each Spotfire value driver maps directly to Gartner’s 4-box model, “The Dimensions of Measuring for Business Value from BI Investments,” which is taken from the Gartner report, Examples of Defining Business Value for BI and Analytics Initiatives, by Bill Hostmann, published 26 September 2011, page 3. Gartner ID Number: G00218934. That 4-box model closely resembles the “Value of Spotfire” slides shown throughout this presentation.
------------------------------------
We deliver unrivaled value for our customers. We help them turn insight into action faster & better than anyone else can. Our focus is on speed, discovery, & user empowerment balanced with IT control, and enterprise-wide applicability; these are the hallmarks of what makes Spotfire so compelling for users across all company sizes, geographies, and industries.
Universal Adaptability is about leveraging a single analytics and data discovery platform to empower anyone, anywhere, to make insightful decisions.
Visibility into the Unknown is about immediately identifying strategic business opportunities or threats by quickly discovering unexpected insights hidden in Big Data and Real-Time Events.
Self-service Discovery enables end users to freely explore data to any level of detail, radically accelerating decision making while dramatically reducing dependence on IT.
Fastest to Actionable Insight is speed with agility. We help find users instantly turn insight into action by enabling anyone to rapidly discover hidden insights and quickly collaborate in context.
This build highlights the time and effort for an IT centric BI project.
With traditional BI, the process of report or dashboard creation starts with a business user providing detailed requirements to an IT developer. Based on these specifications and after many versions, IT developer builds a data model or a cube which involves joining various tables to answer the questions that business user would like to be answered. If the analysis requires accessing and combining data from new data sources then, an ETL routine has to be written to extract the data from operational sources such as ERP and CRM systems, format the data to standardize it and then load it into the right tables in the data warehouse or the cube. After this task, the metadata or the logical layer has to be built in the BI tool itself. Now the IT developer is finally in position to use the BI tool to build the report or dashboard that the business user has requested. After building the report and modifying it based on business user’s specifications, the IT developer publishes it.
If the User wants to add something new or make a change, IT has to go through many of these steps again before the users gets what they want.
Click thru the build
Emphasize that the Business User is now empowered to:
Access multiple data sources
leverages any data infrastructure / data integrity rules that may be in place
Gives them results NOW
Able to share with others in a structured manner as we are a platform
Do the build just before you get to Excel – this will allow you to frame the spectrum of BI and talk about the evolution of the market in the last 20 years
Ask the audience, what is the leading Analytic product on the market: click to bring up Excel
Then comment on the pitfalls here:
Only a desktop product
Not used for building analytic solutions
Not designed for managing solutions across a wide audience
Breaks the corporate data integrity
Spreadmarts occur because there is no management function
Next click then brings up Spotfire- position us a “platform” for analytics
Next click draws the red line and adds S+ to show the segment of the spectrum we fill
Remind the audience that this is where we live and that we pick up where traditional BI leaves off
With SF5, customers have the ability to do in-database analytics. That is, SF5 will dynamically generate a SQL or MDX query, send it directly to the db to have the db run its own calculations, and SF5 will get back just a results set to visualize. In SF5, we’re going beyond in-memory to leverage external analytic engines. Having the ability to connect and visualize the data where it resides – directly in the db – means less data over the network and having SF visualize only what’s needed.
SF5 will harness the power of Teradata, Oracle, or Microsoft SQL Server db’s as well as connect to Microsoft SQL Server Analysis Services cubes.
But that’s not all, in SF5, we’re also providing the unique ability to combine the power of in-db and in-memory in the same analysis scenario. For example, if there’s a need to visualize & interact with data residing in an analytic db or cube, we can do that in SF5, but also we allow the user to drill down to look at all the details they want using data on demand at the same time.
Spotfire 5 extends our leadership in our 3rd differentiator, Predictive & Event-Driven.
This theme in the release has two main aspects.
The 1st part is a brand new runtime engine that is R-compatible. We’re launching this engine with the name TIBCO Enterprise Runtime for R, or TERR, for short.
R is an open-source programming language and is very popular. People often build prototypes in R, but then typically re-implement their prototypes in another language for production purposes because R has never had enterprise scalability or stability. TERR brings enterprise-class scalability & stability to the R-language. So if your customer has developed in R, or plans to, they should use our new R-compatible engine, which provides very broad coverage across the vast majority of the most commonly used R scripts. Also, because R is open-source, enterprises have been very reluctant to bring it in house, as there is a risk about licensing open source IP. Again, TERR solves this concern, as TERR has clean licensing for enterprises.
TERR can help statisticians and especially statistical programmers build predictive models more quickly (in hours instead of days), test & assess the quality of the models against data, iterate on their models, and embed them in custom apps & OEM solutions that can be broadly shared with help from Stats Services. These are all must have's for enterprises.
The 2nd part of this theme is Self-Service predictive analytics.
This is a Spotfire-focused framework that enables a business analyst to:
Build, assess, and iterate models; Test models on new data; Manage multiple models; Embed models in applications to share them
This framework provides these specific tools:
Multiple Linear Regression; Logistic Regression; Classification Trees; Regression Trees
These are client-side tools for the business analyst that don’t require them to have a stats programming background. These new tools are located directly in the SF menu and execute locally, using the TERR engine behind the scenes. Stats services is not required to use the tools for ad hoc analysis. However, if the business analyst wants to deploy the predictive model they’ve created into a Spotfire application to run in the Web Player, then they’ll need StatServices.
Discovery-based data exploration + text search-based data exploration
Spotfire is Attivio’s ONLY platinum-level integration partner
Attivio provides a unified information access platform & search technology